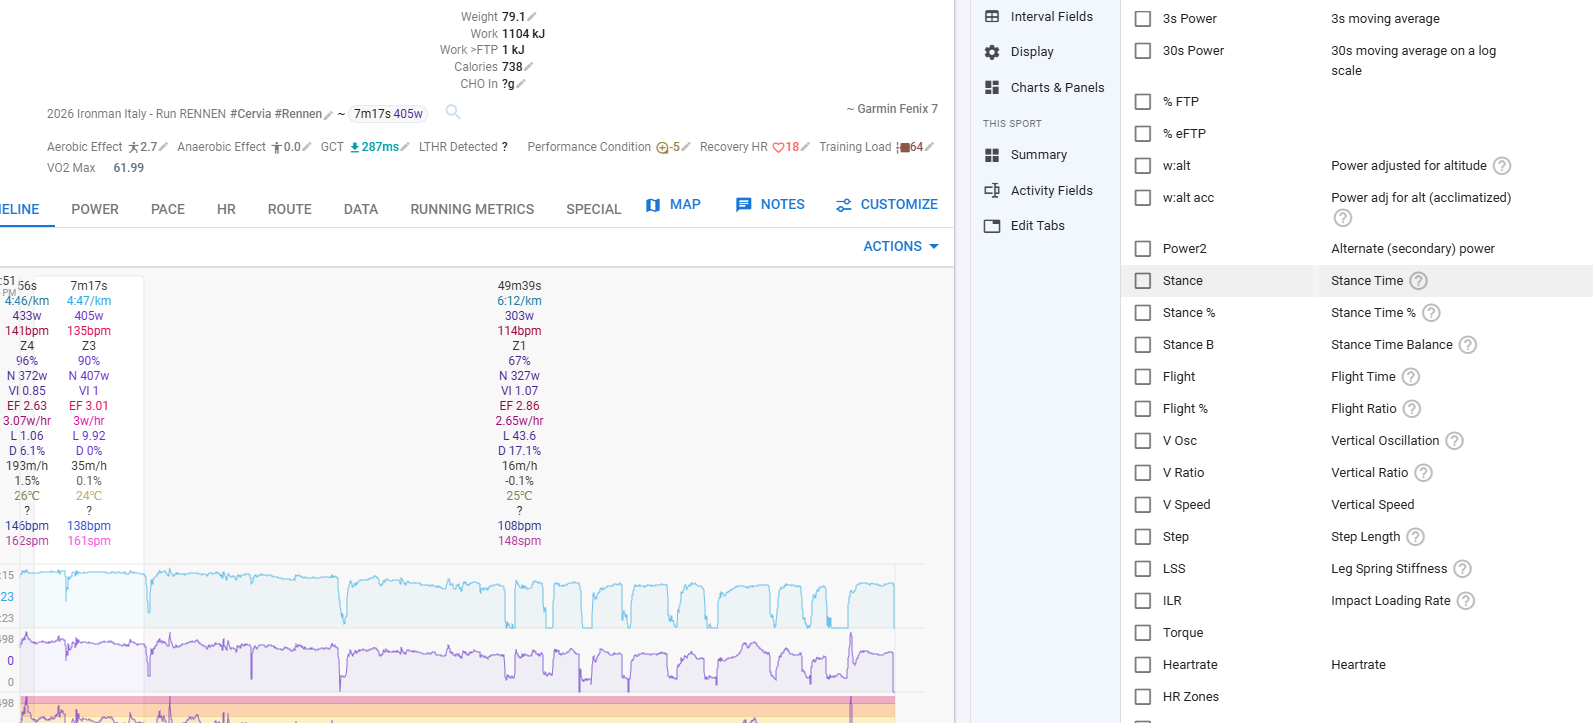
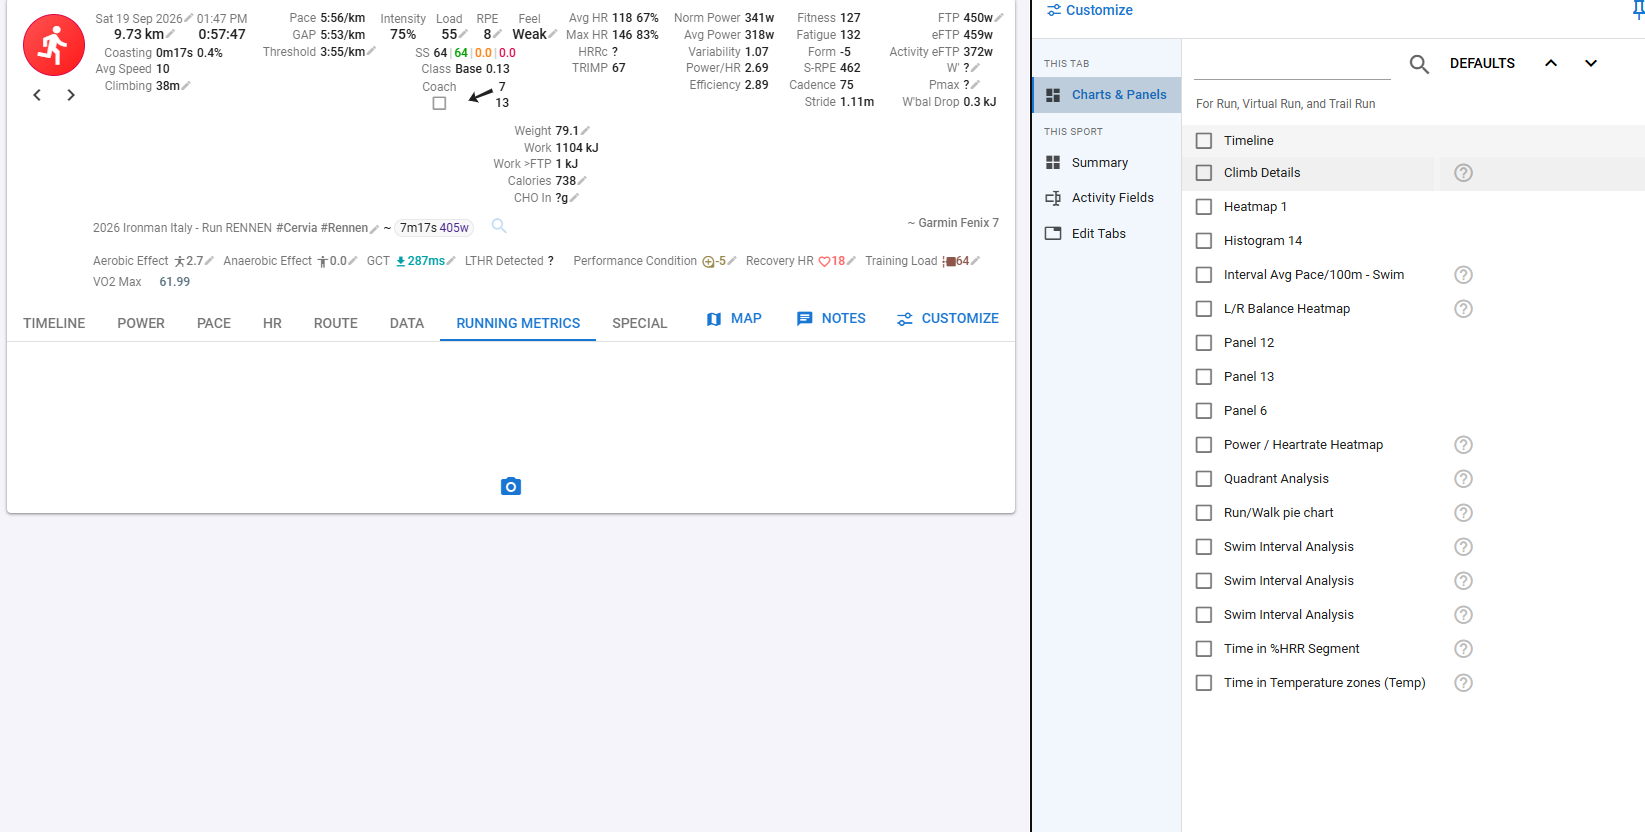
Hey everybody, got some (hopefully) great news for all the runners on Intervals.icu. We have been working on adding a whole bunch of running streams that you can all use (see here Working on advanced running metrics (GCT, Vertical Oscillation, Vertical Ratio, Step Length) — help us cover more devices before we ship it ).
The new streams
Twelve running streams. Most are read straight out of your FIT file; three we always work out ourselves, and two more we fill in when your device does not send them.
- Ground contact time — how long the foot is on the ground per step (ms)
- GCT percentage — GCT as a % of full stride time (2 steps) (%)
- GCT balance — share of ground contact on the left foot (%)
- Vertical oscillation — bounce of the torso per step (mm)
- Vertical ratio — vertical oscillation as a % of step length (%)
- Vertical speed — rate of climb, read straight from devices that report it (m/s)
- Step length — distance covered by one footstrike (mm)
- Leg spring stiffness — Stryd LSS: peak vertical force ÷ leg compression (kN/m)
- Impact loading rate — Stryd ILR: initial rate of rise of vertical force at footstrike (bw/s)
- Flight time — airborne time between footstrikes (ms)
- Flight ratio — airborne time as a % of the step cycle (%)
- Stride length — the same distance per footstrike as step length, but in metres (or feet if you use imperial units)
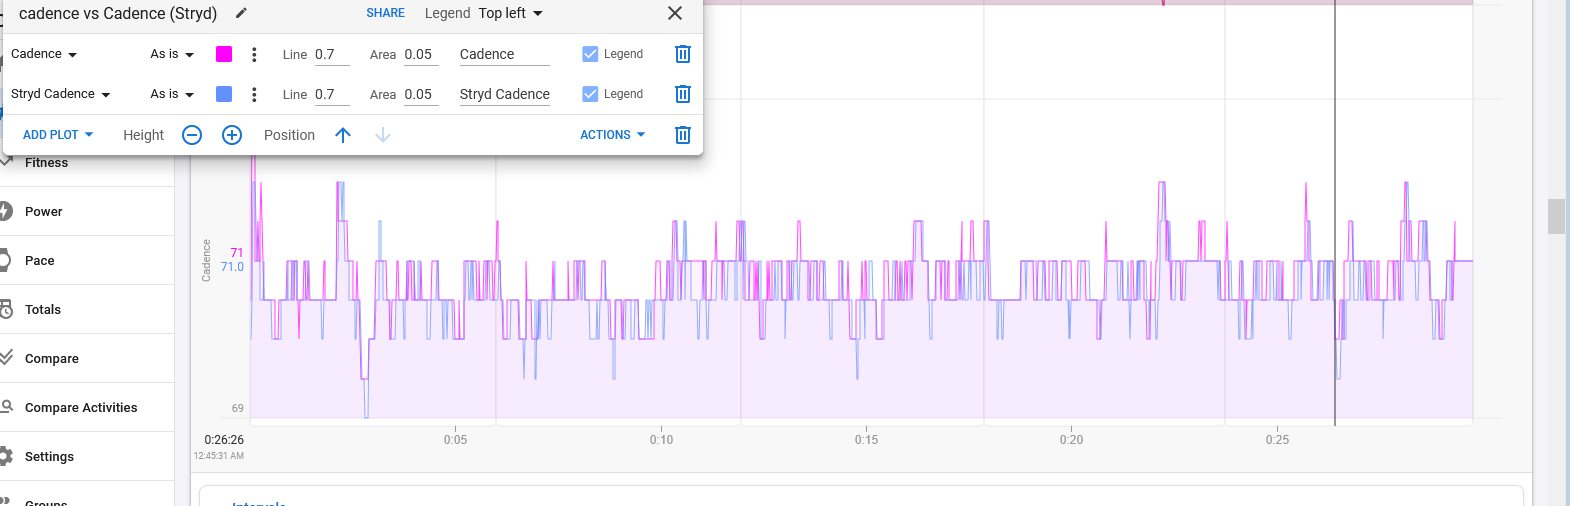
All of them are per-record, so they show up on the activity chart, in the API, and in scripts.
What they are actually good for
Ground contact time - faster, more experienced runners spend less time on the ground at a given pace. Rising GCT across an interval session is a good fatigue signal.
GCT percentage - GCT normalised for cadence, so you can compare an easy run against a tempo run without cadence muddying the picture
GCT balance - the left/right split. Persistent asymmetry beyond roughly 52/48 is worth a look; COROS put the injury-risk threshold at 55%.
Vertical oscillation - how much you bounce. Energy going up is energy not going forward, but it is not a “lower is always better” number on its own, which is exactly why vertical ratio exists.
Vertical ratio - oscillation divided by step length. This is the one to actually watch. It is the bounce normalised by what the bounce bought you, and unlike raw oscillation it is not correlated with your height.
Leg spring stiffness - a proxy for how well the leg stores and returns elastic energy. A good long-term monitor of running economy and of mechanics shifting (new shoes, fatigue, strength work).
Impact loading rate - how hard the initial impact spike is, in body weights per second. Goes up on downhills and with speed. Think of it as a load and injury-risk signal rather than a performance one.
Flight time and flight ratio - the complement of ground contact, and the two we are most pleased about. Flight ratio is a compact “bounciness of the stride” number that we can produce for every device that reports GCT and cadence, without the watch having to report anything extra.
Step length and stride length - the other half of speed (speed = cadence × step length). Useful for seeing whether a pace change came from turning the legs over faster or from covering more ground per step.
What we fill in for you
Three streams are always computed, and two more are computed only when your device does not send them. Cadence below is in rpm (one leg), so steps/min is 2 × rpm.
Step length - 1000 × speed ÷ (2 × cadence ÷ 60) - Only if the device sent none
GCT percentage - GCT × cadence ÷ 600 - Only if the device sent none - some COROS watches declare the field but never fill it
Flight time - max(0, 30000 ÷ cadence − GCT) - Always, given cadence + GCT
Flight ratio - 100 × flight time ÷ (flight time + GCT) - Always, given GCT
Stride length - Device step length ÷ 1000, else speed ÷ (2 × cadence ÷ 60) - Always. Prefers the device value sample by sample
Two things worth knowing about these:
- The computed step length falls out of speed and cadence, so it inherits whatever GPS noise you had outdoors and whatever calibration error your treadmill has indoors. It is an estimate, and it is not as good as a device that measures it directly.
- GCT percentage and flight ratio do not add up to 100, and that is not a bug. GCT percentage is a share of the full stride (two steps, which is how FIT defines it); flight ratio is a share of a single step. Different denominators.
Device coverage
Everything here comes out of FIT files - a direct upload, or a connection that hands us a FIT file (Garmin, COROS, Suunto, Wahoo, Rungap and so on). Confirmed against real files:
Garmin (FR945 with an HRM-Pro/Run type accessory, and that family generally) - The full native set: GCT, GCT %, GCT balance, vertical oscillation, vertical ratio, step length, plus session averages
COROS (APEX Pro, outdoor and virtual runs) - GCT, vertical oscillation, vertical ratio, step length, leg spring stiffness, plus session averages. No GCT balance; we compute the GCT percentage
Suunto (Vertical 2, and Run / Race 2 with the same firmware feature) - Native GCT and vertical oscillation. No vertical ratio, step length, GCT % or GCT balance; we compute step length from speed and cadence
Suunto + Stryd - The Suunto set plus leg spring stiffness and impact loading rate
Garmin + Stryd (e.g. Fenix) - Leg spring stiffness on top of whatever the watch reports itself
Apple Watch via Rungap - GCT, vertical oscillation, vertical ratio, step length, leg spring stiffness
Averages-only devices - Even with no per-record streams, we pick the averages out of the FIT session message, so the activity still gets numbers
Averages, on activities and on intervals
Nine new averages are stored on the activity and exposed on the API and to scripts:
- average_stance_time
- average_stance_time_percent
- average_stance_time_balance
- average_vertical_oscillation
- average_vertical_ratio
- average_vertical_speed
- average_step_length
- average_leg_spring_stiffness
- average_impact_loading_rate
We recompute these from the stream itself every time an activity is analysed, so cropping or editing a run keeps them in sync — exactly like average cadence. If your device only ever reports a session average with no per-record stream (Apple Watch, for example), we keep the value from the FIT session message. Zeros and gaps are left out of the mean. The existing average_stride is unchanged.
The same nine are now on every interval and lap, calculated over the interval’s samples and ignoring gaps. So you can watch GCT climb across a set of 400s, or compare vertical ratio between the work and recovery portions of a session, rather than only seeing one number for the whole run.
On the fitness chart and in search
The same nine averages are available as fitness chart fields, so you can plot vertical ratio or leg spring stiffness over a season and watch the trend. Days with more than one run are averaged weighted by moving time, so a long run counts for more than a short one.
They are also filter fields, so you can search your history for things like “runs where average GCT was over 260 ms” or “runs with LSS above 10 kN/m”.
FIT export
If you export a FIT file from Intervals, GCT, GCT %, GCT balance, vertical oscillation, vertical ratio, vertical speed and step length are written back as native record fields, and leg spring stiffness and impact loading rate as developer fields (“Leg Spring Stiffness” in kN/m and “Impact” in bw/s).
Six averages go onto the session message: GCT, GCT %, GCT balance, vertical oscillation, vertical ratio and step length. There is no native FIT session field for the others.