The exact algorithm for the moment is not going to come out, as for the vt1 at 160bpm, I would not take it for sure, the algorithm uses a trend change system, it is possible that the trend change has occurred earlier.
From that I’ve taken my Aerobic Threshold at 140W and LT1 160/170W, with my Z) (recovery) <115W, Z1 (Easy Endurance) 115-14OW, and the much lauded Z2 a la Couzens, Sam Milan et all (Steady Endurance) 140-165W and my Tempo Range 165-180W. Anything above that I regard as Threshold or VO2max above 220W. I.ve just done the same graph incorporating the DFA/a1 trace as well.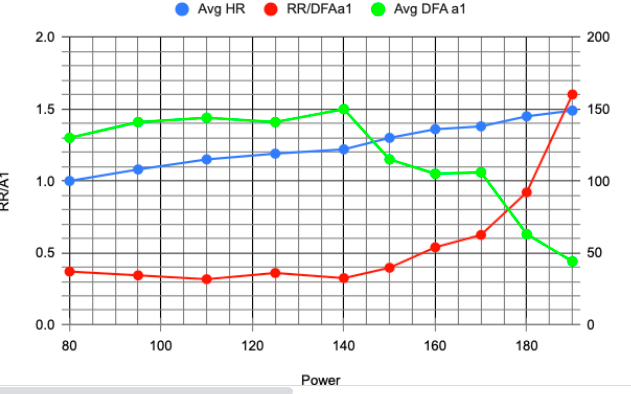
Note how it takes 2 decreases at 140 then 170W. Coincidence? - No idea
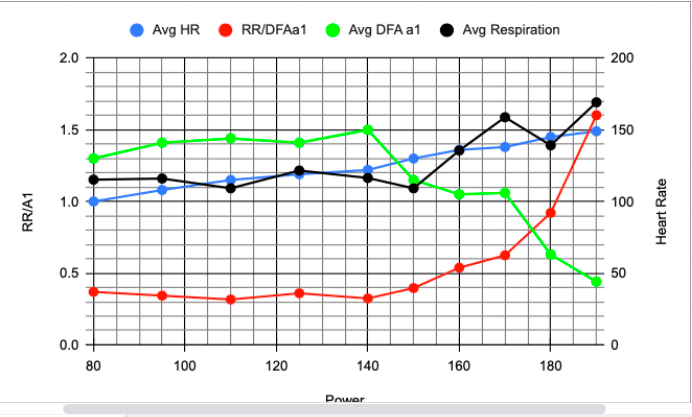
Put the respiratory rate on the graph
No sooner said than done
I’v multiplied the RR x 4 to show it better on the graph
Off for a bike fit now
1 Like
Amazing math and plot skills!
Looks like a ‘text book’ example. Deflection points for RR and a1 are very close.
RR/a1 shows a well defined deflection point.
And super nice to hear that you can compare to lactate!
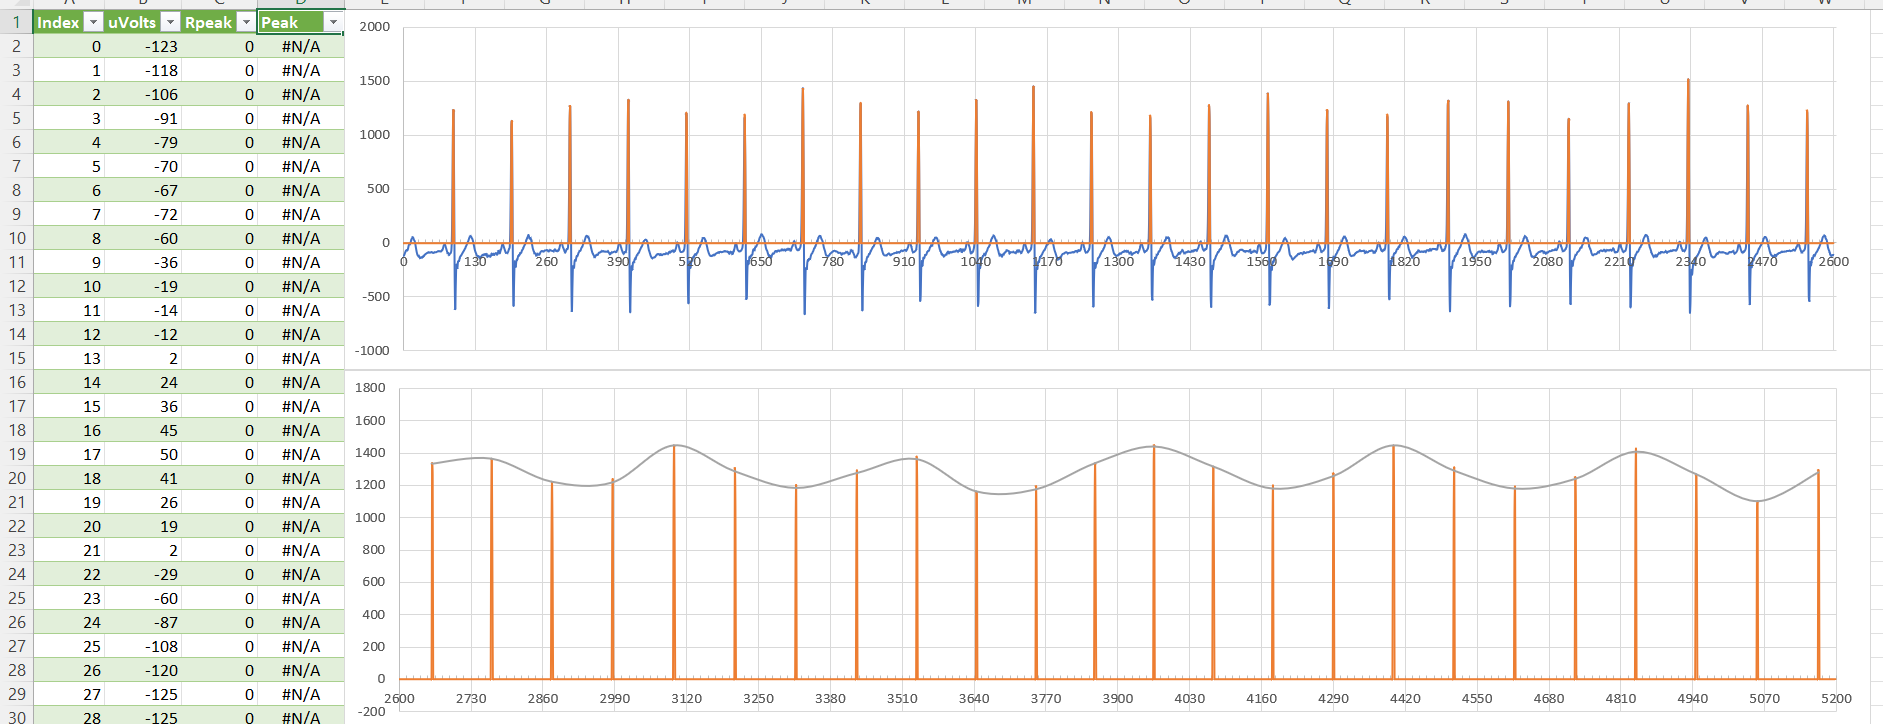
At this moment I’m working on EDR (ECG Derived Resp Rate). The Fitness HRV suite, dashboard and ECG, calculate a1 on a desktop using the more demanding preprocessing like FatMaxxer and Kubios. Difference with alphaHRV is minor but artefact and beat correction is just a bit better. It also uses the standard 2 min window unlike alphaHRV which uses a 200 beat window. The really neat part is the full single lead ECG trace from the Polar H10 strap. Turns out that this ECG trace can be used to extract the resp rate because the R-peak amplitude modulates with expanding chest. First impressions are that:
- the resp rate is closer to what you get when counting
- compared to resp rate from alphaHRV (calculated from HRV), the trend is very similar
This only works on pc and can’t be used for outdoor activities. But it might be an alternative to check validity of alphaHRV when testing indoors. Just like some users have a TymeWear shirt recording actual resp rate in a more accurate way.
Here’s a snapshot of a filtered ECG trace where I only keep the R-peaks from each beat. The peaks correspond to a full inhalation.
4 Likes
It’s 160W not 160 bpm…
1 Like
I thought I would give this a go this evening.
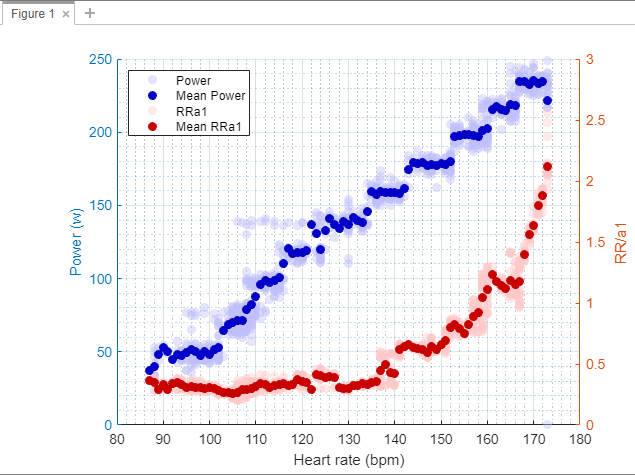
I used the protocol further up this thread of 15m @ 40%, then 6m steps adding 10% each time (4m for 100% and 110%). I then took the average from the last two minutes of each interval for the variables from your graph and plotted it. These are the results:
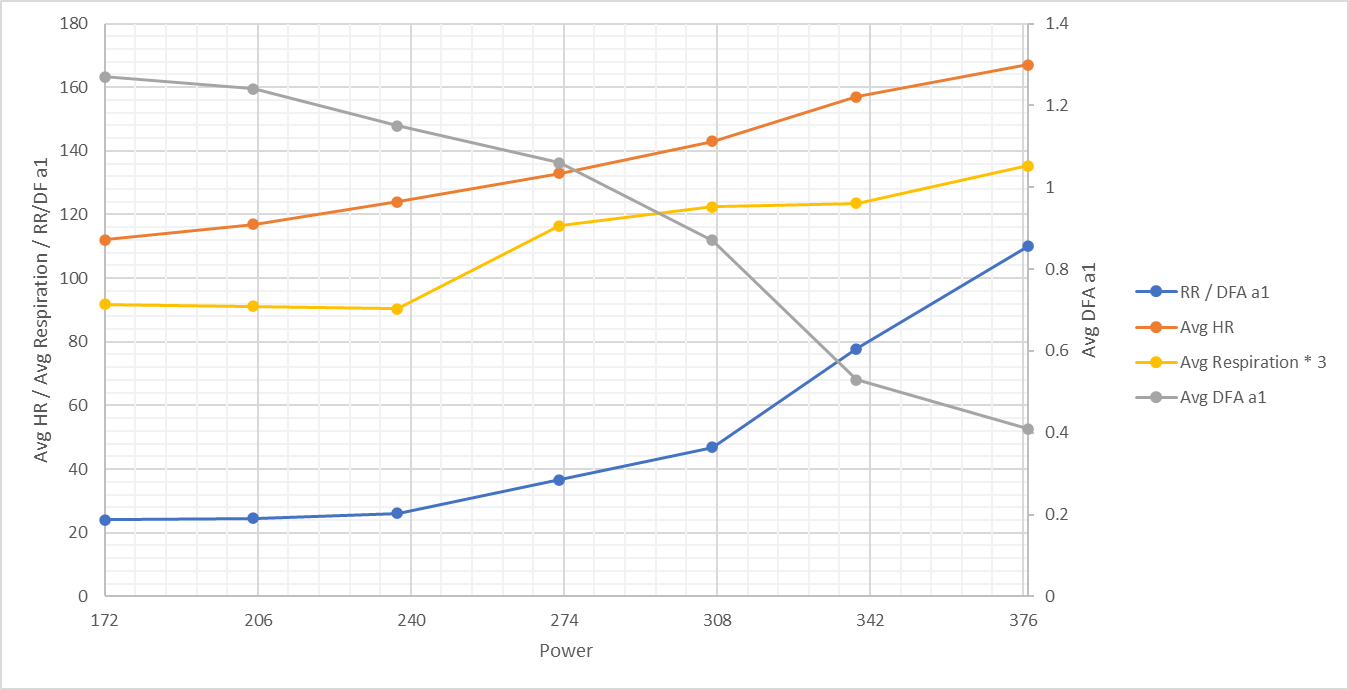
Note respiration rate multiplied by three for the plot.
Any thoughts or feedback on how to interpret the results would be appreciated.
If I was to do this again, would it be worth jumping up in smaller steps to potentially get more definition around the turn point(s)?
2 Likes
If that was my curve (and I wish it was) I’d be taking my Aerobic Threshold @ 240W with my Zone 2 Steady Zone 240-275W and mt Z1 Easy Endurance 200-240W. Does that line up with what you felt were your zones before the test or is anything significantly different. Note I’m not a expert in this at all.
Do you know what your ftp is?
1 Like
Remember to contextualise it with the weight, it is not the same 240w with 70kg than with 80kg. 
Would anyone be so kind as you share a spreadsheet/ the maths to produce these graphs so I can give this a try and share results please? Understand if you don’t want to as you have done the hard work producing them 
I’ll give it a go when I get the chance this weekend. Do you know how to use Google Sheets/Spreadsheets in general. I’m only asking because a lot of my friends wouldn’t have a clue as to what we are talking about.
2 Likes
Thanks that would be great!
I use them both daily to a varying degree so I know my way around etc. Lets see what you can kindly share and I will learn from there - always keen to do so.
The exact algorithm for the moment is not going to come out
fair enough
In the meantime, I have been playing with Python with an implementation of mine. Since I find the math behind DFA interesting, I wanted to give it a go. Here is the current result I got after an hour of playing around:
(blue - my implementation, orange - alphaHRV from fit file):
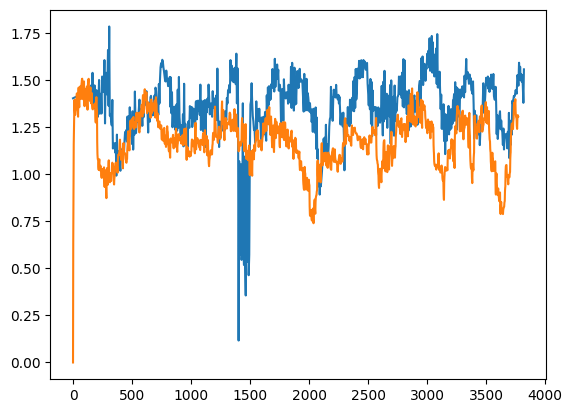
There are some issues with the sync, absolute values and artifact filtering, but now I can change all values of the DFA, time windows, etc.
I think HRV data can be pulled for activities for which the alpha HRV app wasn’t installed, so as to enable analysis post-factum. I have a lactate test from a couple of months back and would like to compare the DFA value to it once I get it done.
2 Likes
Here we go. I.ve had to cut and paste into the thread directly as I don’t know how to attach a file on this forum.
This is what I do
- Dual record on my Garmin with Autolap set to 90s and Auto pause off. I use Xert to play the workout in Erg mode (Other cycling apps are available)
- Make sure the Garmin recording is saved to Intervals.icu
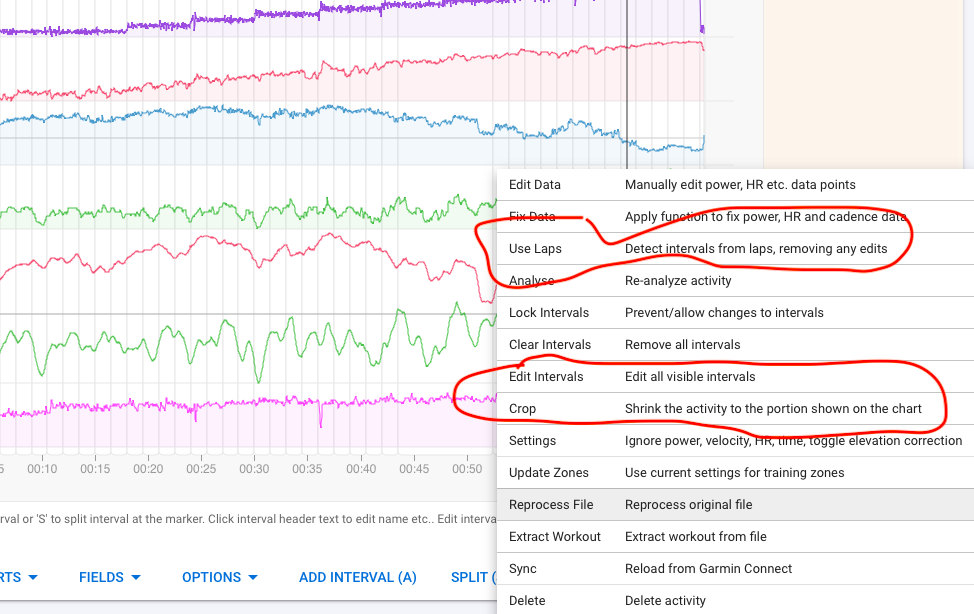
- Open it and crop the test portion of it using Intervals crop facility
- Then click Use Laps which will insert the 90 sec laps
- Click Interval Data on the left panel
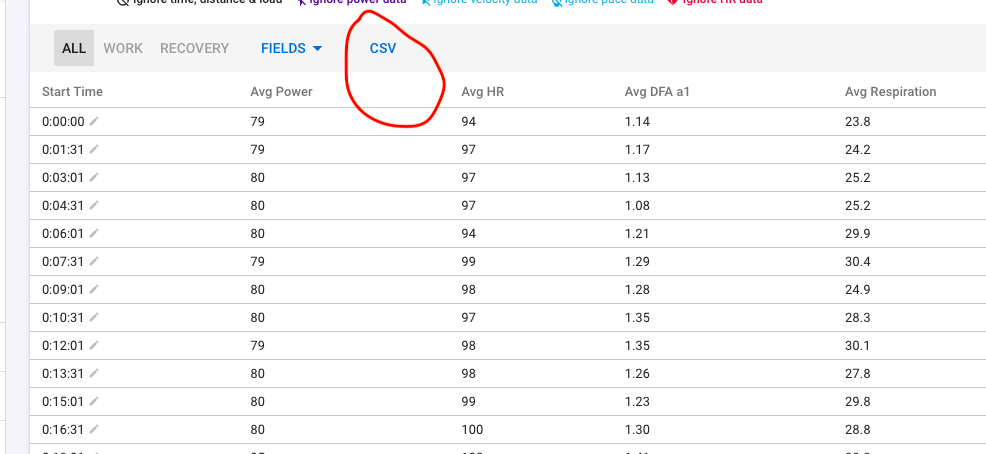
- Make sure you’ve got the fields you need in the headers then Click CSV which saves that
information as a CSV file to your computer.
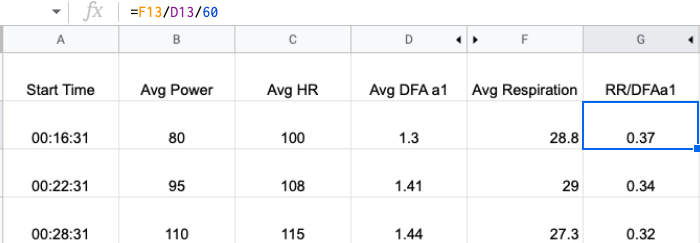
7. Open Google Sheets and Import the saved CSV File
8. Put an extra column in for RR/DFAa1 ie RR/DFAa1/60 to get the proper units
9. Select the table and Insert Chart then mess around with the Edit chart to get what you want. I tend to use Scatter or Line.
10. After I’ve got the complet chart I go into the table and hide the the first 3 rows of each Step in Power (4 x 90s=6m step) and see what it looks like. Sometimes there will be a weird reading so I look into the hidden steps to see if there is a more representative one.
Hope this helps
10 Likes
Excellent! Thank you very much for sharing. I will try and see if I can give this a go this weekend 
Seeing people interested in RRa1 charts, I have created a simple stuff to make it easier plotting these data.
alphaHRV Companion
It runs inside Matlab Mobile, so people already using ImReady4 won’t find difficulties to set up.
You will be able to automatically create charts like this in your mobile or using a desktop browser
Data is also exported to a xls file, just in case you want to perform further postprocessing.
If you have already intalled Matlab Mobile, you can install alphaHRV Companion by means of next link:
https://drive.matlab.com/sharing/1fcec29a-73f3-48ae-8b31-aed0f6918236
Use the option Add to my files
Use the settings_template.m script to set your API_Key for intervals access.
Create a new folder inside the alphaHRV_data folder and rename to Results
drawRRa1.m is the script that will provide these results. When you run it, you will be prompted for an activity ID that can be easily obtained from the address bar when you open an activity in intervals
intervals.icu/activities/XXXXXXXXXX
That’s all, chart will be created and data exported into Results folder.
This tool is provided as it is, no check is done for validity of the activity data, so in case that it is not recorded using alphaHRV, errors will happen.
I will not update it, except for fixing any critical issue.
10 Likes
Is there an idiots guide to using this as I have no idea what to do with it?
It’s way beyond Google Sheets which is the level of my computer skills.
This is a script for Matlab that automatizes RRa1 charts creation.
To use it you need to create an account in Mathworks. This will allow you to use the online version of Matlab (running in any browser) or the mobile one (for android or ios).
Matlab online → https://matlab.mathworks.com/
Matlab Mobile for android → https://play.google.com/store/apps/details?id=com.mathworks.matlabmobile&hl=en&gl=US&pli=1
Matlab Mobile for iOS → MATLAB Mobile en App Store
Although Matlab is a paid computing environment, a free account is enough for running this script
After creating your account and installing the mobile app, use the link to alphaHRV Companion that I have shared in the first post to Add this tool to your matlab environment (use the Add to my files option in the left top corner)
This will create a folder in your Matlab drive named AlphaHRV_Companion that contains:
- drawRRa1.m: the script that will do the work
-
setting_template.m: the template to create your own settings file
Using the mobile app you can navigate folders in your matlab drive using the Archives button. Open settings_template.m and follow instructions to create your settings.
Create a folder inside alphaHRV_data and rename it to Results
Then open drawRRa1.m and use the run button (triangle on top)
I think that if you follow the instructions step by step is easier than it seems when reading this whole post.
2 Likes
Thanks I’ll give it a go when I’m feeling a bit fresher.
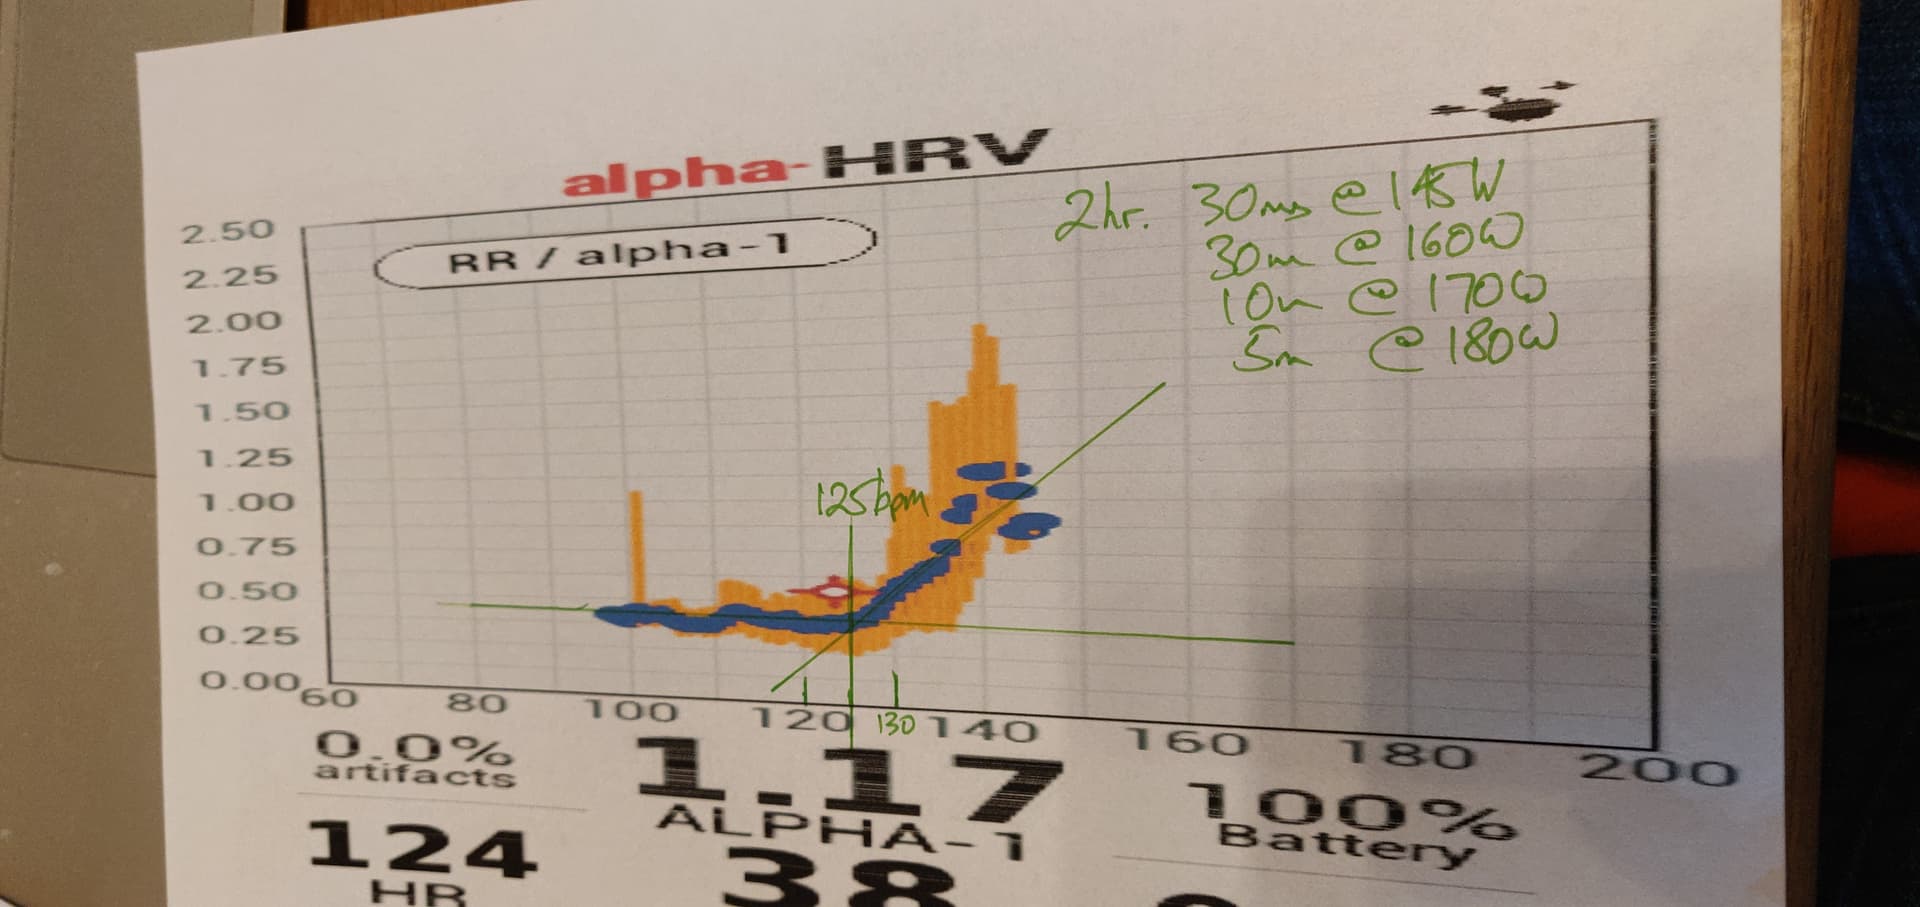
On another matter, the step test I did previously showed the inflection point at 125 BPM which is exactly where I expected it to be. I did a 2 hr ride today 30 mins at the power just above the inflection point then 30 mins 15W above it. This is the screenshot from my Garmin. Inflection point at 125bpm.
2 Likes
I am really impressed by your effort analysing results from alphaHRV. This printed chart looks great.
As you are doing, I have designed the RRa1 chart to be useful not only for tests, but also for structured workouts or even during free activities.
It should allow not only identifying AeT, but also driving your training/activity at the desired zone, and tracking evolution without the necesity of specific tests.
Ambitious, but I think performance of the app is close to it.
3 Likes