i fixed , what is not broken"! (hahaha) ; i Change my settings for SKierg and Row to Power/Pace/HR , so its look like my Fitness was over 100 or really below (Pace/power/hr) - i still dont know what i will decided to do with Ski and Rowing (looksw like have some issues with data , like 500m for 19Sec ! - and Power Curves dont show for Rowing)
You should get power curves for rowing if you capture an FTP and zones for rowing in /settings. You need to add a new sport for rowing if you haven’t already.
I looked at this but I can’t figure out how to built a 1 sport only fitness chart. I can reproduce the standard chart but still for all activities. Can’t filter.
Is there a guide on how to create per sport fitness charts?
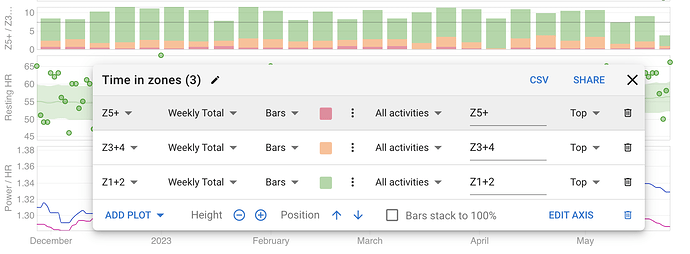
There is very disturbing bug on creating custom chart to tab.
When you create a chart and add a plot that should show you power data values it shows heart rate values instead of power.
In picture between those green lines Z and SS values should show you power values instead of HR values, because there are specific HR Z values for purpose.
I hope you can fix this ASAP.
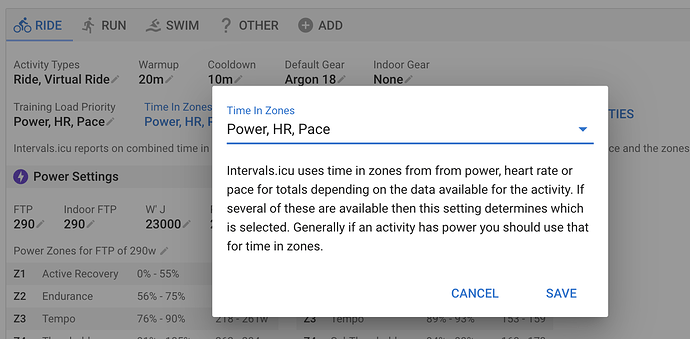
The Z1, Z2 etc use power, HR or pace zones for each activity separately depending on how the sport is configured and what is available on the activity. For myself I don’t have a PM on my MTB so then it uses the HR data. On my road bike it uses power data. I have configured this for “Ride” in /settings:
YES! Thank you David 
Now everything works like they should be.
Its possible make Settings a Rpe-Based ( 1-4 = Z1 , 5-7 = Z2 ;8-10 = Z3) ? or change to 3 Zones Model?
great idea and implementation of multiple tabs.
Just an additional idea: Would it be possible to set different ranges for different tabs?
e.g. personally, I’m interested in various details over the past 1-3 months and other long term metrics for 1 year.
Would be great if I could build myself 2 tabs for different metrics over different ranges.
thanks for the work!
Tx. I added the “chips” along the top for this use case. They are the most recently selected quick links from the date picker including seasons. So you can use those as if they were extra “tabs” but for date ranges.
I like to see the impact of upcoming planned training in the fitness page. Would it be possible to have “+2 weeks”, “+4 weeks” etc to the chips to see this?
There’s an option “Next Month” in the drop down with dates. This adds a month to the view on the fitness page. When you’ve selected it once, it gets added to the chips at the top.
It seems to apply to whatever time period you have selected, so select 6 months, then Next Month, and you get from -6 to +1 months
Oh, that’s helpful - I hadn’t noticed that!
Will be possible to use differnt tabs for different athletes?
Unfortunately that would be very difficult. Right now you need to use multiple browser windows.
I have the same problem
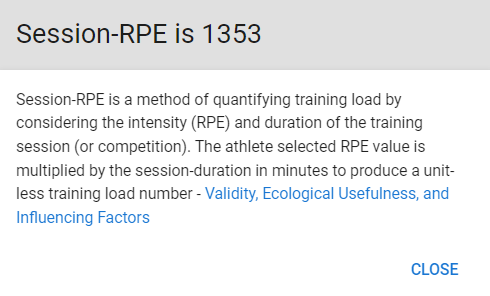
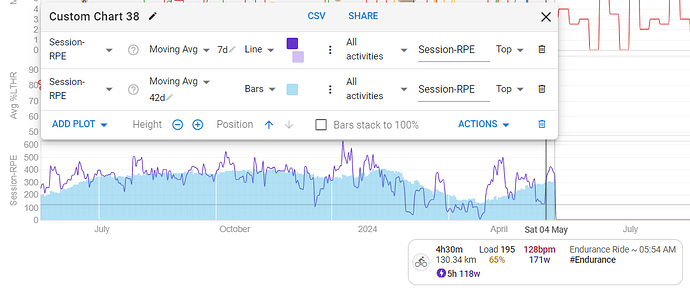
Hey David , ON fitness chart its possible add a metric or create - RPE X TIme ?
i didnt realize session-rpe - is RPE X TIme , im already using , thinking is just session rpe
May I know how to display the season time in the chart?Like “Z2 e SIT”. I have been very curious about this but couldn’t find the answer. Thank you very much!


