Modelling Human Performance

https://www.biorxiv.org/content/10.1101/2022.08.31.506028v1?s=08

According to this article, the power-duration curve follows the power law, instead of hyperbolic, as the CP-
model states.

I’ve always found the CP model quite unrealistic for longer durations. It assumes I can hold 95% of my FTP almost indefinitely, which sadly just isn’t true :slight_smile:

Maybe worth adding the option to plot de power curve according to the power-law ?

That’s very interesting. Tx. I saw the paper come up on Twitter but hadn’t had a chance to look at it yet.

1 Like

Ah. Good ol’ Riegel strikes back. Basically this is what it is … time, t = ax^b , where a is a constant, x = distance, b is the fatigue factor.

Some of my writings on this :

My thoughts :

  1. power law implies constant pacing is the way to race to your best performance. We know that idea, when put to test in events like the marathon, also falls apart. There is no such thing as “constant pace”… in the real world, we vary pace according to perceived exertion.

  2. the authors’ model looks like a work in progress, according to paper.

1 Like

:slight_smile: I should probably wait a bit to see what their updated model is. But it might be worth implementing Riegel for runners soonish …

I do raise a question. If a model is supposed to help understand a real world phenomena, such as the drastic change in physiology at transition points along the intensity spectrum , and if the critical power model in being hyperbolic was able to describe that, how is it still called an artifact ?

1 Like

I’d be interested in reading more research on pacing if you have links to any. Also, I don’t know which pacing is optimal according to the CP model.

The power-law model paper now published, perhaps something that could be implemented in Intervals.icu?:

Modelling human endurance: power laws vs critical power | SpringerLink.

Twitter/X-synopis: Axel Finke on Twitter: “Critical power vs power laws in endurance sports: A brief :thread: 1/10 https://t.co/lqJ8WfgdRe” / X

2 Likes

Any news about a possible implementation of a new feature capturing the power laws?

Out of curiosity, how will you use the power law/fitting parameters for training and race planning?

Of the models I have, the power law fit is pretty bad. But it could be useful to compare fitting parameters over time, especially the “fatigue” factor.

Hi do you have any news for the implementation of the power-law fit for cycling?
These days people is forced to use excels outside any platform, and will be a real difference maker for intervals.icu.

2 Likes

I created this, I don’t know if it will be useful to you, let me know if you need any modifications.

image

3 Likes

Thanks Luisma! It’s a custom chart? I can’t find it in the custom chart list. May I’m doing somthing wrong?


It’s an activity-level chart:
Open the activity, go to power tab
Scroll to bottom
Activity Charts
Type in Power-Law

2 Likes

Just updating an older thread…

I’m sharing a spreadsheet that has several models included to fit your mean maximal power curve and develop modeled power duration curves. Several of the models are typical models that you’ll find everywhere, such as the two and three parameter models. I also have some of the more modern models like the Omni-Domain Model, Extended Critical Power Model (found in Golden Cheetah) and a modified Perronet and Thibaut model (presumably similar to the WKO model). A power law model is also included. Hopefully these model implementations can help you estimate a value for critical power to use for training.

This spreadsheet has not been quality checked by anybody and you should presume that there could be errors somewhere in the spreadsheet. This spreadsheet has been set up for Microsoft Excel, however you probably can get it to work in LibreOffice pretty easily.

To use the spreadsheet, you’ll need to paste your mean maximal power curve into the summary sheet and then go sheet-by-sheet and use the built-in solver to come to a solution for the model fitting parameters. The sheet is set up to take the data from Intervals.icu CSV for your mean maximal curve of interest and paste directly into the sheet. Or you can use a mean max curve with up to 4,208 rows of data.

You can automate this task, but I find that going model by model and fit by fit gives you a better idea of whether your model fits are reasonable or not.

The sheet
https://1drv.ms/x/c/7aaa504c5ba71805/EXFZw3fJ5UxNrWba-L6BMiMB2qpnlin3e7cPMo2jqJFtjg?e=9jdJ9Z

Sheets:

  • Model Summary

  • 2 parameter, 3 parameter – hyperbolic

  • 2 parameter – linear work

  • Ward-Smith

  • Omni-Domain, Omni-3 parameter, Omni-Exponential

  • Extended CP

  • Modified Perronet & Thibault

  • Power Law

Summary sheet

OMPD sheet

More sheets and models coming…

3 Likes

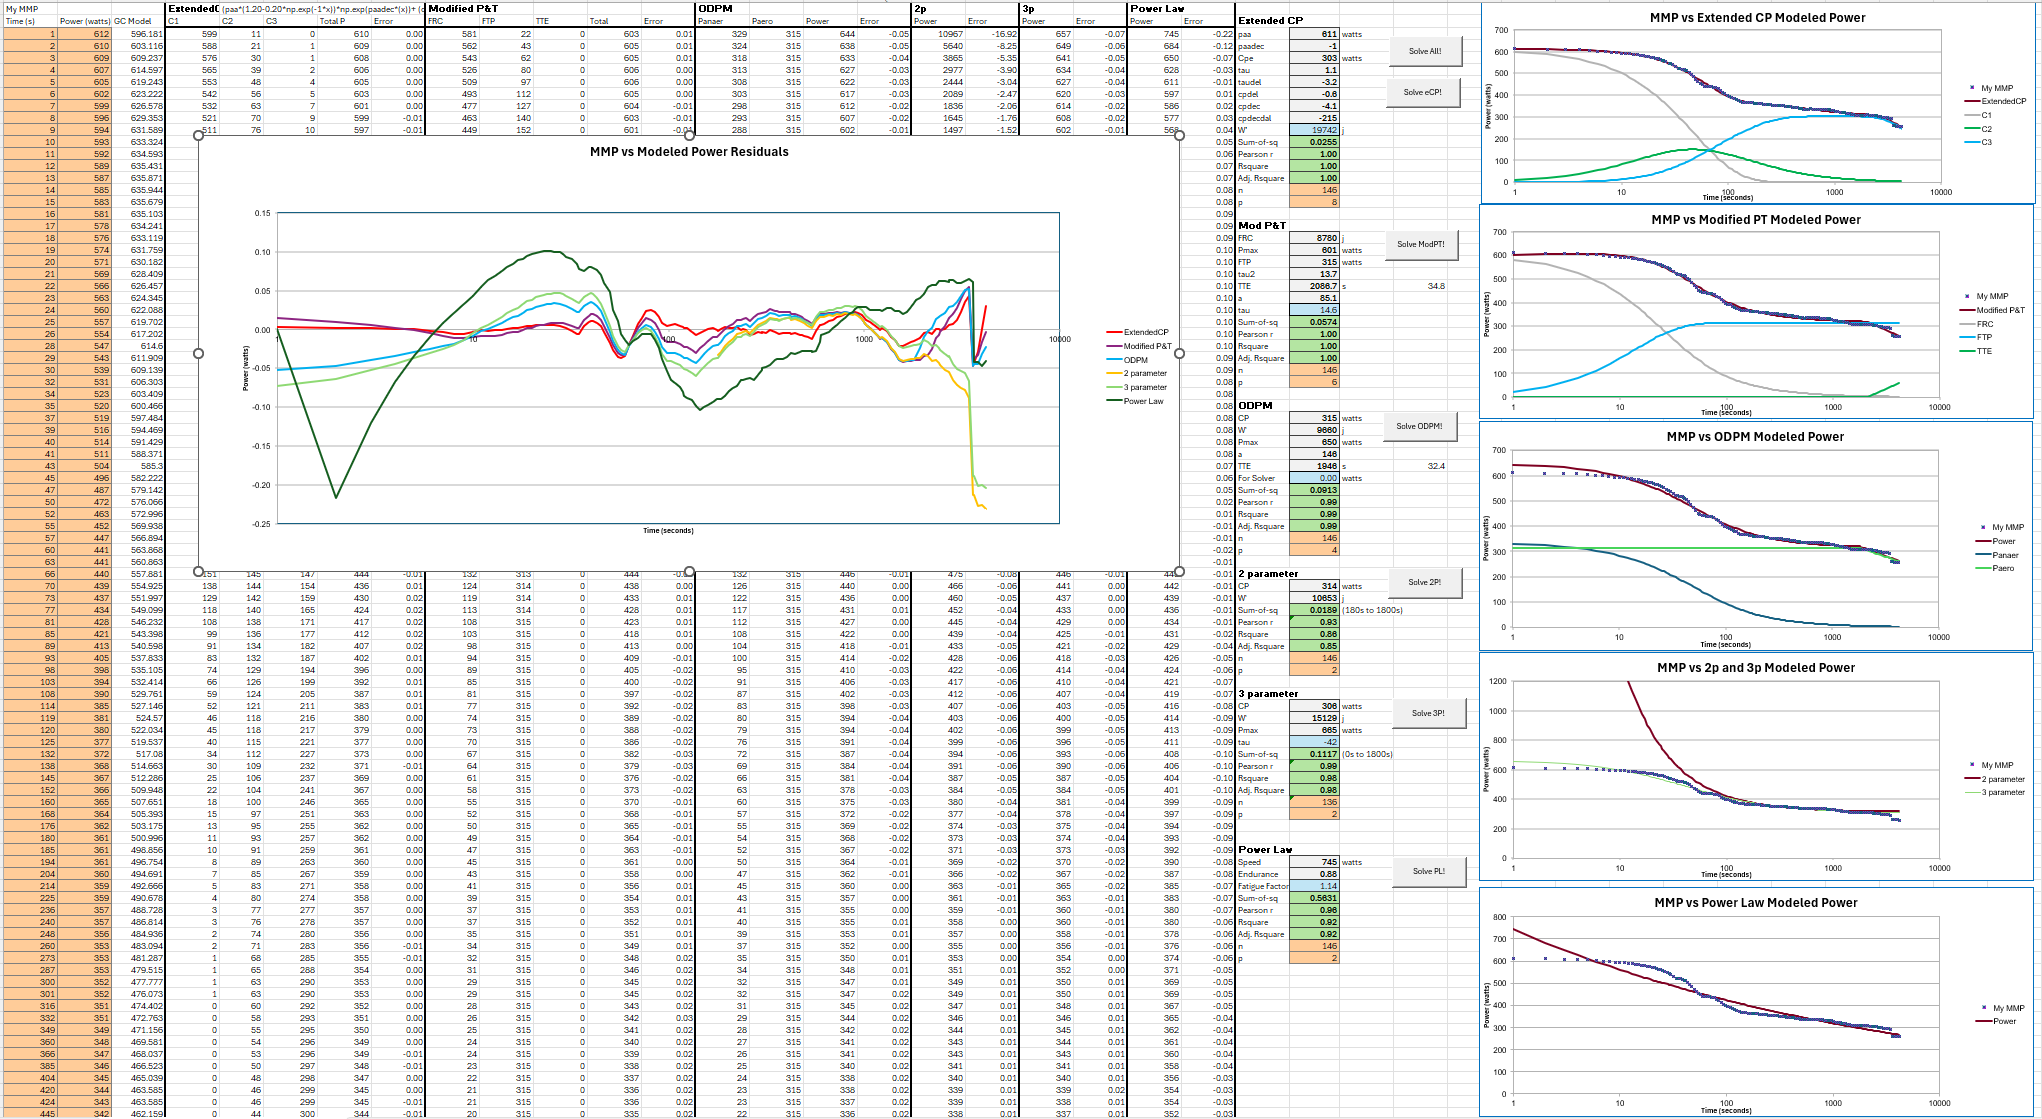
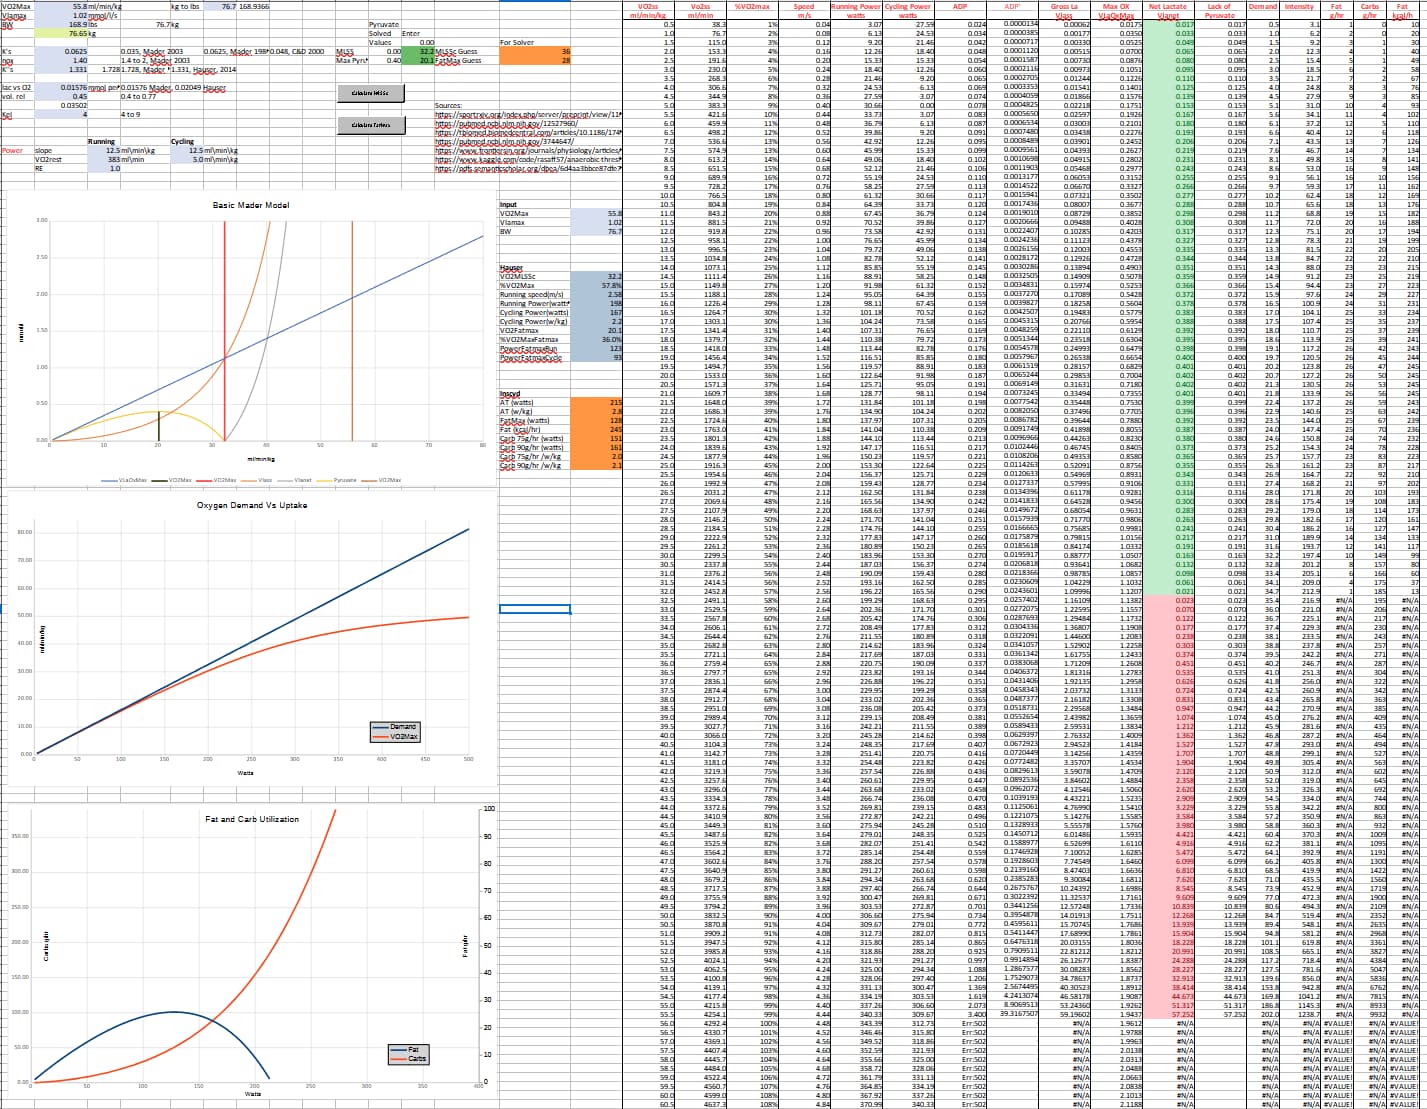
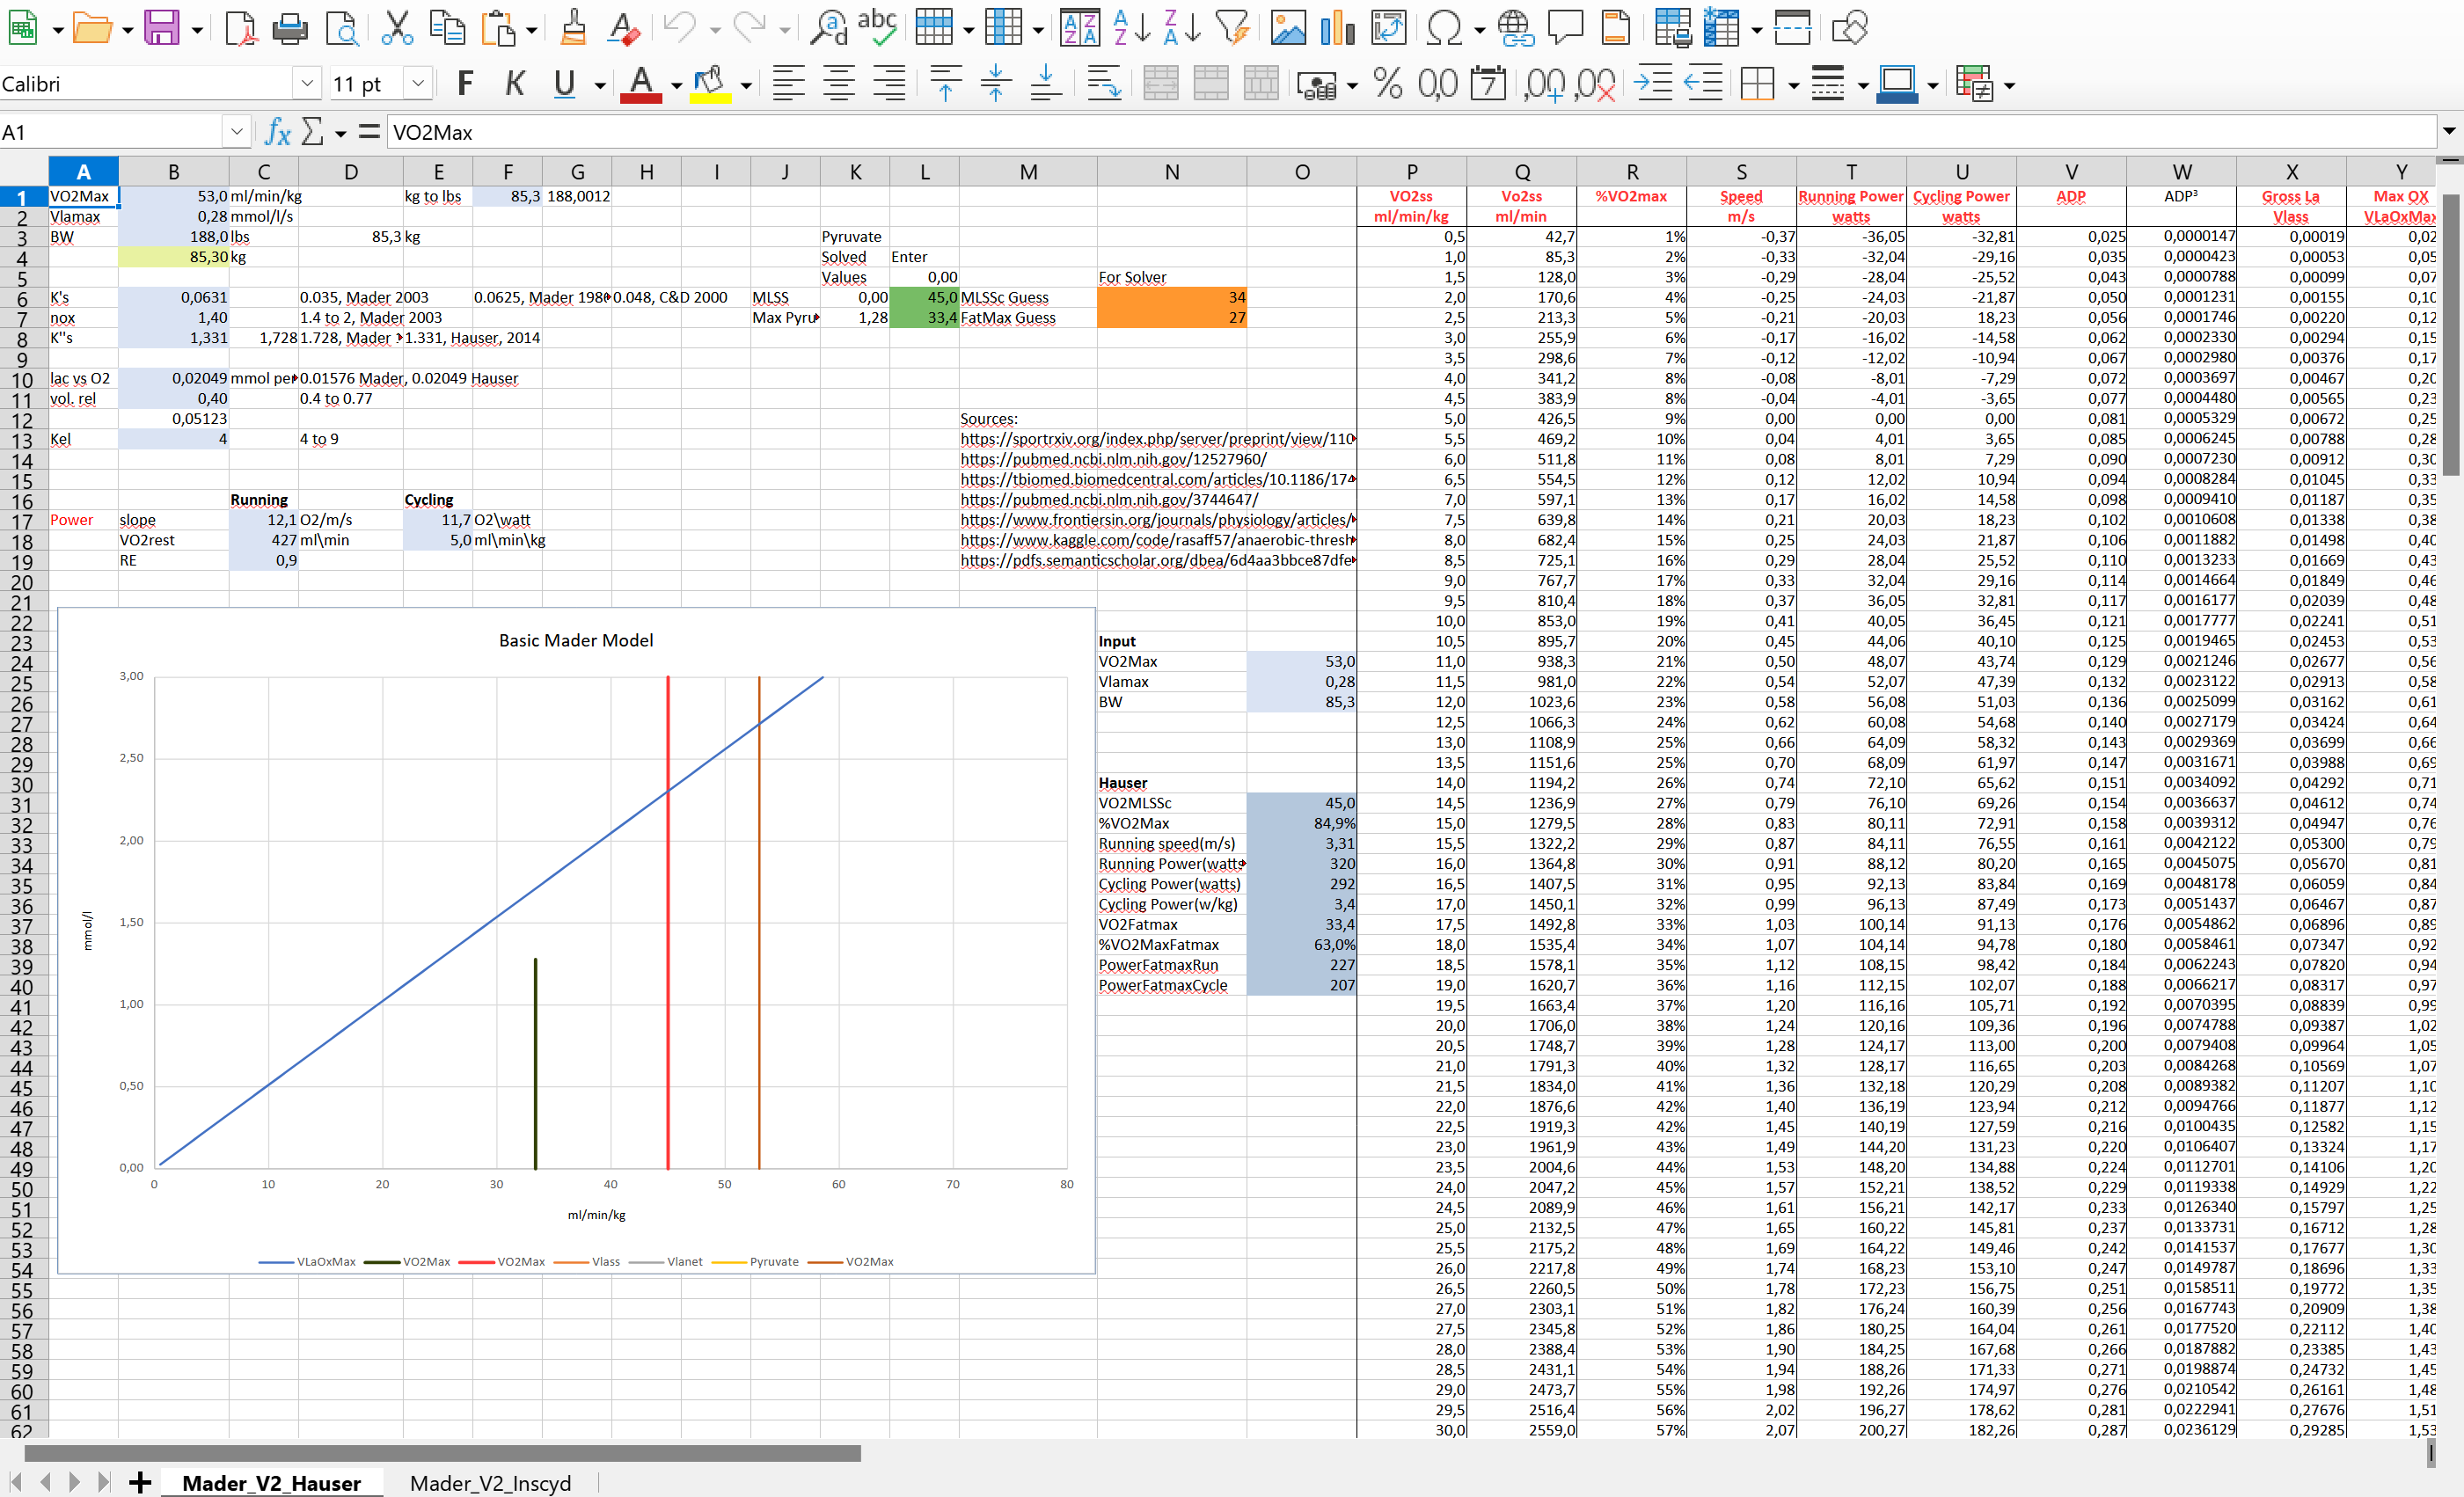
Here’s another spreadsheet. Mader’s basic model

Its a very crude implementation the model from the 1986 paper. The sheet may have errors and I don’t have a bio/physio background, so consider this a simple numerical calculator, of sorts.

The main references are in the sheet. Hauser, 2014 and Mader, 1986.

I coded the sheet in LibreOffice Calc – it’s free and useful. There are some modifications you can make to have this in Excel (charting, VBA coding).

Input parameters

Not sure where vol. rel. comes from - if you look at Incsyd reports, Vol. rel. seems to be based on a calc using body characteristics (height, weight, body fat, etc.)

Seems K”s is adjusted based on VLaMax magnitude, high = 1.728, low = 1.331

Where to get VO2Max? – Watch estimate, ASCM formula, 5m Cycling power correlations, Software (WKO5, GC), other correlations (ramp test, Cooper test, etc.)

Where to get CP? – intervals, WKO5, GC, maybe TR (what model?). Use FTP also. Need good proxy for mlss.

How to estimate VLaMax? – Back-calculate. Use spreadsheet to iterate by varying VLaMax to find CP/FTP (mlss)

Fat and CHO correlations – I have no idea where they come from.

The sheet:
https://1drv.ms/x/c/7aaa504c5ba71805/EdeXFlTCYwZDgWGawN4E4coBsSXuAH8wK8GkM3wD5Nfaww?e=zvjNnL

A very quick video showing the basic operation:
https://1drv.ms/v/c/7aaa504c5ba71805/EQUYp1tMUKoggHq-zAAAAAABT6nWA3RvgGeVcVRNhmk6vg?e=srbfnA

A better explanation of the model can be found at the link I always share:

3 Likes

Thanks for sharing.

But it seems I can’t get it work. I have not these calculation buttons and I miss some graphs.
Any idea?

1 Like

yep, this doen’t work. Just like the CP one

Let me find a better way to share the sheets. I believe OneDrive is the problem.

1 Like