Matches and CdA

I don’t know if it is possible right now or not but can we see matches in Intervals just as WKO does or even Goldencheetah?

I also know you can see CdA in WKO. I don’t know how it is called in English but in Spanish it is the name given to the estimation of how aerodynamic you are at a given moment during the session. Do we have this feature here?

Thanks in advance

1 Like

I’ve made custom interval scripts for cdA. You find it under fields and search for cdA.

Don’t know what you mean with matches.

here you can find an explanation of what a match is and why it is useful for training What Is A Match? | TrainingPeaks

Thanks about the CdA :wink:

Didn’t hear this term ever. But I don’t race :smiley:
If you search under custom, there seems to be an custom script for it

Golden Cheetah users are familiar with it and Joe Friel also used it in his training bibles.

The french term is, usually, “cartouche” (as in cartridge for firearms)

The visual matches in WKO are easier to see compared to the script. Matches can be different intensities and duration.

It was requested back in 2020, and has been discussed a few times on a few chats.

From the last link (above) here’s a file from WKO and a similar one in Intervals. I had forgotten about this until I saw my post.


1 Like

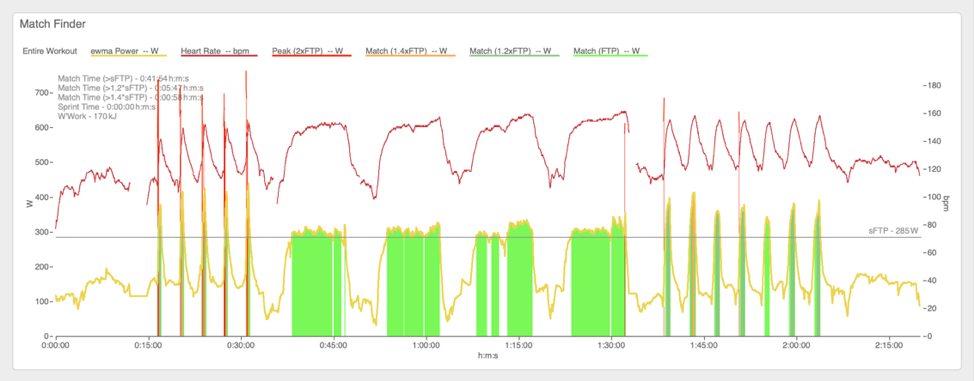
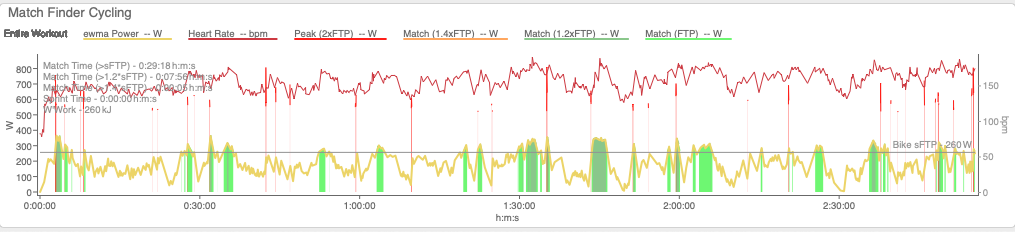
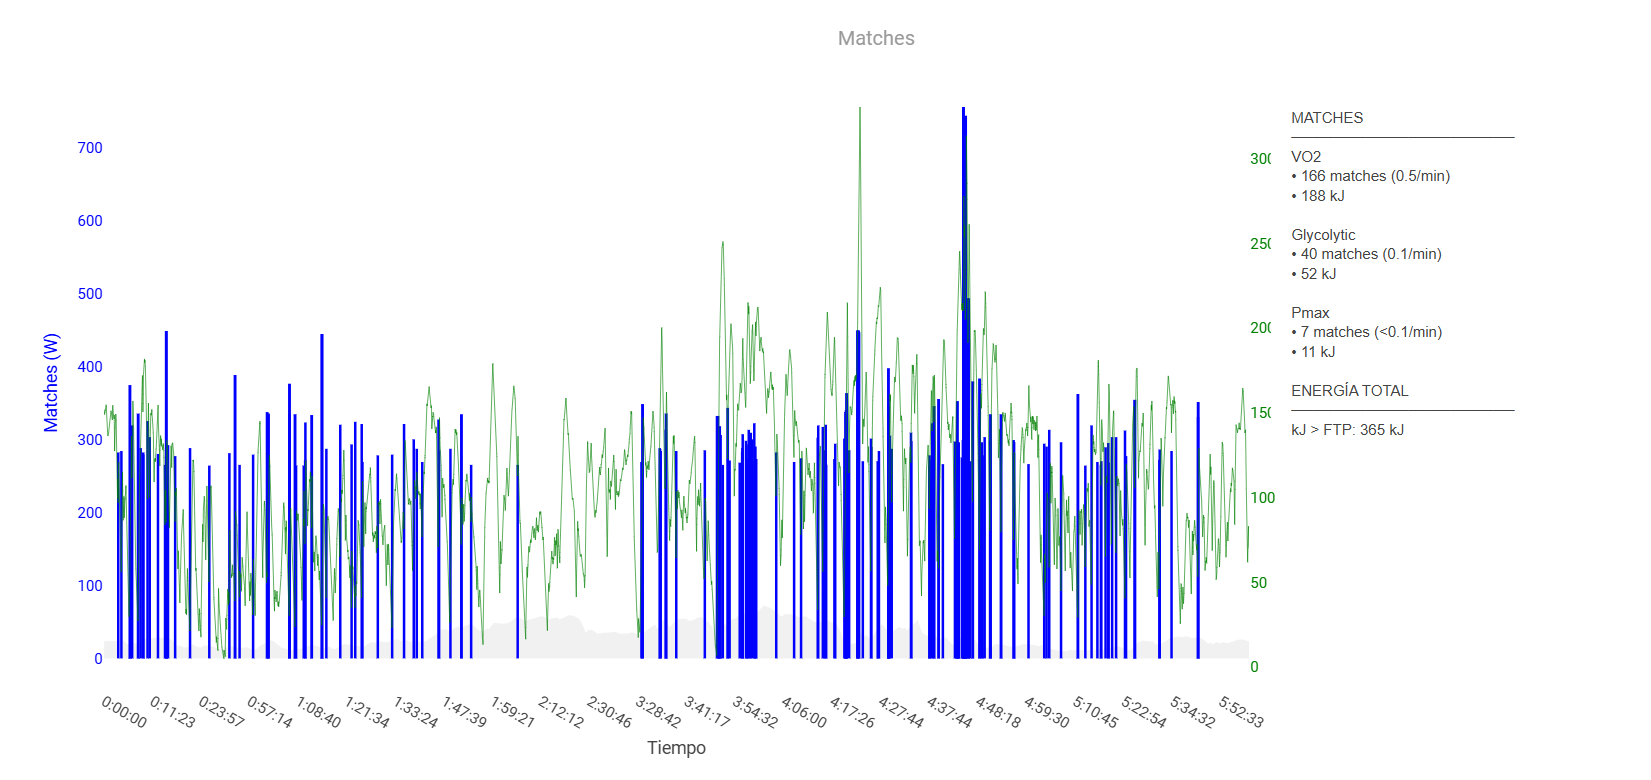
For matches I have this that we use, chart will likely be in a paper once I have finished analysing all the data. " Performance demands of UK criterium racing in relation to W’ and W’bal’

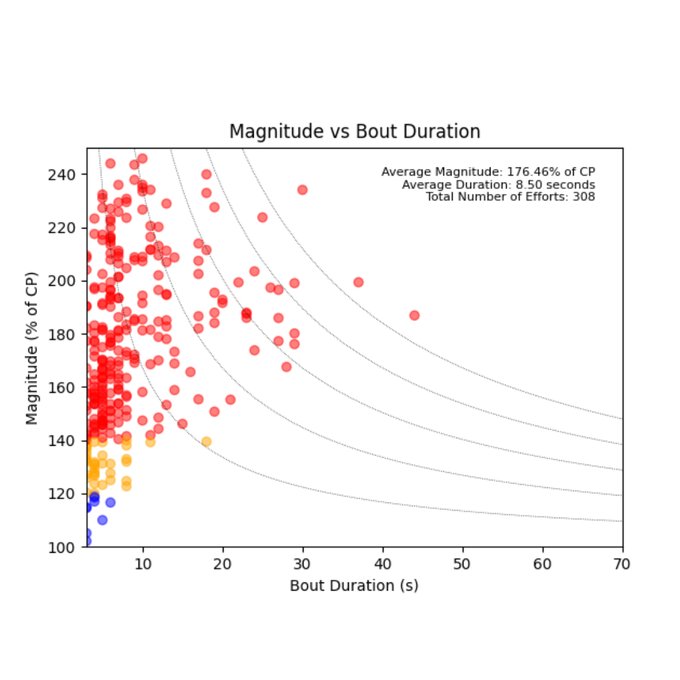
I have yet to find a good match counter so we came up with this. It’s in relation to your own W’ so bottom line equates to 10% depletion and the top being 50%. Now looking to make it 3D by adding time in, so you can see where it happened as well.

1 Like

I would be keen to see how your 3D chart references to the timeline of when matches were spent across the activity?

Knowing how long each effort was as well as the recovery time in between, is important.

Something like this?

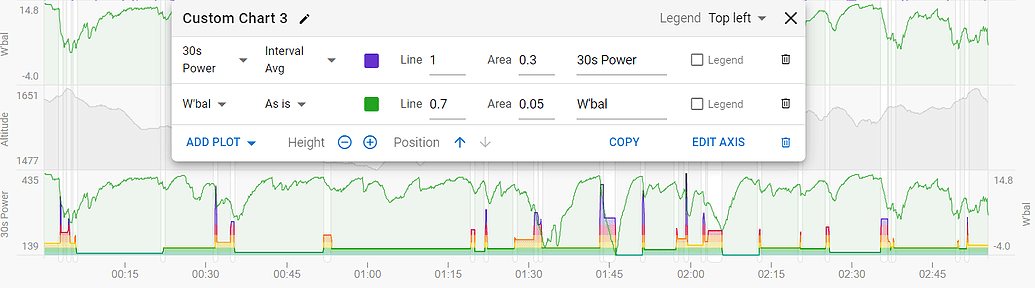
That makes two of us, i’m still working out the coding on that. I will likely need to remove the W’ depletion reference lines as this results in some interesting graphs!

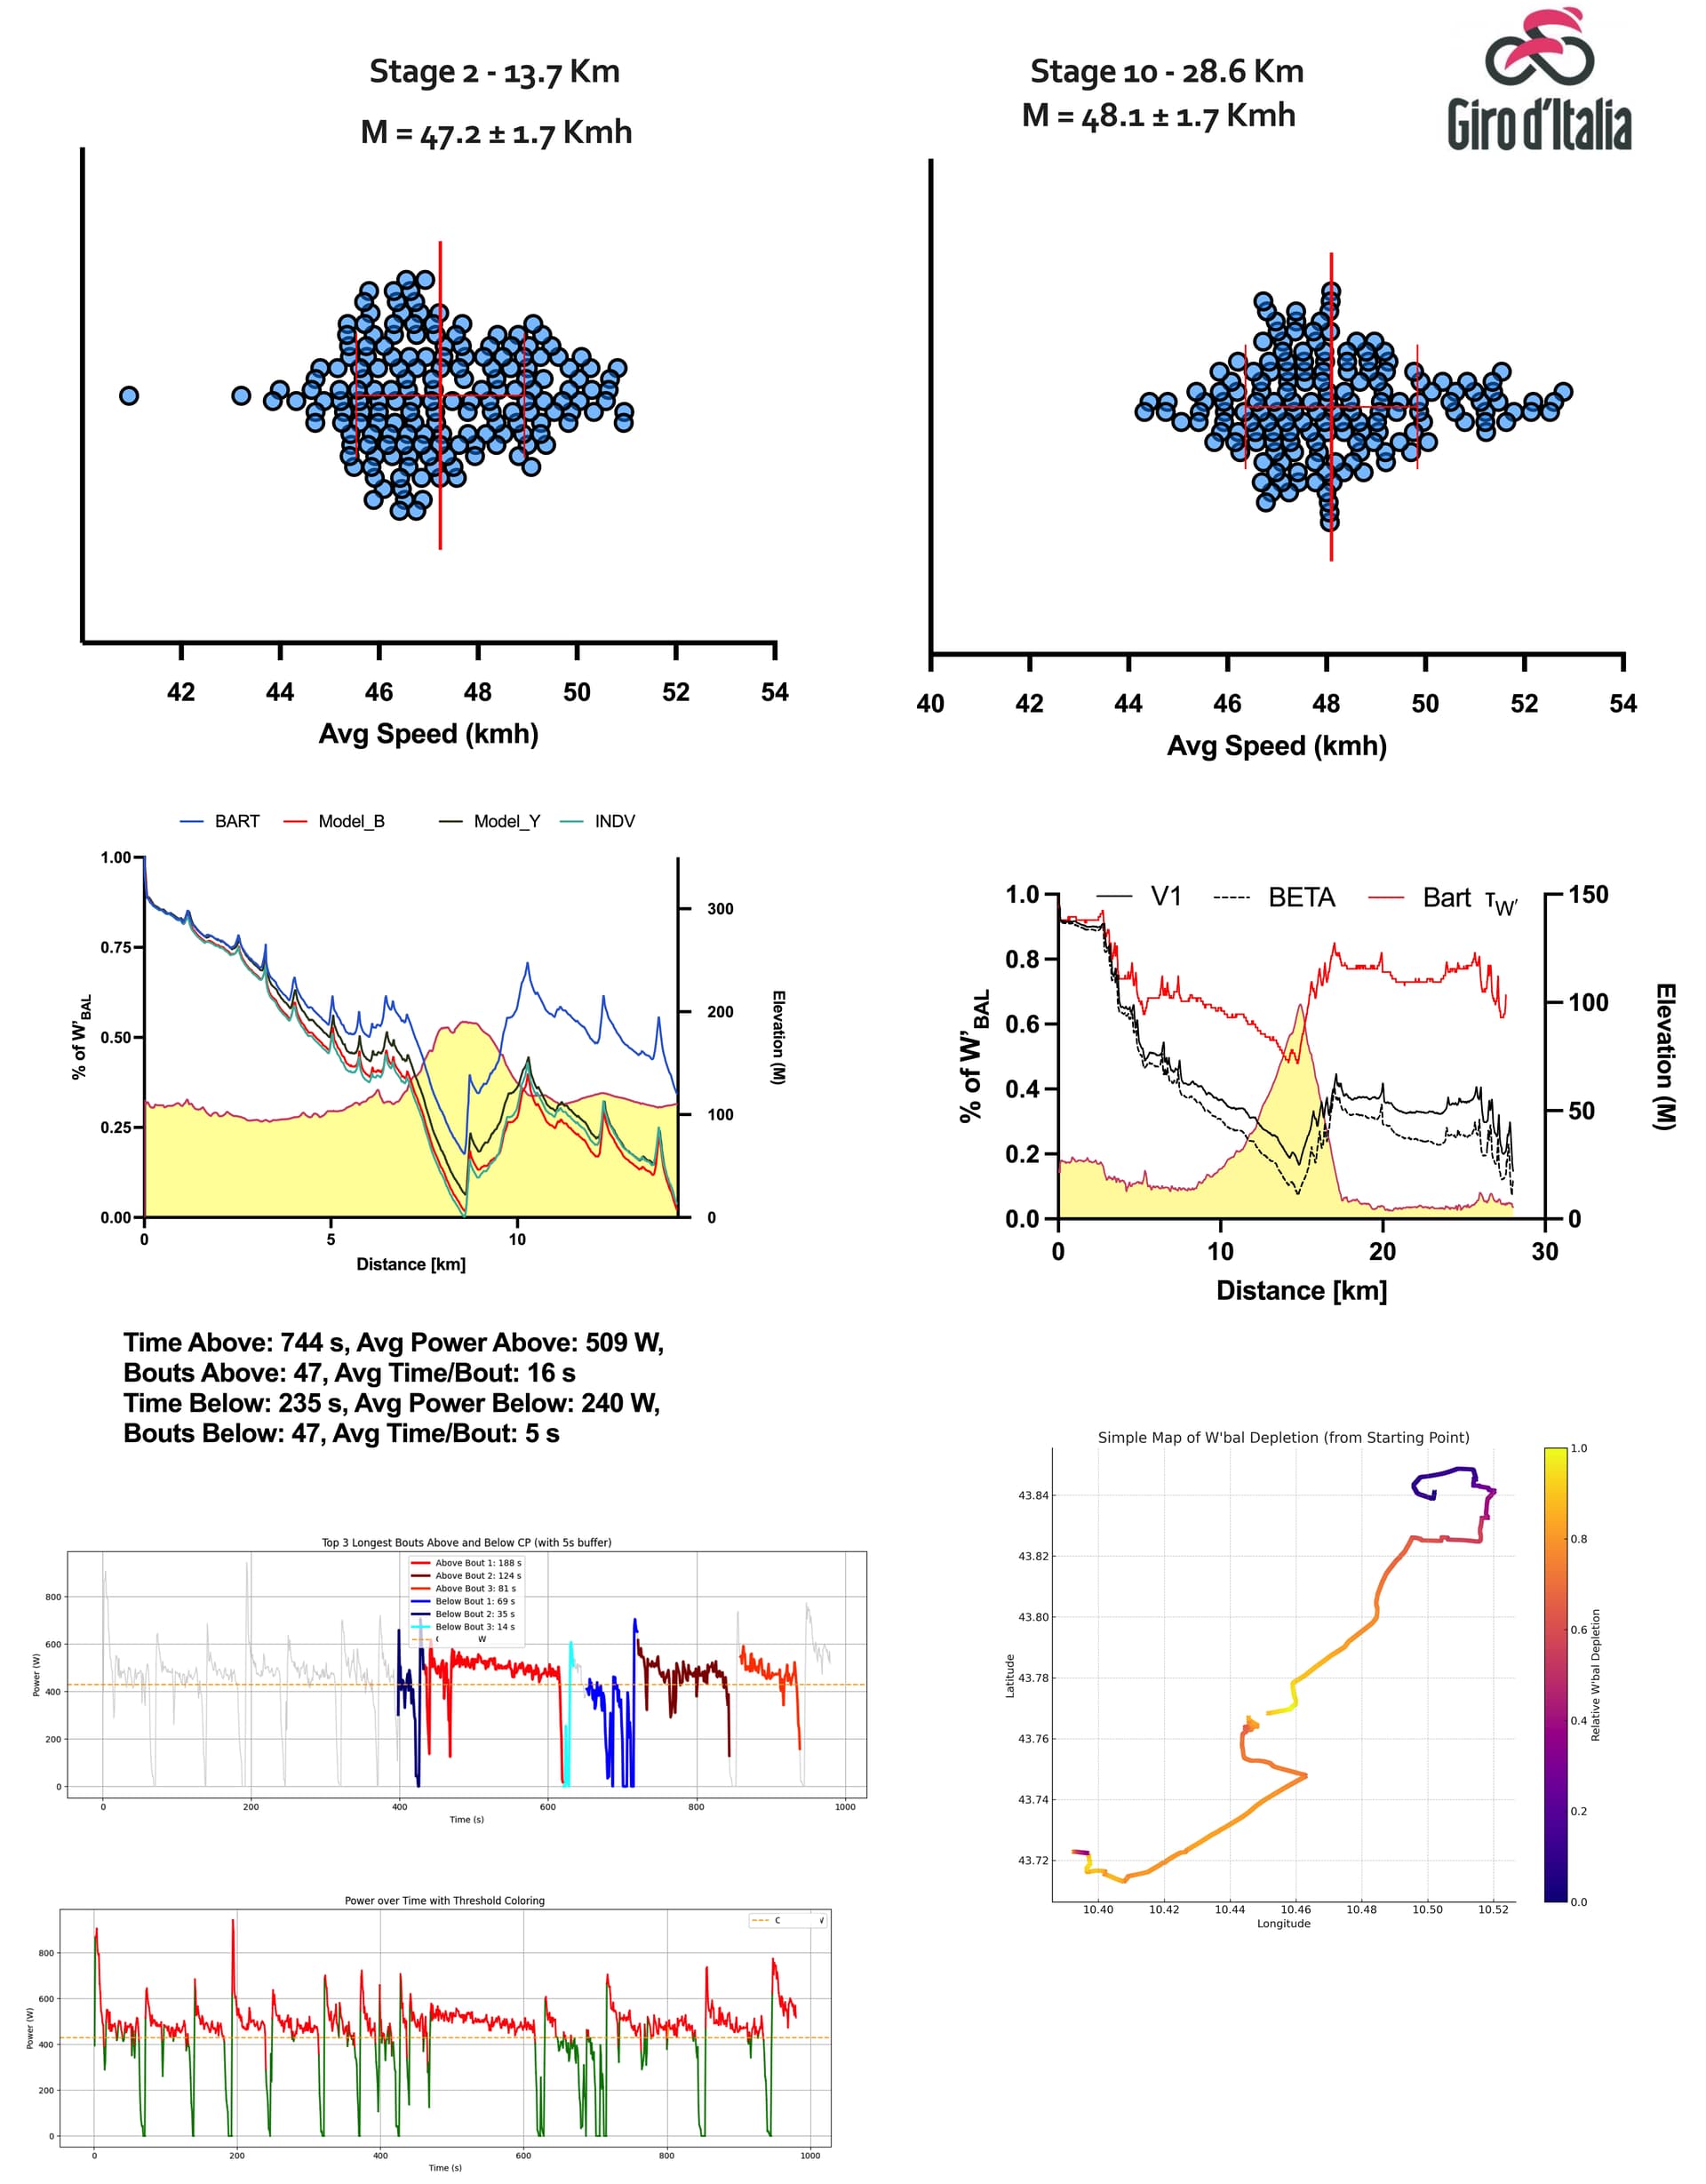
I have a W’bal recovery series of charts as well, for specifically this, with multiple variables to look for what you want, here is some of the GIRO data with it, we tuned to to look for the top 5 depletion and recovery bouts along with where they happened.

1 Like

Interesting, indeed!

On the average speed chart, is there anything on the y-axis? Or is it just a visual way to view the average speed?

What software are you using?

Sorry that was not clear, it was every rider in that stage. I was looking at variation in TT performance and GC changes.

Code is python, and graphs are produced in Python and some on Graphpad.

1 Like