I actually like the 2 x 8m FTP test. It seems to produce what seems like the right FTP number for me unlike the 20m test which I struggle to pace or the ramp test which doesn’t seem to suit my physiology and under-reports my FTP (despite it being an all-out eyeballs bleeding, max HR effort).
All this means that one’s results may vary and with estimations getting as good as they are, you may as well take those if they ‘feel’ right.
But, still. 4 x 8m max efforts doesnt seem like it would be a regular feature on my training plan.
1 Like
Where do you and @Judah_Rand see your LT1 HR falling with DFA alp1 method? And where does it fall on the 3-zone and 7-zone map I drew up.
I tested mine this morning but I’ll reserve my thoughts to Twitter in a bit; thought I’d hear your take on it first.
I had a lab test a few years ago and have been using HRV Logger recently. The DFA a1 measurement is a tricky one, but when it seems to go right it matches my tested LT1 of 142 - 144 BPM on a 190BPM Max HR. This fits the standard models surprisingly well.
That’s promising. Could you explain “tricky”? Is it an equipment issue, or issues with post-processing?
Well, I didn’t have so much of a good luck on the initial try.
The 3 and 7-zone were far out of DFA a1 indicated power and HR. Reptitions of trial to be done in the following days.
I laid out a Twitter thread on my trial this morning.
https://twitter.com/RonGeorge_Dubai/status/1365939113111789571
I found that on yesterday’s long easy Z2 rides the DFA a1 seemed to jump around a bit, making it difficult to get a good number from it. However, I did an easy interval workout targeting my LT1 HR (5 x 8 min) last week and once I was warmed up, it ended up matching pretty well on each interval. That’s just two recent examples.
As I said, hit & miss and I only know that because I know what my LT1 HR is from a previous lab test. Lots of apparent equipment-related challenges too! Anyway, it’s a promising idea, hopefully it develops further.
Long easy rides done indoors? (or out?)
Not sure why the hit and miss, but I have more testing to do. From reading Rogers et.al’s paper, HRV signal is suggested to be strongly correlated when you’re riding well below VT1. It transitions to uncorrelated and less complex at the value of HRVT = 1.0 - 0.5 as intensity increases, in a rapidly linear drop fashion.
Maybe it is during the intervals that this signal makes a pronounced crossing into uncorrelated territory and you see the nadir? Have you tried reaching out to Rogers or Gronwald?
It was a very steady (VI=1.03, D=2.63%, 3h15m) easy indoor ride on Zwift. I was well-hydrated, rested and cooled.
I think you might be onto something - the transitions on the short workout make it more obvious where a1 was?
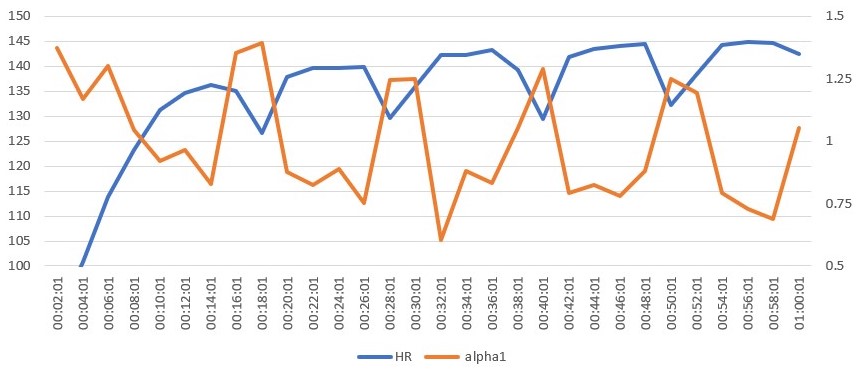
Here’s the HR, a1 chart for that ride. I haven’t done the same for the long ride yet.
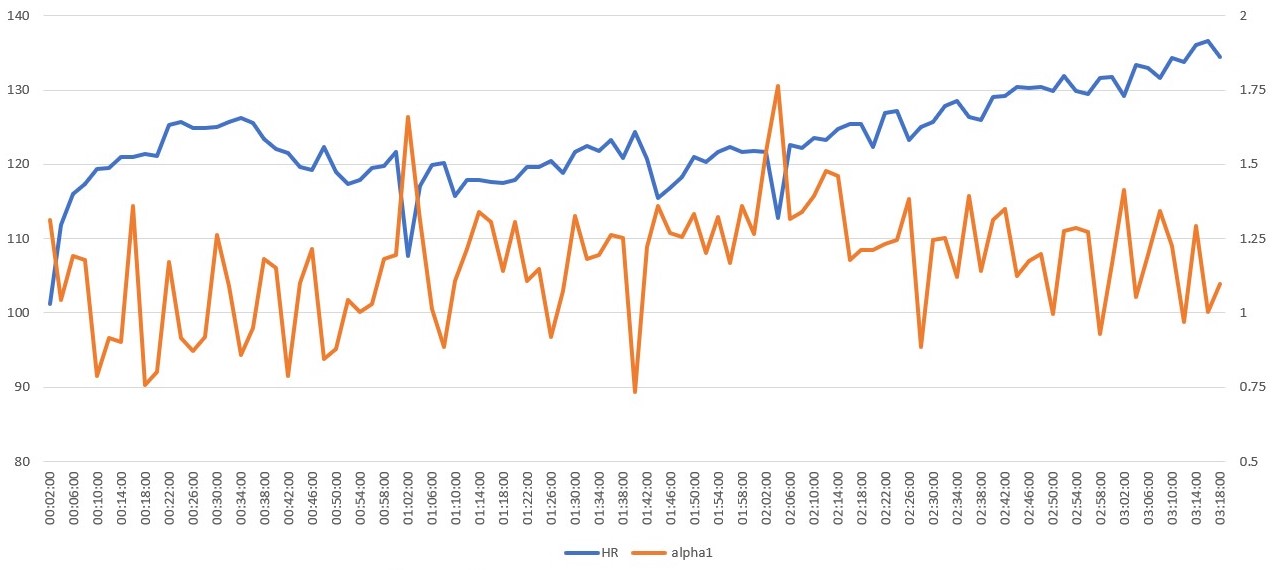
For contrast, here’s the chart for the 3:15 ride I mentioned above. You can tell it is still below my LT1 given where the DFA a1 is, but that’s about it - even when the inevitable drift sets in and my HR starts to approach (but not pass) my LT1, it’s not obvious. In fact the opposite might be true? DFA a1 seems higher in that last hour than the first?
1 Like
If you ask me, like anything in the HRV world, I would tell this is “open to interpretation”. I can’t understand the bit about heart rate drift but a1 = 0.75 being unchanged. Does that mean you do not cross intensity boundaries in hot weather? Muscle glycogen usage does shift around with heat, so not sure.
Early days, but as it gets adopted, we might see better tools made for it. I can’t see myself riding outside with a 3-lead ecg poking my eyes into an HRV logger.
Frankly, on the “easy” LOW days of Polarized training, you shouldnt have to monitor anything particularly even power. The simple “go by feel” RPE would trump all of this.
1 Like
Yup, I was confused by his statement around HR drift and it not impacting DFA a1. Well, i’ll just keep watching its development.
Luckily, this is all just intellectual curiosity for me. As you say, those long slow rides should be done on feel. They should be easy. Your HR should remain steady and ‘low’. That’s how I ride them.
@Clifford_Smith Bit puzzling but more data is necessary to see if this remains the case on long rides.
When heart rate drift happens, R-R time span should decrease. That’s no different than working at a higher intensity, as heart rate would increase in that scenario too. In your graph, I can see a1 increasing and decreasing where Rogers indicated a straight line with the green ink. As to why there’s no net downward trend on DFA a1, I do not know.
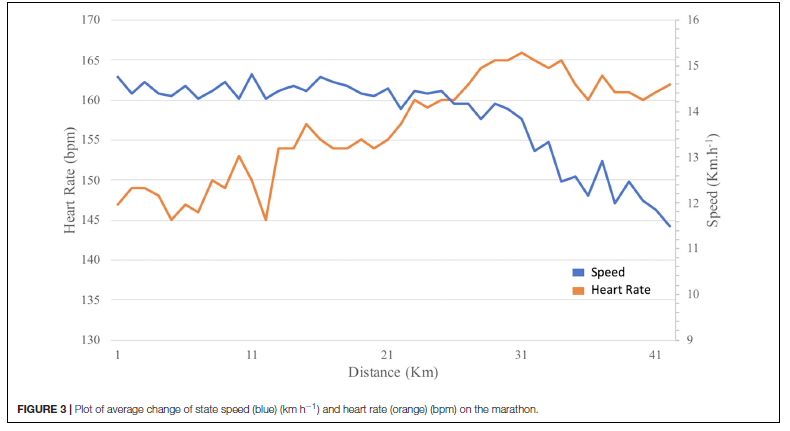
Here’s a plot of real heart rate drift and marathon run speed in a certain study on marathon pacing. The speed was very steady, until runner hit the wall. The sharp loss in speed corresponded to the drift and change in “fractal scaling of the heart rate”. If we hooked up this HRV logger to this chap, I wonder what we’d find. If DFA a1 stayed steady despite the drift, the utility of the tool would mostly be lost.
Who knows! It doesn’t make sense. This science stuff is beyond me … I’m just going to ride my bike! 
Hi Ron,
Interesting reading.
I am also interested in the spreadsheets.
Are you willing to share them with me?
Thanks upfront!
Gr Johan B
I’d love to see something like this:
Z0, <50% FTP
Z1, 50-75%
Z2, 76% to 100%
Z3, 100%+
or wherever you think VT1/VT2 land
hi,
I’ve read a very interesting article about LT1, the base for an appropriate polarized training approach.
80% of HRmax will be higher than HR at LT1 in untrained subjects, but will be lower in the advanced. In addition, HR at LT1 corresponded tot 77 and 86% of HRmax in the least and the best trained, respectively. In an often-cited study, Achten et al (2002) found that fat oxidation was maximal (FATmax) between 68 and 79% of HRmax in 18 moderately trained male cyclists. This publication alone suggests that staying below 80% of HRmax will do for BE training.
The present data also show that both lactate thresholds come closer to each other with increasing training status: LT1 and LT2 were only 29 Watt (9%) or 10 bpm separated from each other in the fittest subjects. Hence, the difference between producing no lactate at all and a lot of lactate is very small in well-trained men, and this is an additional reason to be careful with training at intensities close to LT1, apart from the fact that systematic training at such relatively high workloads (LT1 = 252 Watt when maximal power = 314 Watt) costs a lot of energy.
De https://www.backtobasicsinsports.com/en/blogitem/111
2 Likes
In the 3-zone default map, S1 is at 75% HRmax.
Atleast for me, it looks very close to where I’d be with RPE ~ 3.5. If you asked me, I like where the %HRmax stands for VT1 limit in the 3-zone model and think there’s a decent margin there, unlike with the 7-zone model, Zone 2 upper limit is a few beats higher than where I’d prefer it personally and maybe eats into that margin a bit. Perhaps the default 7 zone upper cutoff for Zone 2 upper correlates more closely to a lab derived LTP1. What do you think?
Yes, with training a right-shift of LT1/LT2 happens. That’s been known for sometime now. I’m not sure it delta would be 10bpm for me; in my fittest state I think it was on the order of 15-17 beats. Issue is that because the lactate tests are specific to the mode of exercise, your biking and running LT deltas might be different. Thats the annoying part about lactate tests - having to test in different modes if you do more than 1 sport.
1 Like
This should be a great piece for a foundational basis of this post. From Mark Burnley.
Bottomline is - zones should map to physiological domains.
Thresholds and intensity domains
2 Likes
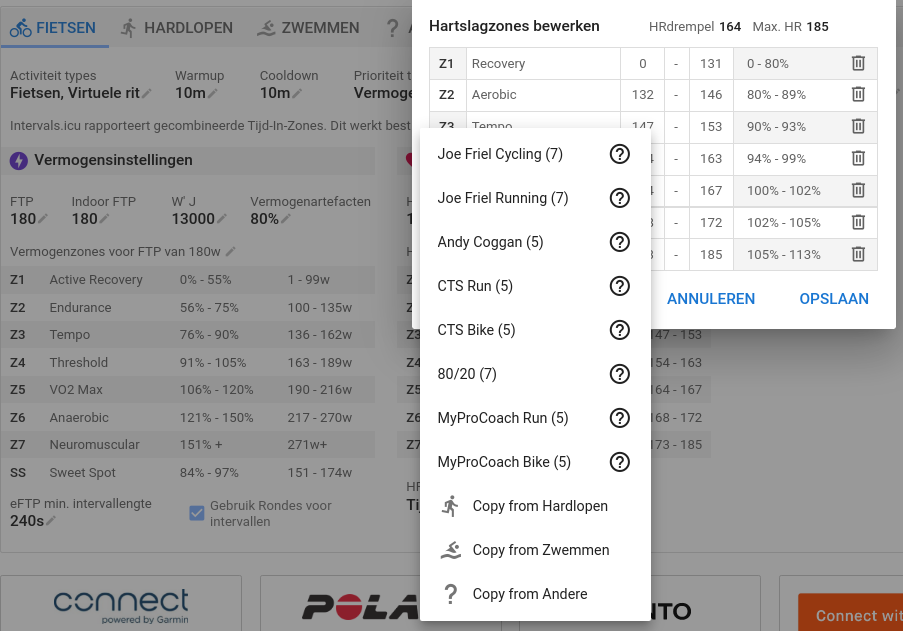
I wonder where the iicu’s definition of the upper HR limit of zone 2 (89% of LTHR) comes from?
I find this is too high. I have a HRpeak of 178bpm and my LT1 (so the upper Z2 limit of a 7-zone model) is 128bpm. I got this from a blood lactate test in a lab and the DFA alpha1 estimation of LT1 coincided surprisingly well. If I ride up to 143bpm, I would be well above LT1.
What do you think about the 89% of LTHR for the upper Z2 limit?
HR zones exist since quite a while and there are different opinions. Intervals has presets from well known sources. You can check the sources from your HR settings.
1 Like