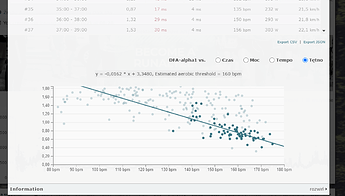
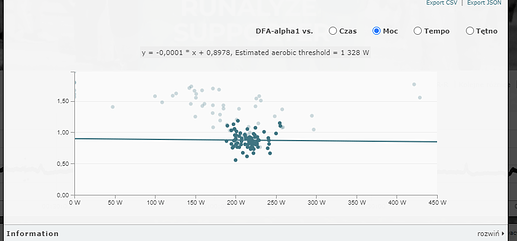
There is a bit of a discussion of this over on this thread (lower down):
Mapping 7 Zone to 3 Zone Model Wrt Polarized Training - Training - Intervals.icu Forum
In talking to Bruce and Marco this turns out to be very equipment dependent too. Your HR device must capture RR intervals (not all can) and some are terrible at it (e.g. Wahoo Tickr). Also, apparently ANT+ vs. Bluetooth has an impact on the noise introduced in the model … Anyway, it did produce some interesting results, but it’s early days for this!
It does sound interesting. I have seen HRV data in some .fit files.
If I understand correctly then if the DFA a1 is above 0.75 am I below LT1? Is there any method to detect if we are above LT2?
Is it possible to write an IQ application for garmin that would display DFA a1 in real time? Does it take up a lot of CPU resources?
I think that the graph with DFA a1 from the two-minute floating window would be a very interesting option for intervals.icu
Yes, DFA a1 above .75 means you are going easier than your LT1. When it drops below .75 it means you are going harder than your LT1. There is no way to use the model for determining your LT2.
For more than you’d ever want to know on the topic check out the blog of the guy who figured this out:
Muscle Oxygen Training: Muscle Oxygen Training blog index
Also, Marco Altini’s app has an Apple Watch app that shows your DFA a1 on your wrist. Nothing for Garmin as far as I know (yet).
XERT are using a number, Lower Threshold Power (LTP), which are dynamic and wattbased. Under that you are in some kind of Zone1+2 and partly zone 3.
Useful in polarized approach.
Yup, I used Xert for a year or so. Also an interesting platform. However, I didn’t spend the time to become familiar with their terminology and found it somewhat confusing - especially how it sometimes interpreted my data. I think they have some cool stuff though.
This great app by @John_Peters_endura.f:
Also does the DFA a1 calculations based on a FIT file that includes the RR interval data required to calculate DFA a1. Worth a look if you are interested in the topic.
Thanks. Credit for the DFA a1 work has to go to Marco Altini who shared the algorithm.
Also Marco has looked at adding the real time (during activity) calculation to Garmin but it takes quite a bit of processing so not sure if the Garmin software language (Monkey C) can handle it. That’s what the Apple version still needs your phone to do the calcs, the watch t hen shows the live results.
Great steer - so much easier to use / extract the DFA-alpha1 data using EnDuRA than using Kubios!
Yup, good to see it’s showing up in a number of places! It’s still early days though for this - lots of (equipment-related and other) confounding factors could influence it and interpretation of the data isn’t easy either.
Marco Altini is going to be producing an app dedicated to this called HRVThreshold (I think). It will determine your LT1 in real time instead of just logging the data and leaving the analysis to the user or another tool. I’m looking forward to seeing what that looks like.
If you give wrong input then DFA a1 produces all kinds of weird stuff 
Although I would like to believe it 
Is there something still in work to Analyse or merge hrv dfa alpha1 data (csv) in intervals.icu … like IT is possible in runalyze? Would be cool Stoff!
I am planning on implement it from the HRV data Intervals.icu already collects.
Any news on this? 

