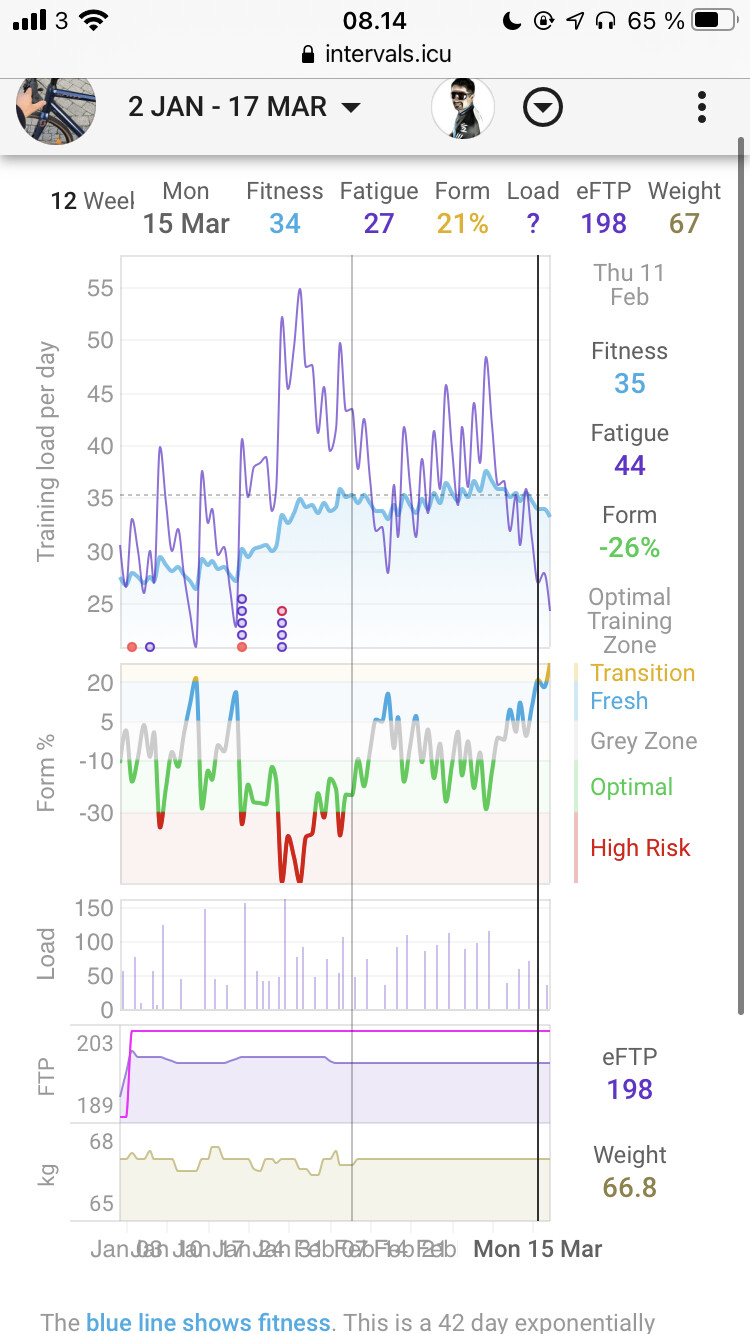
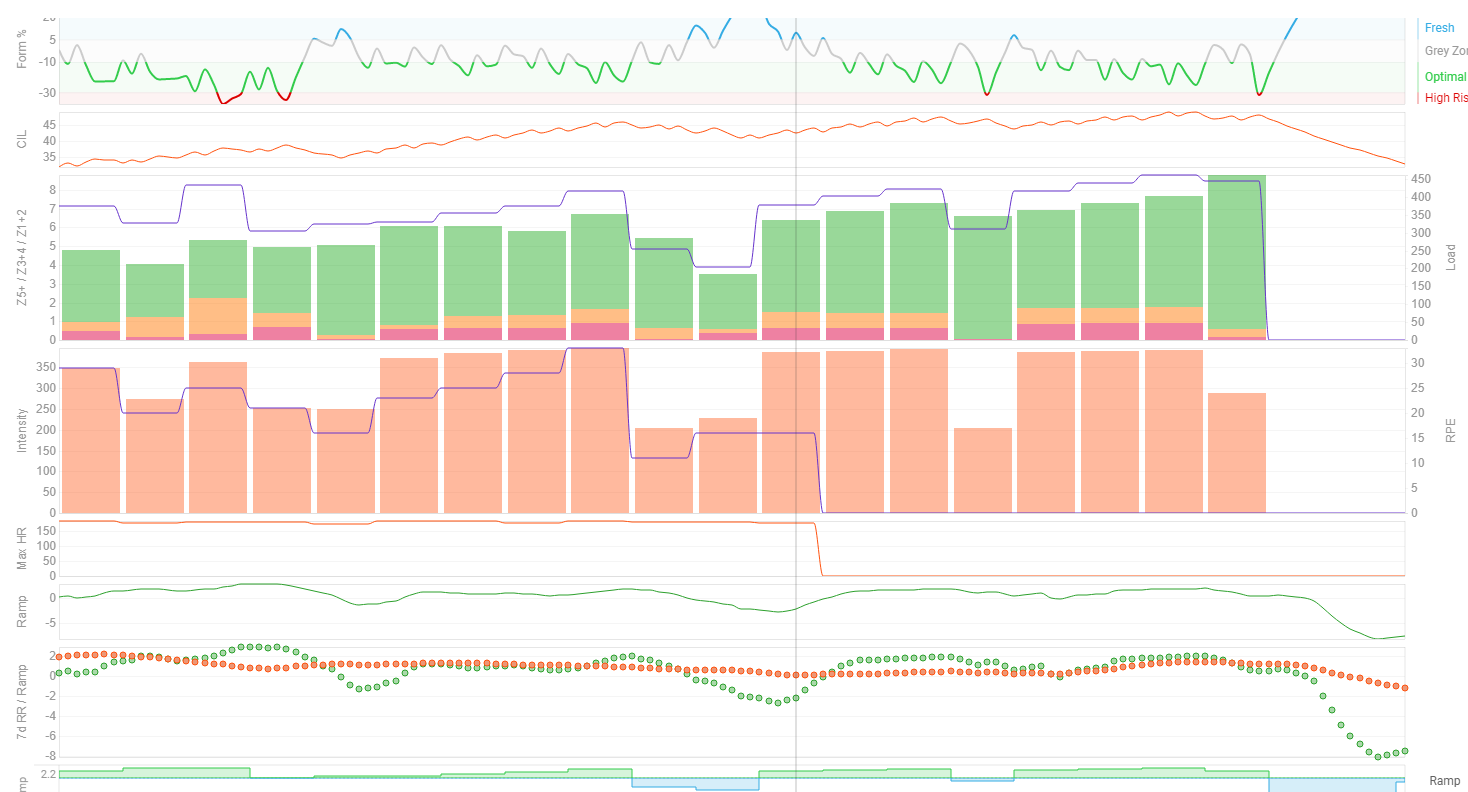
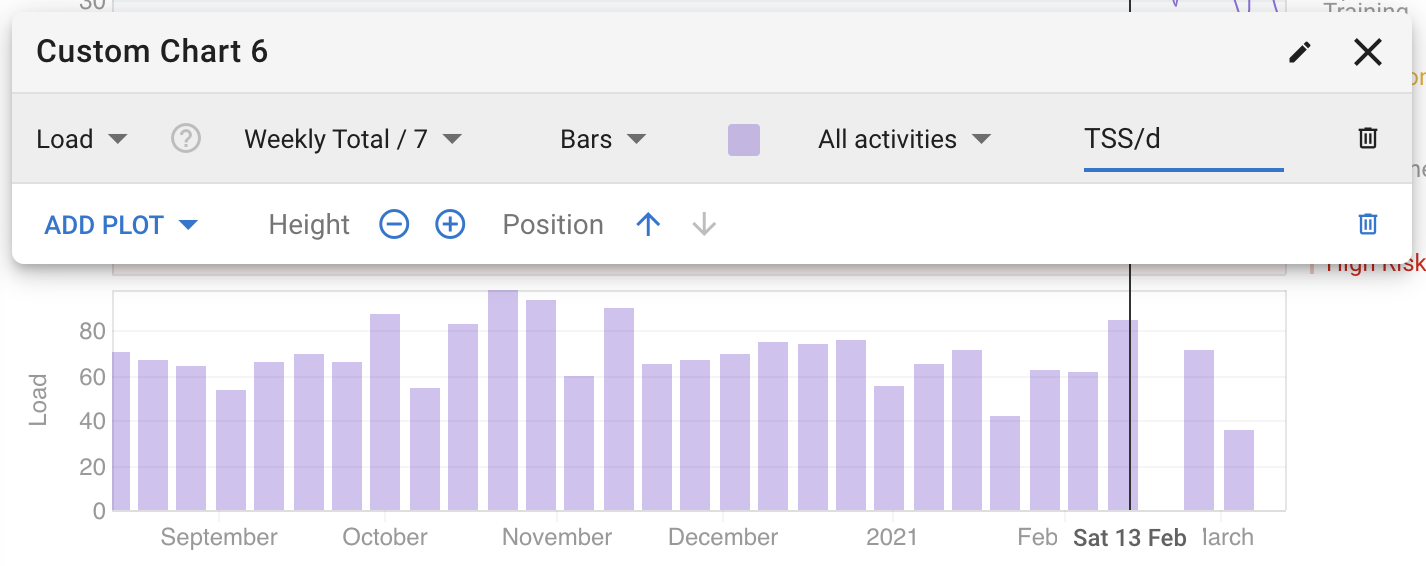
I have added a daily load graph under my fitness graph. It is close to what you want but not quite.
I agree that it would be nice with a TR-like load graph
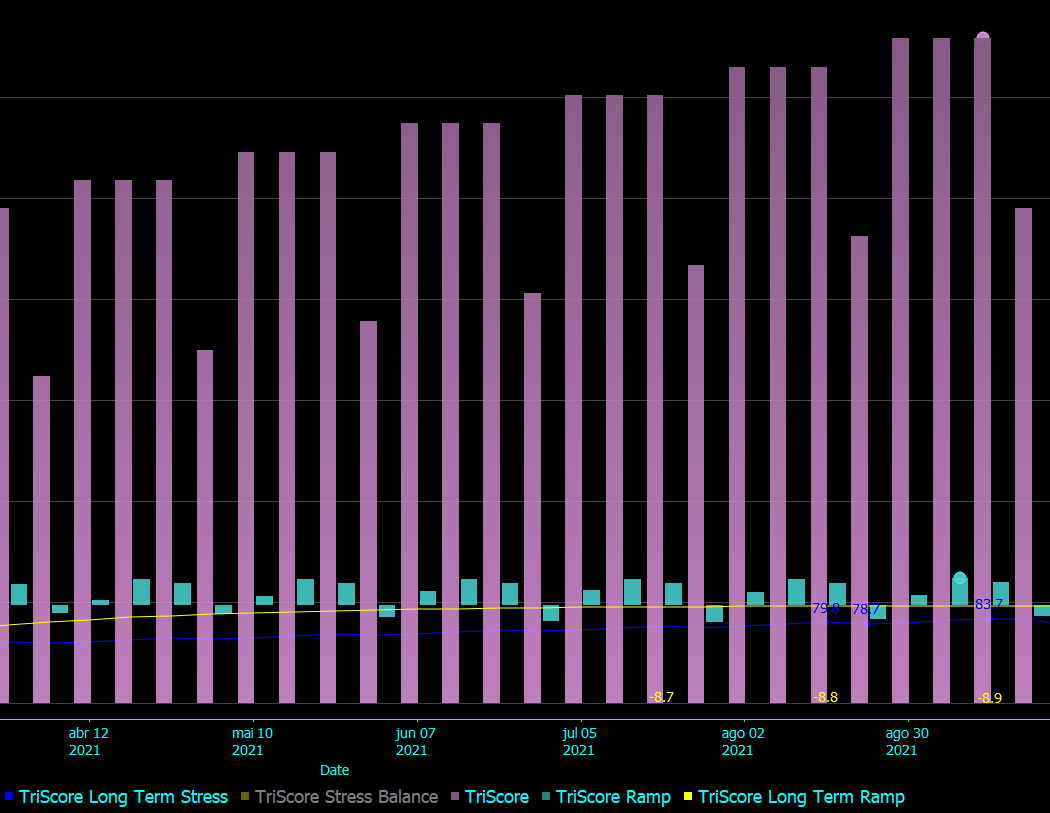
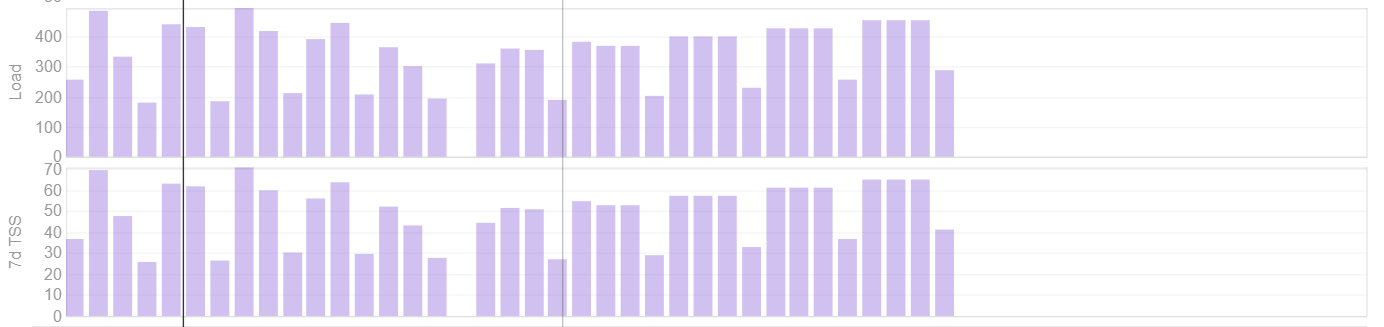
The chart bellow comes from Golden Cheetah and I’ve created a plan just to illustrate the difference between Fitness (CTL/Triscore Long Term Stress) ramp rate and Load (TSS/Triscore) ramp rate.
As you can see Fitness ramp rate (yellow) is almost zero while TSS ramp (cyan) is not. This is due the fact the load not to be sufficient to cause a significant impact on Fitness along the time.
Also the saying (arguable) over several sources specifies the following guide for ramps:
Weekly CTL Ramp of 3 to 5 (or 5 a 8 per Joe Friel…) = 4(3x1) week block CTL Ramp of ~6-10 (or 10-16 per Joel Friel …)
While TSS ramps:
Trainer Road TSS Ramp rate
TSS = Previous week’s TSS + weekly work days *rr
Typically, a weekly ramp rate in the 6 TSS neighborhood (+/- 2 TSS) works well for most riders, so a weekly ramp rate of 15 TSS is not recommended but still useful for our needs here.
I get the CTL ramp rate stuff and that is well established but the TSS ramp rate stuff seams like stuff made up by TrainerRoad because they can’t be bothered to actually do the job properly.
A far as I can see this is just the difference in weekly TSS/7
However, that’s not what is shown in your graphic as the TSS ramp rates should be zero for weeks 1 to 2 and 2 to 3 for any of the cycles you’ve shown.
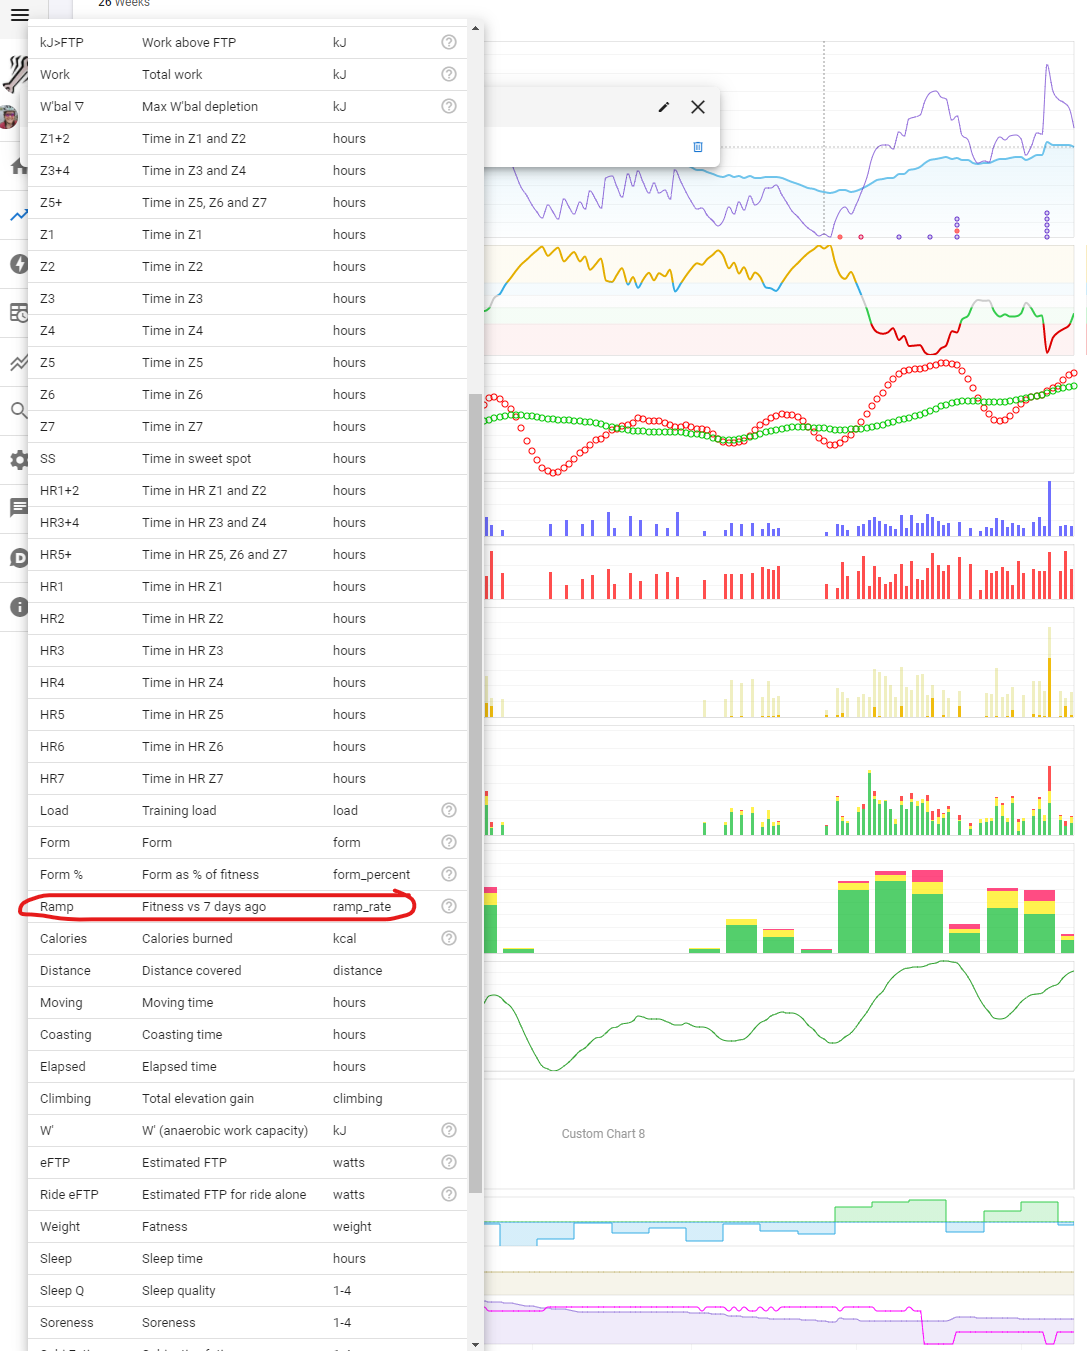
Is it to do with this?
Calculating TSS Ramp Rate
Tweaking a commonly utilized formula (Previous Week’s TSS + 6*rr) for our simpler purposes, we’ll use a ramp rate (rr) of 6 TSS and week 4’s total TSS of 163 TSS to get the following:
163 TSS + 6*6 = 163 TSS + 36 = 199 TSS
I have no idea why they have used a multiplier of 6 but you appear to have interpreted that as the no. of training days. Personally, I don’t think it’s sensible to vary ramp rate based on the number of days you trained, rather than the actual number of days in the week.
Lets say I did a week of 50 TSS each day giving me 350 TSS and the next week I did 7 days of 55 TSS giving me a total of 385. That’s a ramp rate of 5.
If, instead of doing 7 days of 55 TSS, I did 4 days of 96.25 TSS which also gives 385 TSS for the week, I’d end up with a ramp rate of 35/4 = 8.75 where in actual fact the week upon week change is the same.
Sorry If I’ve misinterpreted what you’ve been trying to say.
Any way, the importance of a TSS weekly ramp is that in theory we should not grow load more than 10% from one week to another besides some already established known ramp rates like TR’s 6 TSS neighborhood (+/- 2 TSS) general guide.
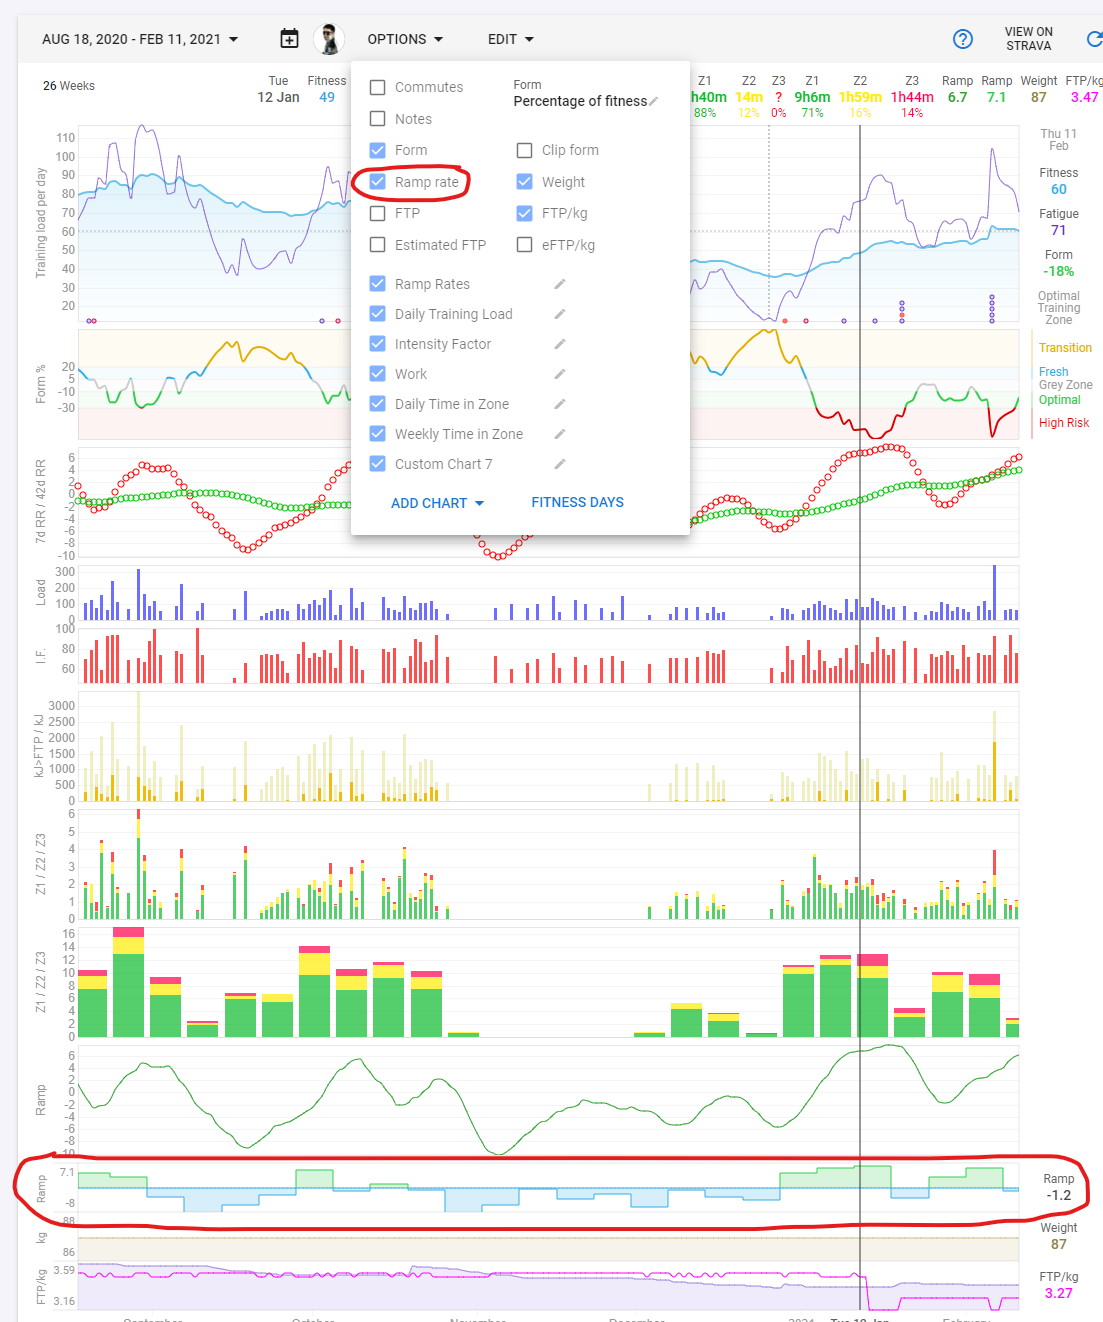
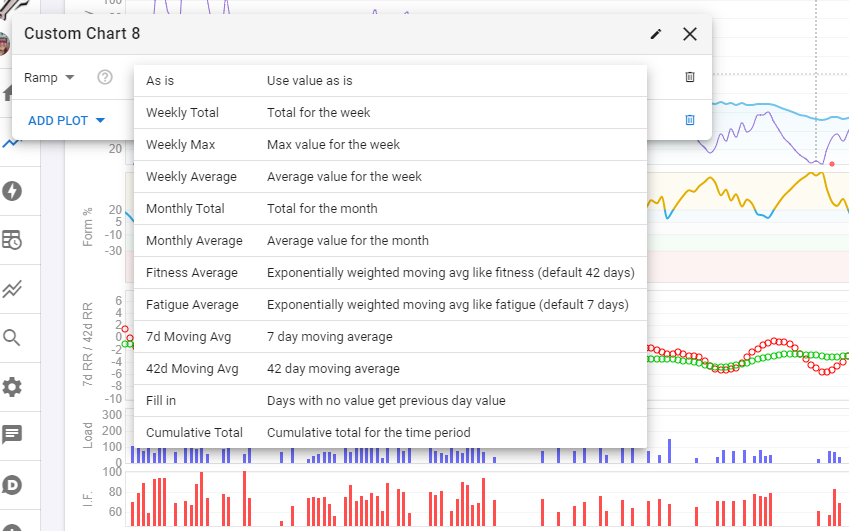
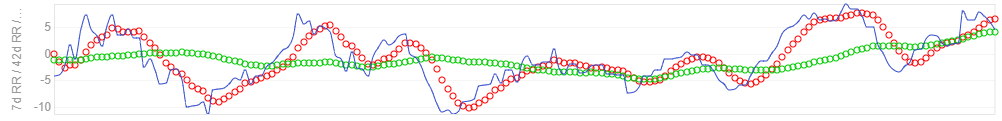
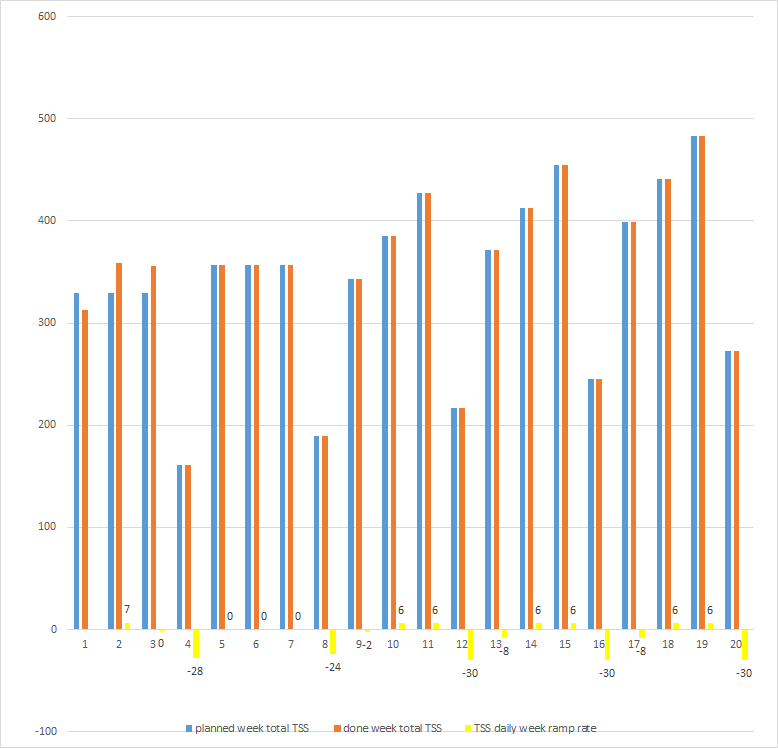
I hadn’t realized until looking back at this stuff, that they graphs aren’t actually what I thought they were:
I had imagined that they were the 7 day ramps and 42 day ramps whereas, in actual fact they are rolling averages over 7 and 42 days of the 7 day ramp rates.
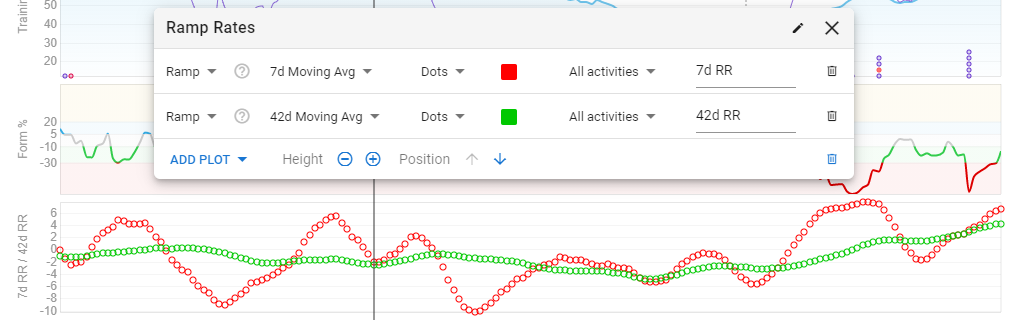
I’ve just added the 7 day ramp as a solid blue line for comparison:
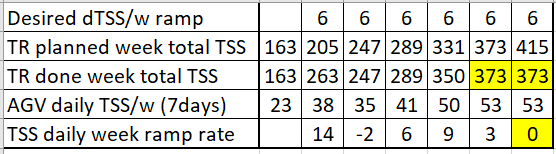
You are right. There is an error in TR’s web page. The correct formula should be : Previous Week’s TSS + 7*rr
I’ve done a small sheet to illustrate the concept.