It is totally normal that several measurements are required, even 4 is not enough, I prefer 15 days where we create a more coherent baseline.
Agreed, hence my suggestion use of the (Kubios App, and then the) PC program - during October, I would have had to have started againa and again so many times! Nb- I did just get out of hospital after 10 days - I knew ther was something wrong :-), especially then!
All good, now!!
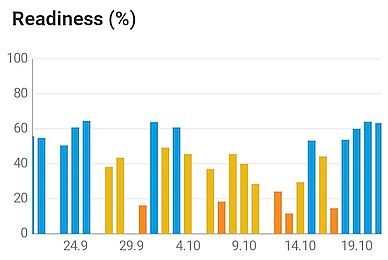
Been measuring my HRV since 2016 (HRV4, Elite, Kubios and some fairly esoteric ones HRVAS, Kardia etc - all info went into Golden Cheetah at the time). I’m no expert but I can spot long patterns and my doc trusts me enough that I can send a few screenshots, if I think I’m actually ill as opposed to just tired - also there’s no info given for 'did I drink/ travel etc) - it’s just how my body felt on the day, regardless. I did used to do measurements through the night, whilst drivinf etc…they were always fun.
You must have missed 3 in a 7 day period. As I said missing one occasionally shouldn’t be a problem in the grand scheme of things
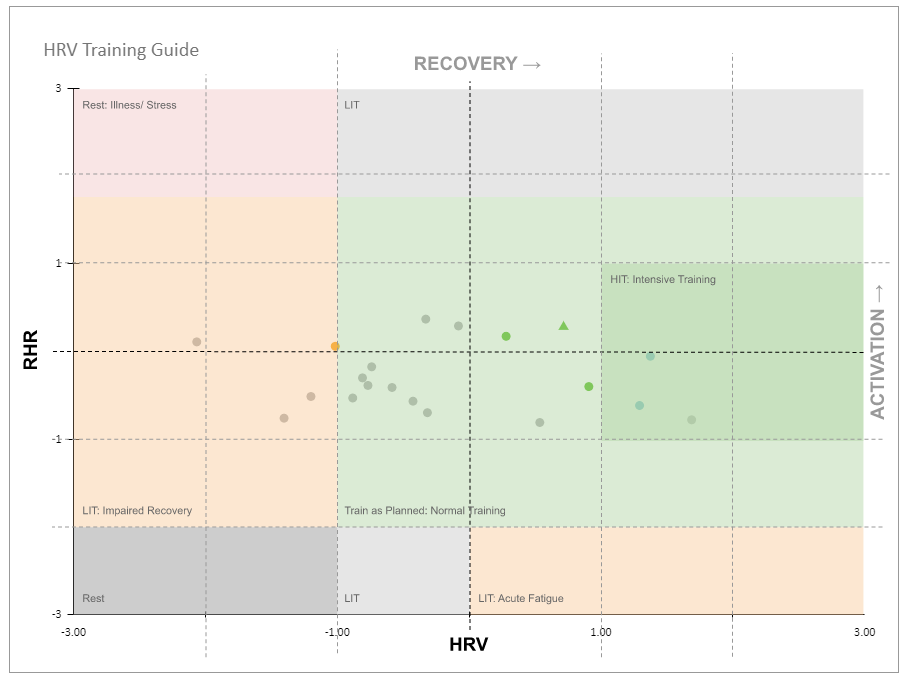
I have a question about the hrv-training-guide-graph.
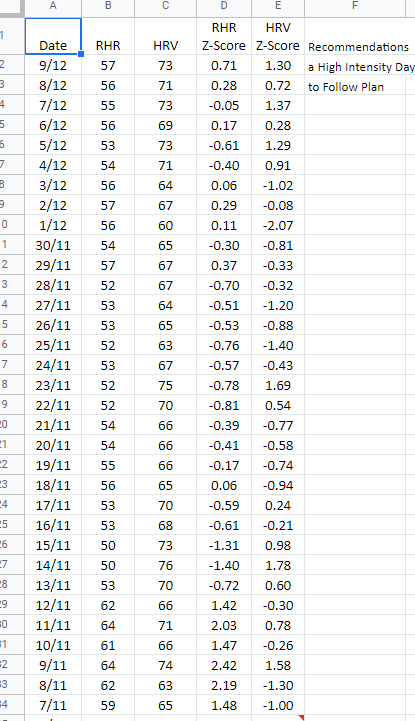
In the last few days I’ve noticed that the diamond for the current recommendation was not displayed. Today it is the case again (see screenshot) Why is that? Is there an bug somewhere?
Here are the values of the past days
I love my HR vs. Power comparison plot to compare progress and changes over different periods of time.
Would it make sense recreating something like that, but with DFA a1 vs. Power?
Is this already possible?
I’m aware this chart makes no sense for daily use, but for determining training zone or maybe gaining insights on the effect of changes in health (diet or maybe even climate) it could be useful.
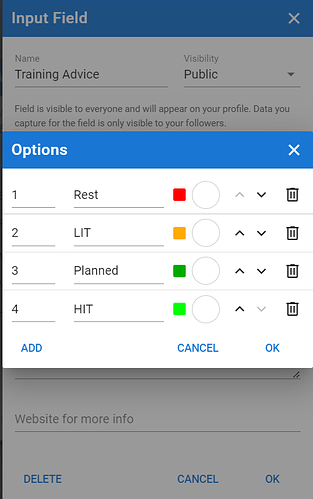
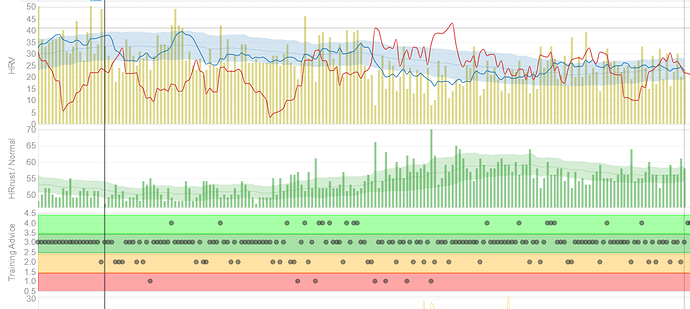
I have setup and shared a Training Advice field for the wellness custom metrics as follows:
You can manually set the field in the wellness dialog or you can send a score (1-4) through the API by means of a little vba script in the Excel version. I have something working but need to update the Excel file.
I have the Advice chart (also shared) right below the HRV charts, which allows me to quickly check if both analysis are in line with each other.
Have a look at this:
And the way it is implemented in an indoor recording app:
Is there a chance to get it also for the google sheet?
Keep an eye on this thread. something is coming within the next days…
Ai endurance works with DFA Alpha 1, after hundreds of tests and with the covid pandemic, DFA cannot be used as threshold detection as it leads to quite large errors, I personally before covid could set at 0.75 the first threshold and now 0.80 is my second threshold and totally changeable, DFA is also modulated by the respiratory rate, hence we are with the RR/A1 ratio and studying the behaviour of a new internal load metric based on taking these two variables. I will explain you the metric we are investigating as we will soon make a protocol looking for a n>20 where we will create a FTP improvement plan and we will measure with this metric.
Just wanted to point to the Ra and Da metrics representing Readiness and Durability based on dfa-a1. It looks interesting but I haven’t done enough testing to evaluate the usefulness.
Totally agree that the fixed a1 values are not valid.
Based on the exceptional work started by @MedTechCD I have implemented a new tool with same functionalities as ithlete Excel/Google sheets, but mainly intended to be used in mobile phones (Android / iOS)
First, I changed two things with the only purpose of avoiding any right conflict with the original company creating ithlete tool.
-
Name of the app is ImReady4 that I think self explains the purpose of this tool
-
Main chart is transformed into a polar chart to be differentiated from the original cartesian one.
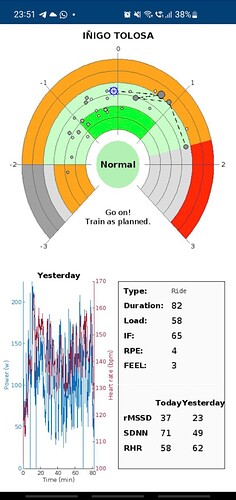
The screenshoot below shows the app output you should see when running this tool
It displays following 3 areas of information:
-
Main chart with colored zones. Points for last 30 days are plotted with increasing size as they approach today. Last 5 days trace is also shown to make easier checking the trend that has bring you to today’s contition. The chart shows the advice for today.
-
A second chart showing Power and Heart Rate evolution during yesterday activity
-
A data panel with main information about yesterday activity and a comparison between rMSSD, SDNN and RHR values for yesterday and today
Purpose of these two last items is to help you interprete better the advice given by the tool.
Said that, the instructions to use this tool. It is basically a Matlab script that can be run into Matlab Mobile (free app, even if Matlab desktop version requires a paid license).
Matlab Mobile installation
-
Go to Play Store or App Store and install Matlab Mobile. That will provide the framework to use the script
-
Create a free account in Mathworks if you do not have it yet
Prepare your data file (required to allow accessing to intervals.icu and keep your data safe)
-
Run Matlab Mobile and use the Archives option to create a new folder just in your Matlab Drive and call it ImReady4_data
-
Create a new script inside ImReady4_data and call it config_athletes.m
-
Copy following code inside to configure your intervals account. Do not modify the structure or characters except Name, ID and APIKey
athletes = {
   'Name', 'ID', 'APIKey';
};
You can add up to 10 athletes if you want to follow several people (for instance for coaches) Results for all of them will be obtained and shown in a row.
Obtain access to the script
Following link will provide any of you with most up to date version of the script.
ImReady4
Click it to open a web browser. Select the script and drop down the Add file menu. Then select Add to my files.
This action will automatically create a new folder inside your Matlab Drive called ImReady4 that contains the script ImReady4.m This script is a copy of the original one.
Using the Archive option in Matlab Mobile, open this script and use the RUN button to use it.
In case you experience any issue related to your local time zone, it is possible to set the correct one adding following statement in the config_athlete.m file
myTimeZone = ‘+01:00’; %use following format to set your Time Zone info ‘+HH:MM’ or ‘-HH:MM’
Hope it will be useful.
Great working!!
Fantastic tool that we have been testing for a while. I think we have to be careful with what results it gives us, as it is based solely on the rMSSD and RHR. If the rMSSD rises a lot it will indicate that we are ready for a HIIT, so we decided to add the sDNN which is a parasympathetic indicator, it is important that we always check our baseline, remember that there are athletes who train late and then make your shot in the morning and this may skew the data and if you have athletes communicate with him when you see something strange in the measurements. I have been using it together with @Inigo_Tolosa checking results and they are totally reliable, even well interpreted together with other parameters you can stop an athlete before he/she gets sick.
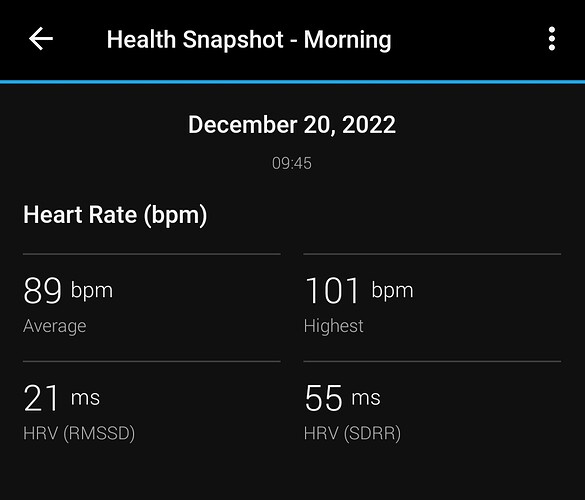
I am trying this amazing tool, but not sure if I have sDNN available through my Garmin watch. The rMSSD is published automatically to intervals.icu everyday. And I know I can input manually the sDNN with the Wellness Data panel, but I don’t know really if I can get it.
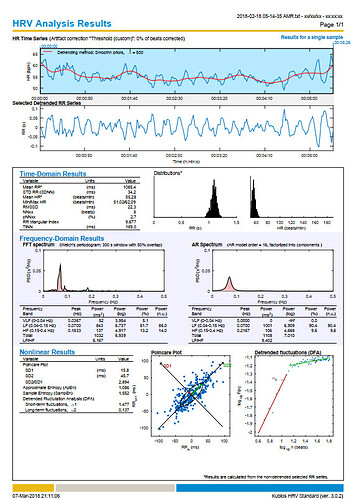
I can take a health snapshot, but it only gives me the rMSSD and the sDRR (screenshot). Is this information enough to get a reliable HRV-guided training?
This article describes what is best to use for Oura, Whoop and Garmin.
Hi @MedTechCD
I have added your “Training Advice” chart to my profile but only the four colors of suggested activity types are displayed.
Did I mess something up (heheh) or is this not a fully working chart yet?
best regards
Artur
At this moment you have to enter the daily result manually in that field. I have filled all historical data retrospectively with a vb script running in the Excel version. It’s a FOR-NEXT loop changing the date for which to display the result and then sending the TrainingAdvice score to the Intervals API.
It’s a matter of days before Inigo’s new tool ‘ImReady4’ will automatically push the result to Intervals every time you use it to get the daily advice.
Then there should be no more need to do manual intervention.
