Forget Readiness scores. Go with the actual rMSSD values.
In HRV4Training, go to the hamburger menu then History.
Sleep is only a rolling avg of daily hours. Switched that recently to a weekly total.
I added 7d CV to the HRV chart.
I also have Weight, Bike/Run hours and Time-In-Zones (based on 3 HR zones).
Compare is simply Power vs HR per season.
I’m not using night-HRV because I don’t have the equipment. Only morning HRV using Kubios app and trying to interpret myself. I’m mostly using the information on Marco’s blog, not to copy him, but more to understand how it all works.
I have about one year of morning HRV values and it’s all in an excell file that is constantly adapted to reflect new insights.
I recently got a Coros Pace 2 watch that is doing some very basic sleep interpretation. N° hours deep and light sleep + wake time.
Why did you switch to weekly total for sleep?
“Triathlon Taren” offers a great free automated excel sheet with a rolling 7 day average which flags up if your rMSSD is below average. It was created by Dan Plews, you enter your rMSSD in manually and after 30 days your rolling average is worked out. It can be downloaded here https://mymottiv.com/hrvtraining/
I just added that!
Is HRV collected during training (indoor ride / outdoor ride) actually useful? I see that my FIT file from my Garmin is logging the data.
Perhaps it’s useful when coupled or using it for DFa1 analysis?
For during exercise HRV data, is it charted or available for plotting? or HRV data is only available on the Fitness tab? I dont see it when I’m in the activity view even if I add a custom chart.
Garmin is logging the HRV data when activated in the settings of your unit and intervals is storing it. You can get it from the csv export.
But at this moment Intervals isn’t processing that data. HRV during exercise is only meaningful for the calculation of DFA-a1. It will probably come to Intervals as @david stated. The algorithm from Fatmaxxer is open source and written in Java and can be implemented in Intervals for the post analysis of DFA-a1. This allows estimating VT1 during post-ride analysis.
Thanks!! I was literally looking for the HRV data and couldn’t verify that it exists until I re-read this post HRV-Guided Training - #137 by david and figured out how to locate it.
I was trying to verify that my implementation of writing HRV data into the FIT file from my BreakAway app works when uploaded to Intervals. Looks like both L/R Balance and HRV is being written and is successfully being decoded by Intervals.
Yeah, I remember FatMaxxer and I had a quick look, it will likely take me a much much more deeper look to see if I can understand it and somehow plug it into the app for during-ride view. (Tho I have a Wahoo Tickr and not the H10, and it’s not so great for HRV)
Also gonna start getting garmin wellness data into intervals, i am currently just trying Jan 1 - Jan 6 but it’s been 10-15mins and doesn’t seem to have populated. Will Wait.
Here’s the new look (with band) on the HRV and RHR chart:
This is one year of data. I was having problems with stress, irregular heartbeats, high blood pressure, abnormal weight loss… and diagnosed as Hyperthyroidal in August (highlight bar). Started medication to reduce thyroid function followed by surgical intervention to remove half of the thyroid with overactive nodule. HRV normal values are almost double now and the influence on HRrest is phenomenal (instant drop of ~10beats). Feeling much better now and slowly taking up some more intense training after a year of training with “precaution” because I taught I had a heart problem.
I’m now exploring the possibilities of charting the “Recent Trend” as used in the latest version of HRV4training.
Thanks @MedTechCD - I hope you continue to feel better!
Would you mind sharing your plot settings for your graph please?
What’s HRrust?
I’'m not so dilligent in taking daily HRV measurement (I’m using HRV4Training) and thus I have no such data to share, but my RHR did shoot up after my Booster Jab tho and I did a 10day cool-off before I restarted any activity.
I’m sure it’s meant to be HRrest, if you read the text in his post.
Yes it’s Dutch for resting HR. I’ll share my settings later today in English setting.
I’ve just completed my first workout using the FatMaxxer App and the Polar H10. I’m also wearing a CGM (Continued Glucose Monitoring) sensor for my diabetes.
It seems to work very well. I did try to be in the fat burning zone for most of the ride and my Glucose levels stayed level. At the end I pushed over the limit and at that point (with a bit off offset) I could see my Glucose levels sinking. Will report back after some more workouts.
FYI: I’m pretty sure the value used by HRV4Training is a simple log transformed value of HRV RMSSD and comes out roughly between 4-10. If I calculate 2*Ln(RMSSD) on my data, the result looks very much like what HRV4Training is spitting out. So you could put the HRV value in the field for HRV RMSSD and the graph will be very similar.
I’ve been questioning myself if it might be better to also use the Ln (RMSSD) because the CV value aligns better with the literature. Andrew Flatt also uses Ln (RMSSD) and CV > 20 as a limit. When using HRV RMSSD as is, CV values are scaled differently.
Edit: about half way this page, there is some confirmation on what I wrote above
https://www.hrv4training.com/blog/a-brief-history-of-heart-rate-variability-hrv-features
I’m really interested in your settings for these charts.
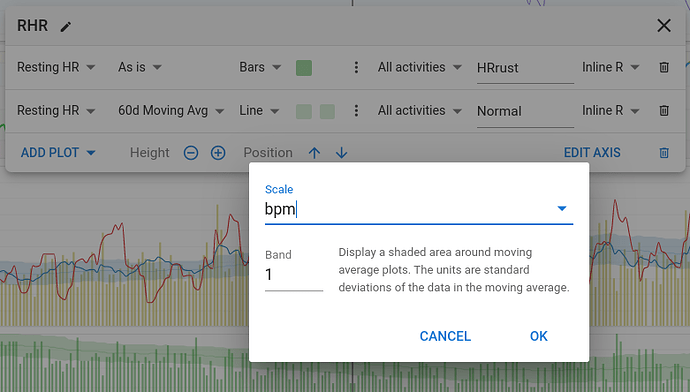
These are the settings for the Resting HR chart:
The bars show your daily value and the “normal” band shows your 60d avg +/- 1 std deviation.
Remember that a Resting HR outside your normal values usualy is the result of an acute stressor. Longer term changes in resting HR can show modified fitness or life style changes. There is also a slight influence by the seasons, that should become clear with multiple years of data.
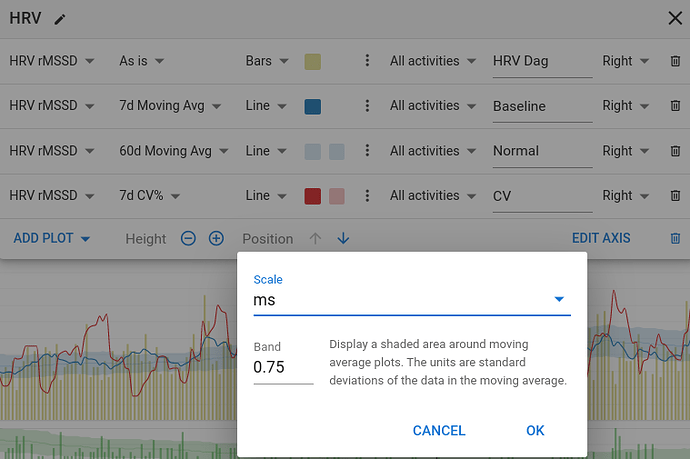
And these are for the morning HRV measurements:
Yellow bars are the daily values. Similar to RHR, a daily value outside of the normal band can reflect an acute stressor.
Blue line is the 7day avg and gives you a good idea how well you are coping with multi-day training load and life stressors.
Blue band is the 60d avg +/- 0.75*SD and considered your personal “normal”.
Daily values and baseline values within the normal band are considered a stable condition and everything is going well. Values outside the normal band need to be evaluated. This evalution takes RHR, CV and subjective scores into account to make some decisions.
I have added 7d CV to this chart but I’m still thinking on how to get the best use out of it. For now the simple thing to remember is that a low CV is usualy a good thing. Just as anything in this domain, stable is good.
Disclaimer: Nothing about this is my own work. It is all based on the magnificent info found on Marco Altini’s blog. I have done nothing more then reading a lot and putting things to practice in this equally great software suite developped by @david. They are the ones to thank for their tremendous work.
@david perhaps we can crowd source a how-to guide, that should save you time to develop.
Perhaps a review before posting would help.
I don’t mind assisting, but would require help from the many others who know much more than me. I would certainly let benefit from the many different view on interpreting the data.


