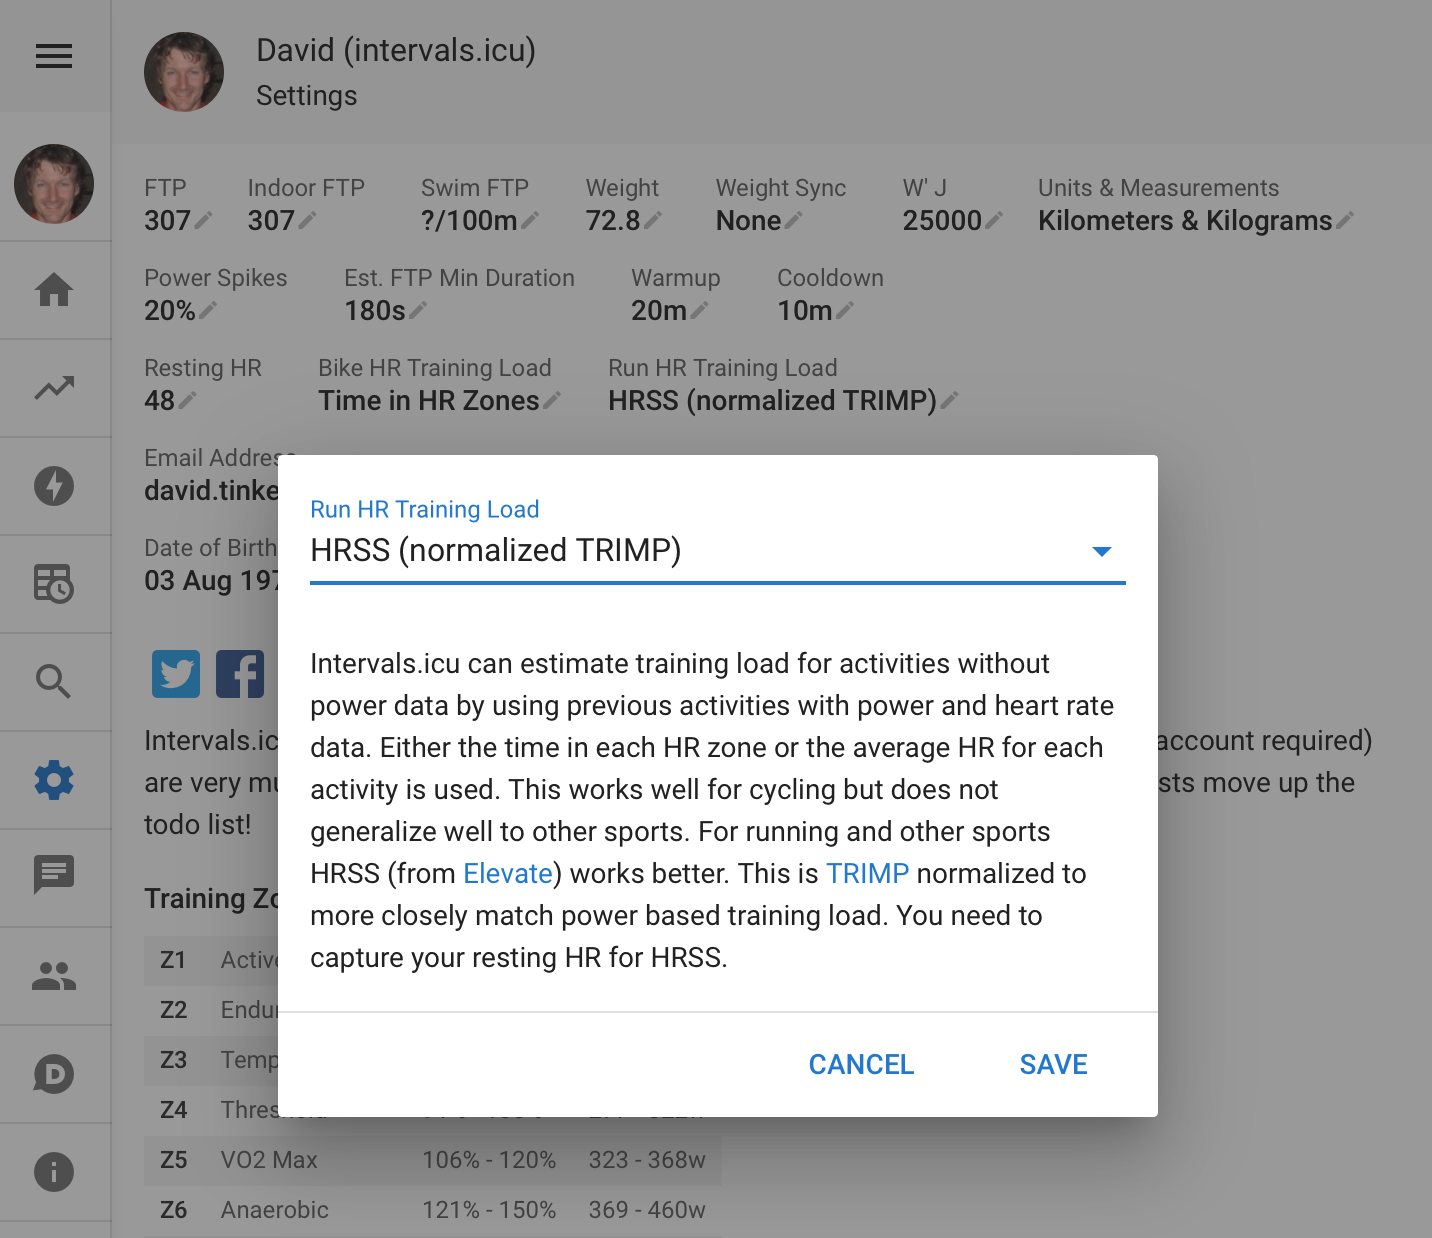
You can now choose to estimate training load for activities with heart rate data only (no power) using HRSS (normalized TRIMP) as used in Elevate. You can also have different settings for cycling and running (and other sports). HRSS works better for running than the cycling derived models. You need to capture your resting HR and a good threshold HR for HRSS to work well. HRSS is now the default model if there isn’t enough data to build the others.
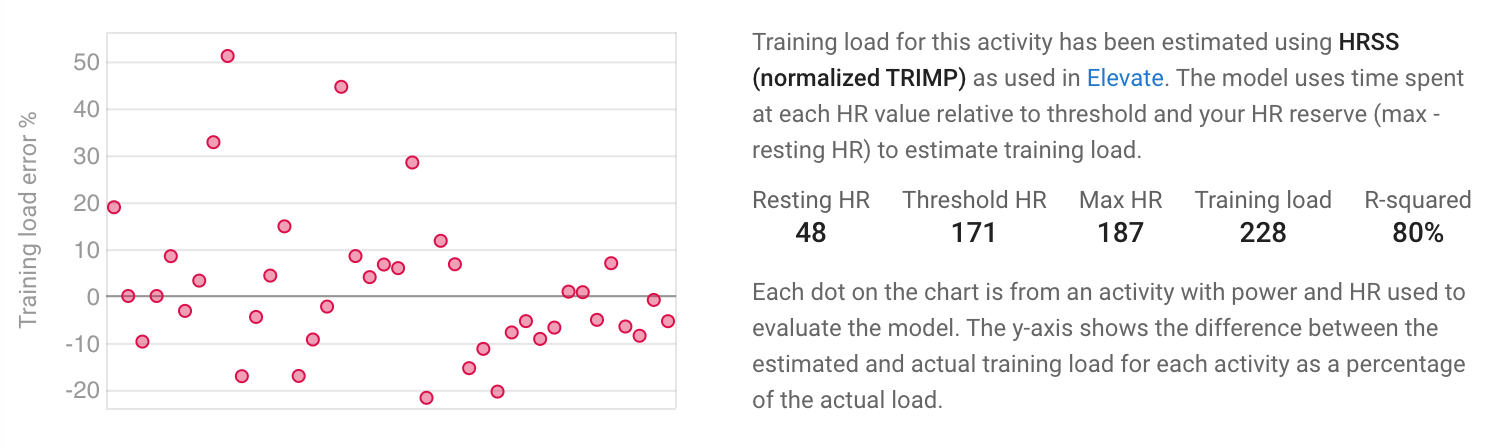
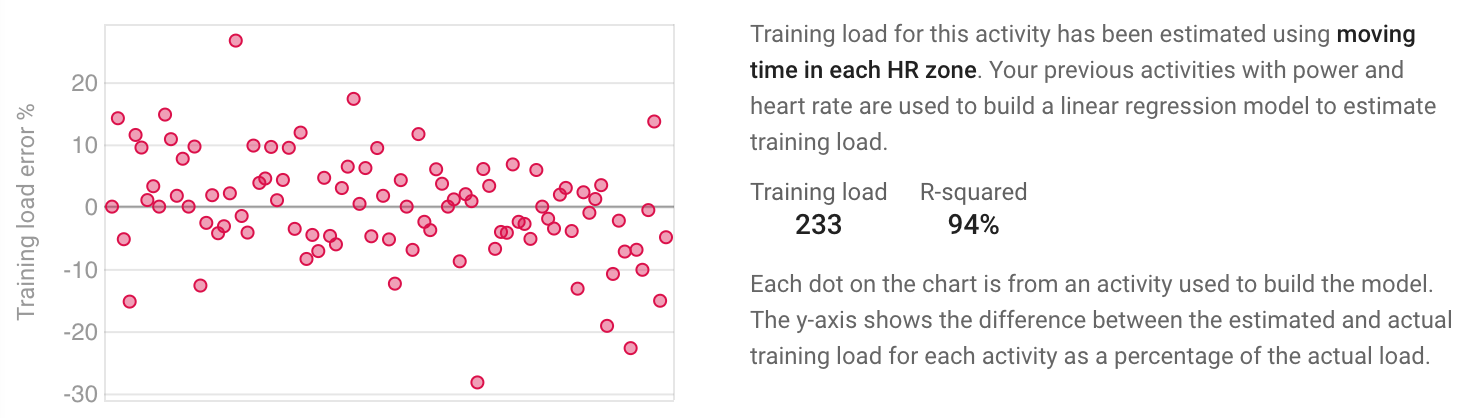
but david, correlation is exactly what you have found. in the picture above r-squared = 0.8. that means that 80 per cent of the variation in TSS is accounted for by changes in HRSS. In my case, over the past 42 days, that r-squared value is 0.9 [though i use moving time rather than hr average, and it’s all cycling].
i don’t know how you are offsetting hr [which lags behind power] to do these correlations, but if there is no offsetting, then at the workout level, these are pretty high correlations.
remember, though, that these correlations are at the workout level. the activity power page shows the correlations at the level of 1-minute within a workout.
Ben_CoveSC: the implication of all this is that you can use hrss to estimate TSS if you do activities that don’t have a power meter. in fact, david does this for you.
I’ve been getting to grips with Intervals.ICU recently (really awesome tool, kudos to @david on all the hard work and making this widely available), and I’ve been thinking about the best way to compare HR only activities like running, racket sports, etc. I note the statement on the settings page and in this forum announcement that HRSS (normalised TRIMP) is better than the AVERAGE HR and TIME IN HR ZONE models. Can this be elaborated on / any good resources which explain in more depth? Considering David’s data above, and also looking at my own, I have a much stronger correlation for the TIME IN HR ZONE model than for HRSS. This leads me to think that I should be using the TIME IN HR ZONE model for HR-only activities, but perhaps there is more to it…
Tx. The “time in HR zones” model works well for me as well but I only do cycling. A lot of people had problems with using it for running so it seems that it doesn’t generalise well, at least for quite a few people. If it is producing good results for you then for sure stick with it.
I made HRSS the default for non-cycling activities because it is “safer” and less likely to give way out results. Also it doesn’t need any training data which is a big advantage. Someone new to power training or without a power meter can get good info out of Intervals.icu.
I implemented the “average HR” model first. Its simple but time in zones will be better for most people for cycling and HRSS is better for running etc… I kept in in the platform as people are using it and maybe it is better for some.