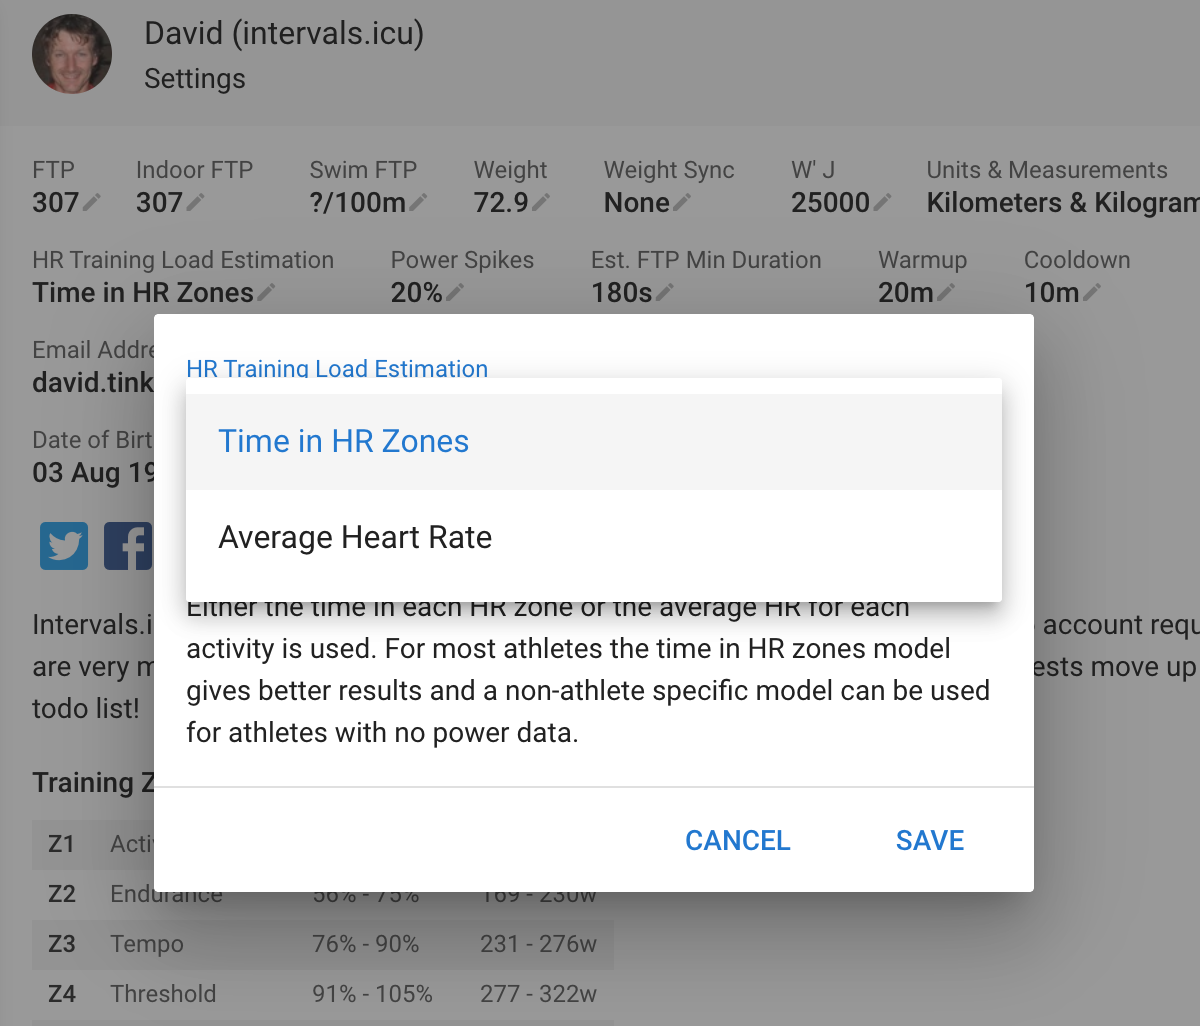
The default “Time in HR zones” model uses the moving time in each heart rate zone. Your previous activities with power and heart rate are used to build a linear regression model to estimate training load. If there are not enough activities then a general (not athlete specific) model is used. Essentially each HR zone is assigned a weight with higher zones having a bigger weighting as they contribute more to training load.
The simpler “Average Heart Rate” model uses previous activities with power and HR to map average HR to training load per hour. Then training load is calculated by looking at the average HR for the activity and the moving time. It cannot be used unless you have activities with power and HR to build the model.
Sometimes the “Time in HR zones” model produces poor results (not enough good training data) and you might want to switch to the “Average Heart Rate” model.
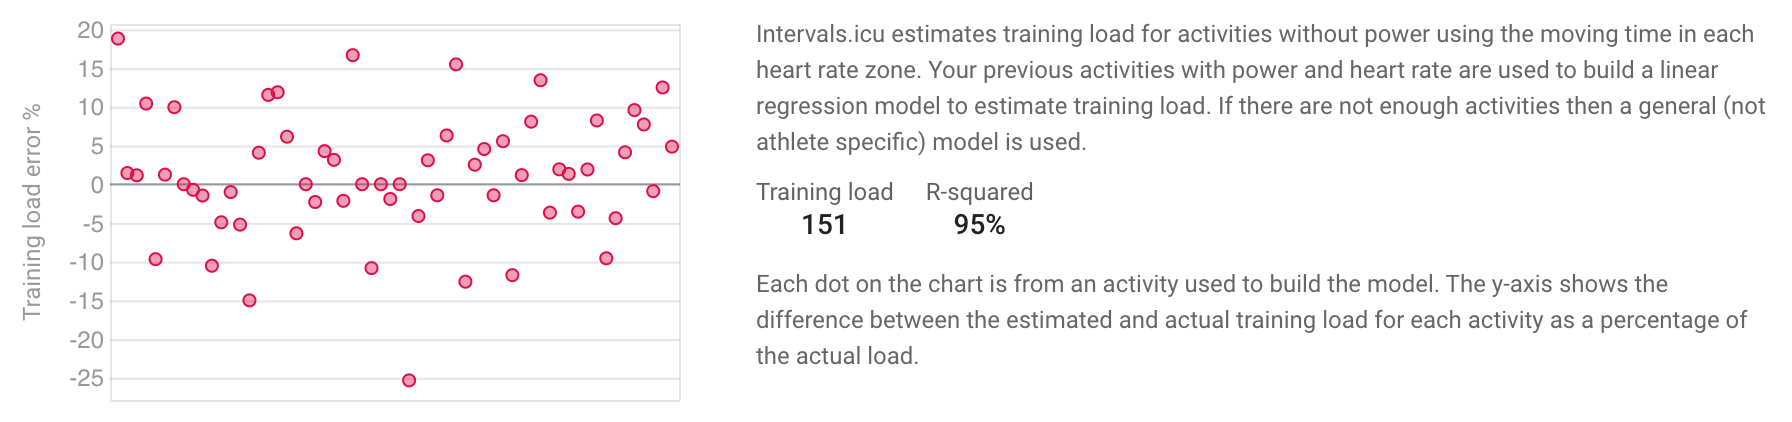
If you have activities with power and HR then each activity with only HR data includes a chart at the bottom of the activity HR page showing how the model is doing:
Future work:I am planning on revising the average HR model to make it work with HR percentage relative to threshold HR. Then I will be able to build a general model applicable to athletes with no power data.
Yes that correct. Those numbers are displayed for rides with power and HR just so you can see how the model works. The training load is always computed from power if available.
I’d use simpler statements like “if power was not available, HR stress load would be X (based on the model)”. For a typical ride with power and HR this plot is not very relevant, but this is not obvious.
Also, due to bad power meter calibrations and dry HR straps I have some points with >100% errors and there is no one-click way to exclude them from the model. Maybe just remove the outliers automatically?
I forgot to mention that you can exclude individual rides from the model. You need to note the date of the dot and go to the activity on the calendar view. Then click the cog icon and tick the “Do not use HR data …” box. This isn’t as nice as automatically cutting outliers but a good fix for acting up HR strap.
Ah yes I see. Anyway I have implemented your remove outliers idea and it makes a huge difference to both the “average HR” and “time in HR zones” models. Got rid of anything more than 1 std deviation away from the mean. R-squared for me currently has gone from 60% to 98%! Thanks a stack!
Its currently re-computing HR load for everyone which is likely to take a couple of days.
Thats true. Hmm. I also looked at quite a bit of the data and the ones it was tossing out for me had issues e.g. a fast group ride (race really) with very stochastic power gave me a very high HR but power that wouldn’t get over threshold HR done at a steady pace. And another with still unexplained high HR (maybe I was fighting off a bug?, never got sick) etc… With my data usually approx 10% of the rides got chucked out.
I also bumped the number of activities used to 100 from 60. That also helped.
Anyway I am going to go test 2 std deviations and see.
Ok I have changed outlier threshold to 2 x std_dev. It still gets rid of the the rides that were messing up my own data but keeps more. Only slight drop in r2.
David: first off, thanks for your amazing work on all this analysis. It’s wonderful.
Now estimating stress from HR. I guess that I understand your basic approach to doing this. However, today, I got a really weird result. [Activity A] - an hour in the gym and some pottering around = 1:45 hr with 99.5% of time in your Z1, recovery. Result is estimated stress of 93. [Activity B - 1:30 hr on indoor trainer with 26 minutes at threshold, giving over 15 minutes in Z7 and less than 13% in Z1. Result is estimated stress of 105.
A was a bit longer than B, but A was basically all in Z1 whereas B was more than 87% above Z1. Yet the computed difference in stress is very small [~12%]. What’s going on to make this sort of counter-intuitive result?
Neither of the HR models generalise well to low HR activities like gym and yoga. I suggest setting the training load for those to 1 or something low as they aren’t going to help with fitness anyway. There is a long outstanding todo list item to make those add to fatigue and not fitness.
I developed these using my own data which is all cycling (road with power and HR, MTB with only HR) and everything was peachy.
Could you please send me links to activities A and B so I can have a look?
Tx. I see A is now 42. Did you manually edit that or is that after changing to the “Average HR” model? Activity B has power so the HR load estimate is just to illustrate how the model works.
I think I might have to make “Average HR” the default for people with power and HR.
Yes, David: that was a manual change to 42. It is the load from an average of 5 gym sessions that I did a year or more ago. Estimated from a HR model of load that I found somewhere.
I’m not sure that I agree with your stand on the fatigue / fitness business. I take them merely as long term and short term measures of load. I do not believe that they should be thought of primarily as fatigue or fitness. As such, I try to include reasonable estimates of load into gym activities that are aimed at improving my cycling as well as general health. If I were to do other forms of cross training, then I would want to include them into long term and short term measures of load too.
Importantly, the difference between long term and short term measures of load is an indicator of backing off or of ramping up training. And the zones [optimal, grey, etc] are indicators of where one is in terms of ramping up or winding down. If you add cross training load to one measure and not the other, then form loses this important property.
I suppose that my take on this is that people should be enabled / encouraged to either include or exclude cross training from their activity calendars and thus from both fitness and fatigue.
I’d like to report weird results. I did a half-marathon today and intervals.icu gave me a load of 328!
By the most basic reasoning, the load cannot exceed 150. I ran evenly for 60 min < t < 90 min — so this is a threshold effort. Even though the HR was above my LTHR=182 for most of the race. It is okay, adrenaline and HR drift allow you to be formally over-threshold for extended periods during races. Strava and Elevate report Running Stress Score=138 and HR stress score=122 — they make sense.
I observe a similar situation with a recent 5k race — the estimated load is also much larger there. My HR strap had a better day, so no crazy spikes
Finally, here’s an activity with no HR artifacts (I really took a break in the middle of a marathon ) which also has a 30% larger load than other sources.
I think this could significantly influence the Performance Management Chart for runners.
Hmm. I had a look at this one. I think the cycling derived time in zones HR load model isn’t generalising very well to running. You spent 54% of the 1h25m in Z5+ which is VO2 max zone + on a bike which would produce huge load (impossible I think).
It is possible that the average HR load model would work better for you. I am busy downloading your data so I can experiment a bit. I am also going to try find out what algorithm Elevate uses for HR load.

 ) which also has a 30% larger load than other sources.