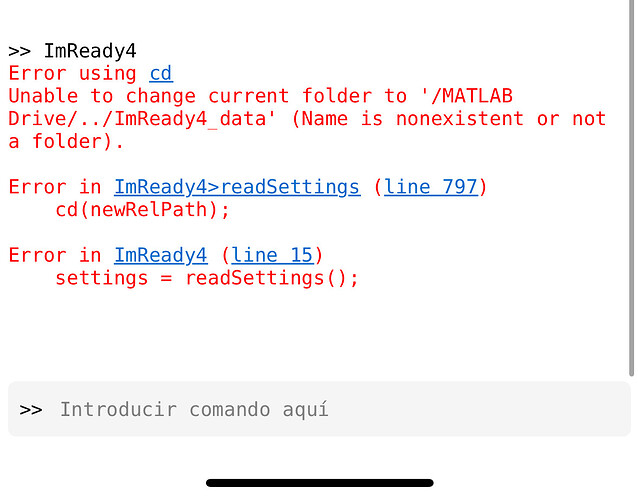
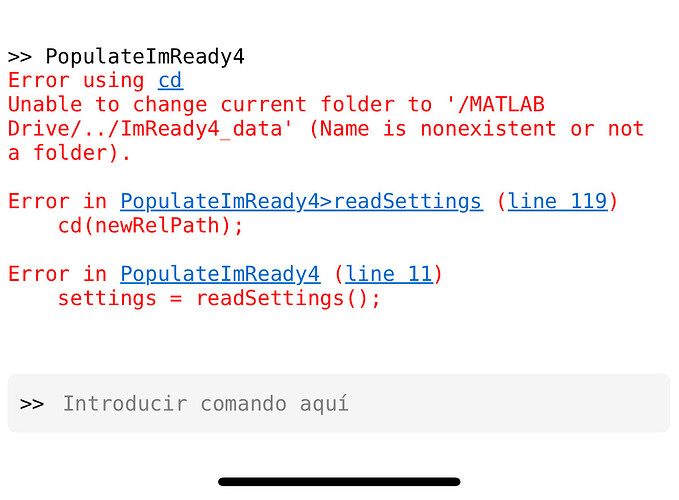
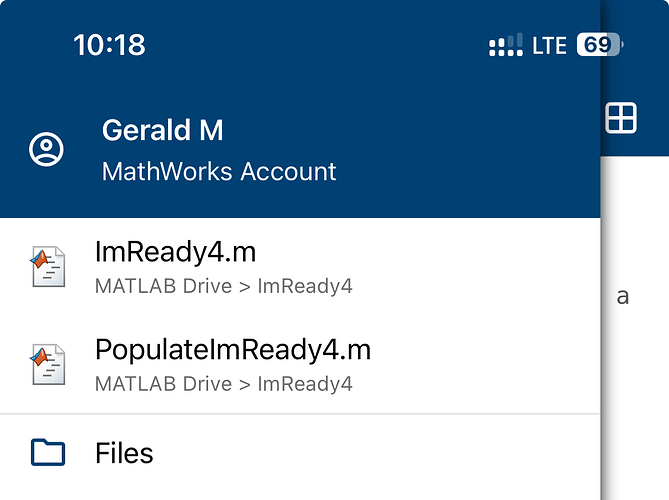
He actualizado a 4.43 y tengo estos errores. No se como solucionarlos. Pueden ayudarme??
Don’t know if you already got this fixed but you first need to copy the folders to your own MatLab drive.
Hi all, is there a way to automate the execution of the ImReady4 Matlab script? Or does everybody execute it manually every day?
I run it manually, daily.
If I miss a day, for whatever reason, the Populate script can run any number of days in the past.
Hi all,
since I haven’t got Matlab I ported the script to Python. You can find it here.
It downloads the wellness data from the Intervals Api and plots it in a graph. This plot gets saved as figure. The TrainingAdvice Code gets also uploaded to Intervals.icu via Api. The credentials must be stored in a separate file called .env. It also requires some python libraries. You can install them with the command: pip install numpy pandas requests matplotlib python-dotenv.
You could easily execute this script with Cron on Linux or with Taskscheduler on Windows to run every day. This would make automatically update the Chart within Intervals.
Is there a way to write own charts directly for Intervals? I would love having this in Intervals without any external programs involved.
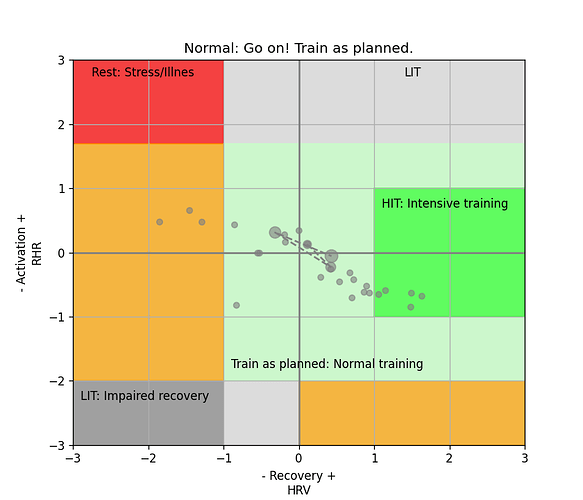
This is the output:
Nice work. One more alternative.
For this kind of chart, there’s only one place you may be able to add it in Intervals and that’s on an activity. It doesn’t sound like the ‘correct’ way but the Activity Power, HR or Pace pages allow the use of JavaScript and Plotly charts.
The documentation on how to use it is here:
Hi, I found today in “CIQ” such an application for Garmin smartwatches:
I am not the author, just sharing the find ![]()
regards
Artur
Thanks for sharing this and also for the rating ![]()
I wrote it. It’s just another way to show the wellness data from intervals. But on Garmin devices. The z-scores are fetched from the Intervals api, calculated locally and plotted every time on app startup. It uses the rolling mean/std of the last 30 days.
The source code lives here on GitHub.
Ohh, excellent script, and yes, this needs to be in a cron! On Debian at least you can then install the mailutils package and then use this command to email the result to yourself in the morning:
mail --content-type=image/png -A Imready4.png -s "ImReady4" YOUR@EMAIL.ADDRESS < /dev/null
I guess I’ll just run it at a late enough time in the morning, or alternatively figure out how to see through the Intervals API whether I’m awake yet (check for a sleep score?). ![]()
Hi, is there a way to get that App running on my Fenix 6?
Yes I want also available for Fenix 6 !!! Is the developer here ?
Interesting stuff, and I like having another datapoint to reference.
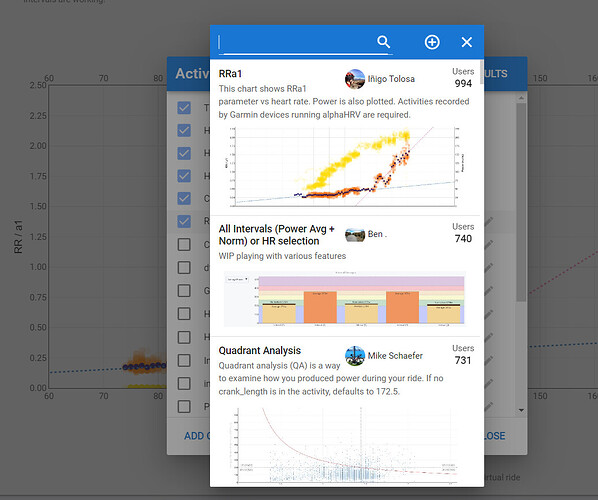
How might I access this info in the custom stream builder? I’m getting “TypeError: cannot read property “0” from null” when trying to access icu.streams.Alpha1, though I see that populated in the fit file.
Just playing with correlations. Might not amount to anything, might prove useful (to me, anyway) or at least interesting (again, to me)
{
let alphaOne = icu.streams.Alpha1
let watts = icu.streams.watts
for (let i = 0; i < data.length; i++)
{
data[i] = watts[i] / (alphaOne[i]/0.75)
}
}
All streams from the Garmin IQ field AlphaHRV are already available per standard:
a1 and RR/a1 in above screenshot, same for Artifacts and respiration.
You can also add the Alpha HRV chart on the HR page:
(Bit of a long story here, sorry, writing this down here because it does affect ImReady4 results I believe, note BTW that I’m using the Python version not the Matlab one!)
On RHR data I’ve noticed something interesting and likely (?) unhelpful with Garmin data. While probably one would assume that RHR for a date is the overnight RHR for the night before that date, this isn’t always true.
In reality, it’s the lowest 30m average on that overall day. If I wake up to a high RHR but then spend the day at work at my desk, I’ll regularly see that reduce the day’s RHR by at least 1 or 2 bpm.
And more significantly, and honestly this seems like a Garmin bug maybe, as long as you go to sleep well before midnight, that’s another opportunity to replace your high RHR datapoint with a lower one, where RHR for day 1 and day 2 will both be very nice and low even if you had a tough day 0, as long as on day 1 you took it easy. (Want to go nuts on day 2 again? Won’t show up on your stats either.)
With ImReady4, this leads to images for subsequent days showing datapoints moving around. And most importantly, when you run it in the morning, it will compare that morning’s RHR against previous all-day RHRs, so a misleading baseline I’d say?
I don’t how to fix this, and of course someone may even disagree with me on whether this is truly broken… ![]()
It´s simple. RHR is a spotcheck and needs to be measured and evaluated at the same moment and in the same conditions every time.
If you want it to be meaningfull, measure it first thing in the morning, right after waking up.
Dump the Garmin value. They only give you what the unknowing customer prefers.
You don´t want to know what your lowest value is over 24hr (it could actually be an artefact). And you don´t want to know what it is after sitting at a desk for multiple hours. What you want to know, is how your body responds after an effort followed by a normal night of rest and recovery. That´s something you can work with for analysis. It tells you if you returned to baseline or not.
Yup, agreed. But do you mean you don’t trust automatic RHR measurements overnight of any kind? I’m definitely a sucker for things happening automatically (I never trust myself with any kind of routine ![]() ).
).
I wonder whether Intervals.icu could be pickier about the RHR datapoints it takes from Garmin and/or track morning RHR separately from all-day RHR…
I don’t think that Intervals needs to be pickier. I think if the end user wants meaningful analysis they they need to take meaningful measurements. Overnight average/lowest RHR is garbage data. Measurements are not repeatable.
Thanks for the reply. I want to play with the data, which I can’t do with someone else’ charts. And since the available charts are locked, I can’t introspect them to figure out the fields behind the charts. This is why I shared my code.
Do you have the standard charts enabled?
That probably locks the data-streams and then you can´t do ´your´ things. Only one process can access the same stream AFAIK.
With or without the standard dfa-a1 chart, I get the same results, which is not surprising, since JavaScript, like most programming languages, doesn’t care about multiple processes reading from an object(prototype, technically, with JS). Also, if that were the issue, you wouldn’t be able to have both “standard” charts at the same time (or most of my ThisVsThat charts), which works just fine.
The error message seems to indicate a stream at icu.streams.Alpha1 which is empty on an activity for which the standard charts work. This would suggest either that the standard charts are reading from a different stream, or the alpha1 stream is being treated differently from many other streams.
