Hello,
I’m a happy customer of Intervals.icu for an year now, and I’m also currently reading some books about training (currently Training and Racing with a Power Meter 3rd edition).
I was curious to understand how you use Intervals.icu to find your points of weakness and optimize training.
From what I’ve understood, we should check how our power curve compares to athlets with the same phenotype (looking in particular at power over 5s, 1m, 5m,FTP) and try to improve the areas where our curve is below. Is this the correct approach?
Is there a way to plot the power curve of other athletes with the same phonotype on our powercurve?
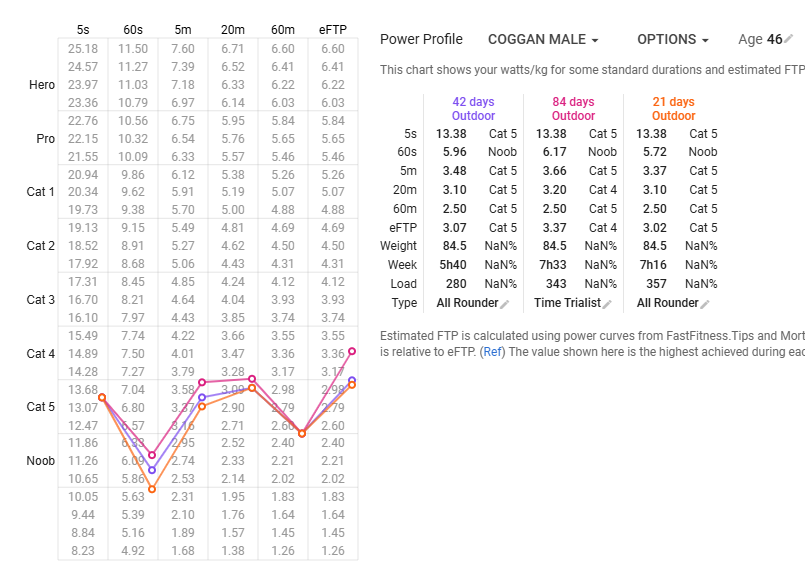
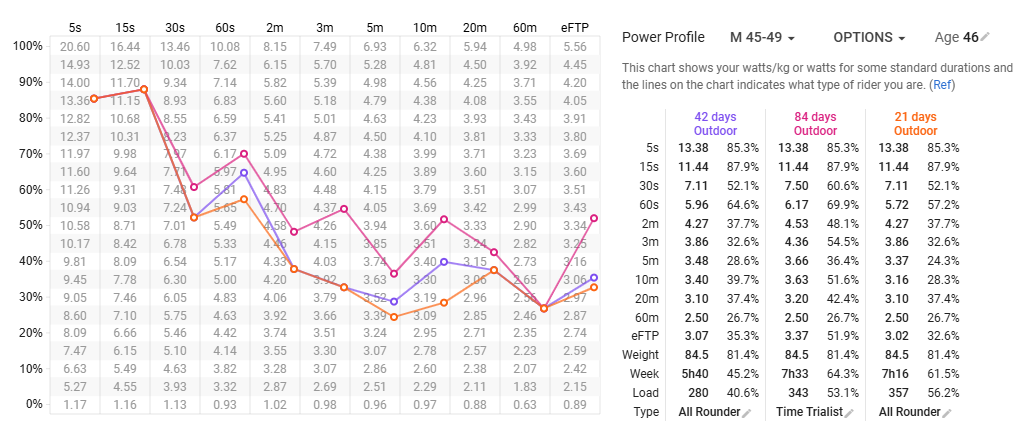
I’m trying to help myself by looking at the tables in the Power page; e.g.
From the latter table it seems that I’m good with sprints and very short efforts, less on longer durantion (this is also my feeling). But looking at the Coggan table it seems the opposite.
In some ways it depends on why you are training. If you are training a particular (type of) event, then matching your training to the nature of the event is the way to go. For track sprints, you would focus more on the shorter end of the power curve than if you are training for 100 mile time trials.
In other ways it doesn’t depend on why you are training. Broadly speaking, a rising tide raises all ships. By that I mean that a mixed training programme, based mostly on building your aerobic capacity (“Zone 2”), combined with a couple of higher intensity workouts per week that vary over time (sweetspot and above to include threshold, VO2 and sprints), will raise most parts of your power curve.
Thank you @ivegotabike
indeed, it’s a good answer. I’m training for fun, not to race. But I would like to work more on the points where I’m more weak, trying to level more my performance. That was the idea of my question, and also what Coggan was suggesting in his book.
But regardless of that, is there a way on Intervals to see in a chart how we compare to other athlets with the same phenotype?
Does the phenotype really matter if you don’t know what the other athletes are training for? How much training they do? How long they have been training for? Or… many other things.
Age group is not a bad place to start. Scroll down past the table on the power page to the graphs, you will see hours / week and load / week too. They are quite interesting measures (imo)
I would also add that the data on that table depends on whether or not you have specifically done “all out” efforts at those durations.
Take the 10 minute data as an example. Have you gone out and specifically done an all out effort for ten minutes? Or is that data merely the best 10 minutes that you happen to have done as part of a ride one day?
Does the phenotype really matter if you don’t know what the other athletes are training for?
yes and no, it’s also a good question.
As said I started from age groups, but it would be nice to be able to plot those data (interpolating a curve on the chart). Do you know if it’s possible?
I’ve not done all out efforts for all the shown durations, but I’ve done all out efforts for similar durations (eg 3 minutes, 6 minutes, 15 minutes, 20 minutes). It’s not too wrong, IMO, if my best 10 minutes effort is taken from a 15 minutes all out effort (of course it’s a little bit lower, but on longer durations the difference should not be that big). Do you agree?
Based on the data that I have given to intervals, there aren’t many other things that it knows about me that it could use to group me with other users.
What particular information about yourself have you given to intervals that you would like to use as a basis for a comparison with others?
I do generally agree that the best 10 minute section of an all out 15 minute effort is going to be sort of an OKish proxy for an all out 10 minute effort. But it isn’t going to be the same.
That said, it is also relevant how recent those best efforts are (and other things).
As you are training for fun, I don’t think you can go far wrong by focussing on the part of your power curve that you are rated as lowest percentile in your age group for. I say that partly because it is the longer durations, and working at that end of the curve will help with the shorter stuff too.
One thing I notice about your tables is that the highest power levels at most durations come from older rides (84 days outdoor rather than 42 days outdoor or 21 days outdoor).
What particular information about yourself have you given to intervals that you would like to use as a basis for a comparison with others?
Power data, age, gender - this is what I would use.
As you are training for fun, I don’t think you can go far wrong by focussing on the part of your power curve that you are rated as lowest percentile in your age group for.
This is also what I’m assuming. But why the Coggan table is so much different from the other one based on Intervals athlets? it sounds strange.
You’re right that highest power levels are old (before summer). This is because during summer I took some days off from training and started more random rides without structurated workouts (just have fun on the mountains, I’m a MTBiker). Just now I’m starting training again, but started with shorter efforts and studying how to improve the long part of the curve
I don’t know why lines on Coggan’s tables are a different shape to the intervals data set. But I expect there are people on this forum that do. Like you, I’d also be interested to learn more from them.
I did pick up from the TP page linked that Coggan puts emphasis on the importance of the numbers being the actual best effort.
“It is critical that the values used in this analysis be truly reflective of the athlete’s very best effort over that duration – otherwise, the resultant profile may be distorted, leading to inappropriate conclusions and actions.”
The Coggan chart is going to give you a good comparison of what Category cyclist you are stacking up against, based on Watts/kg. I’m not sure if that’s more or less useful than what you are asking for. The problem with ranking against “phenotype” is that the athlete has to self-identify that. I think any attempt to set this up is going the “garbage in, garbage out.” You are already looking at Watts/kg, so you are getting a little bit of what you are looking for here, vs simply Watts.
Also, the tables are different. I think the shape of the graph is just an artefact of that. The powers don’t line up in quite the same way vertically, plus you have some extra time periods in one of them.
The powers don’t line up in quite the same way vertically
I think this is the biggest issue. If they don’t align it’s not comparable.
The problem with ranking against “phenotype” is that the athlete has to self-identify that
This not exactly true. The shape of 5s / 1m / 5m should identify the phenotype (at least this is what I read on the Coggan’s book). the the line is flat you’re all rounder, if it points down you’re sprinter, etc.
But it’s true that if we mix all together 20yo athletes and 50 yo athlets it’s a mess
Do you think it’s possible / make sense to plot on the power graph (controlled by a checkbox) the power line of the group I selected? (in my case M45-49). It would be help, perhaps, to better identify weakness (that was the goal of this topic)
Ahh, you mean cycling phenotype, not body phenotype. I was thinking of the 3 body types.
Yes, if there was a way to show W/kg around what type of cyclist everyone thinks they are, I could see that being useful and less prone to bad classification.
How long have you been consistently training? Someone that has lifted weights a bunch and sporadic endurance training could end up with a power profile like that. I honestly don’t think it makes sense to think about phenotypes until you have years of training and racing under your belt.
That being said, if you do have max efforts across the PD curve as you mentioned above then your weakness is pretty clearly longer durations. If you just want to be a better overall cyclist without any particular event or goal in mind, I’d work on that. Sweetspot intervals, longer tempo rides, etc.
@John_Koch
yes, I’m a noob with cycling. I started 3 years ago, and training more seriously with PM (and 4 rides /10-11h per week) only since this January. I also feel that my weakness are on longer duration. Just this Tuesday I starder with some OverUnder, but I’ll also work with SS and longer tempo rides + lot of Z2 (but hard to be steady with MTB)
In any case showing the average power curve of our group on the chart might be very helpfull, don’t you think?
I eyeballed it quickly, and for our group (I’m in the same age group as you) the 50th percentiles fall in noob for 5s and 60s, Cat 4 for 5m and 20m and then Cat 5 for 60m. I don’t know what you can really do with that info…
at what table are you looking at? the Coggan’s table? or M45-49? in the latter for the 5s I fall on the 90th percentile (not too bad). But probably you’re looking at something else than me
I don’t know what you can really do with that info…
The idea is that where you fall in a lower percentile compared to other durations, it means that there you’re weaker than the group.
When you said “average power curve of our group” I thought you meant the average of our age group from intervals.icu vs Coggan’s chart.
Yeah I like to look at how I compare to other 40+ men, but it’s more just out of curiosity. I already know that my sprint through 1 minute is relatively lower than longer durations. I don’t think of it as a weakness though, because I’m mostly an XCM racer. I guess I think about strengths and weakness in terms of races and goals.
I understand, probably you’re a more experienced user already knowing the weakness compared to other users in your (also mine) group. But sure, of course, it makes sense to also take into account the kind of races you do. In any case for people like me, it might be interesting to know where there is “more room for improvements”.
This is also the approach of Coggan in his book: he suggest to start from the weakness points and from there try to improve them first. Of course when you improve the weakness points you also do general work that improve other points not weak. But my point was “where to focus”.
I feel that I’m weaker on long durations, and this is where I’ll start from this year.
But long story short: having the curve of our age group on our power chart can make sense
I’m not sure the curve is needed. The percentages do the job, don’t they?
If you are at the 50% mark on the table for a particular duration, then there about as many producing more power than you as there are producing less power than you.
In the male 45-49 dataset (at the time of writing), that is based on n=7738
That doesn’t really help for the reasons I have mentioned previously.
Another way you could look for comparables data is strava. Pick out a strava segment on a route you ride and filter the leaderboard by your weight and age group.
Even though you are training for fun, your interest in the numbers indicates that you are interested in improving your performance and, as Coggan says, “train for performance.” Look up his anecdote about the time he had his highest ever VO2 numbers, but got soundly beaten in the state time trial championship.
As a veteran racer in a local club lamented to me a while back. “I’ve still got a cracking sprint, but my trouble these days is that I get dropped by the bunch about 5 miles before the sprint starts!”
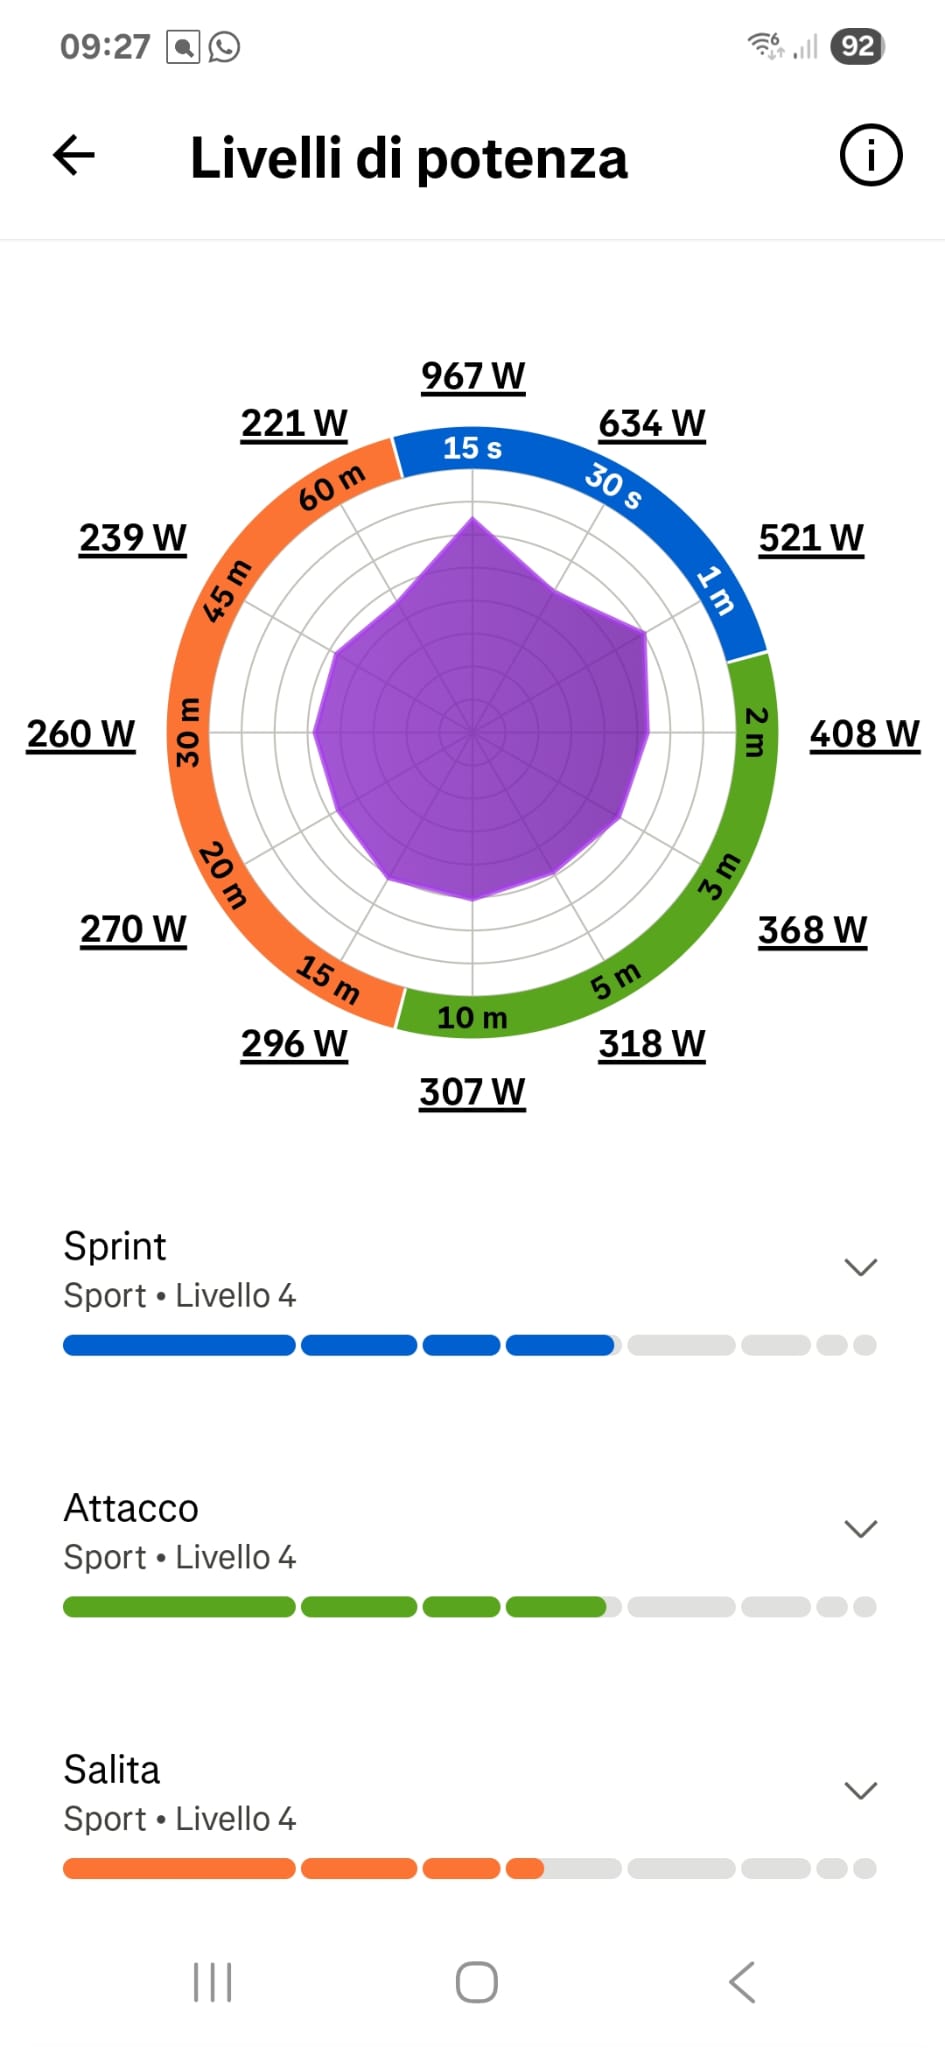
This morning I received a newsletter from Strava about Power Skills chart, this is more or less what I was asking here. A nice comparison against the same group. I’ve this in Strava for me: