Hello,
I would have like to add either my FTP or an eFTP to this chart to help me see how I have ridden above or below my functional threshold. Does somebody know how I can achieve that?
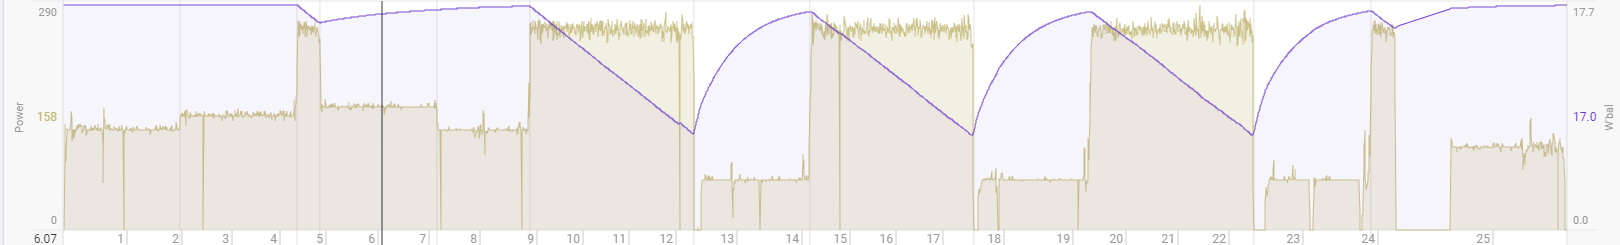
And also, how can the x axis be changed to either distance (as current is) to time? I changed it to distance through pure luck