I have started to try to incorporate some longer runs / bike rides into my training.
But how do you actually know they work? Which metrics will say most about whether the work with long duration has a positive impact?
Is it HRV and resting HR?
Is there some kind of plot that you can make that will give en indication on improvements on the aerobic engine and what contributes most to the improvements?
1 Like
Power:HR, Efficiency Factor, Decoupling - all metrics you will ideally see improve during long rides directly (don’t know for runs).
You may see additional improvements in other areas from incorporating longer rides including greater fatigue resistance.
Resting HR may go down (but this can be from generally getting more aerobically fit, or tired), but HRV isn’t something to look at with regards to improvements - rather it can be used as a measure of how “in balance” you are generally during your training
1 Like
@Olly_Thomas On the fitness graph page, do you include any graphs that gives you a picture of this?
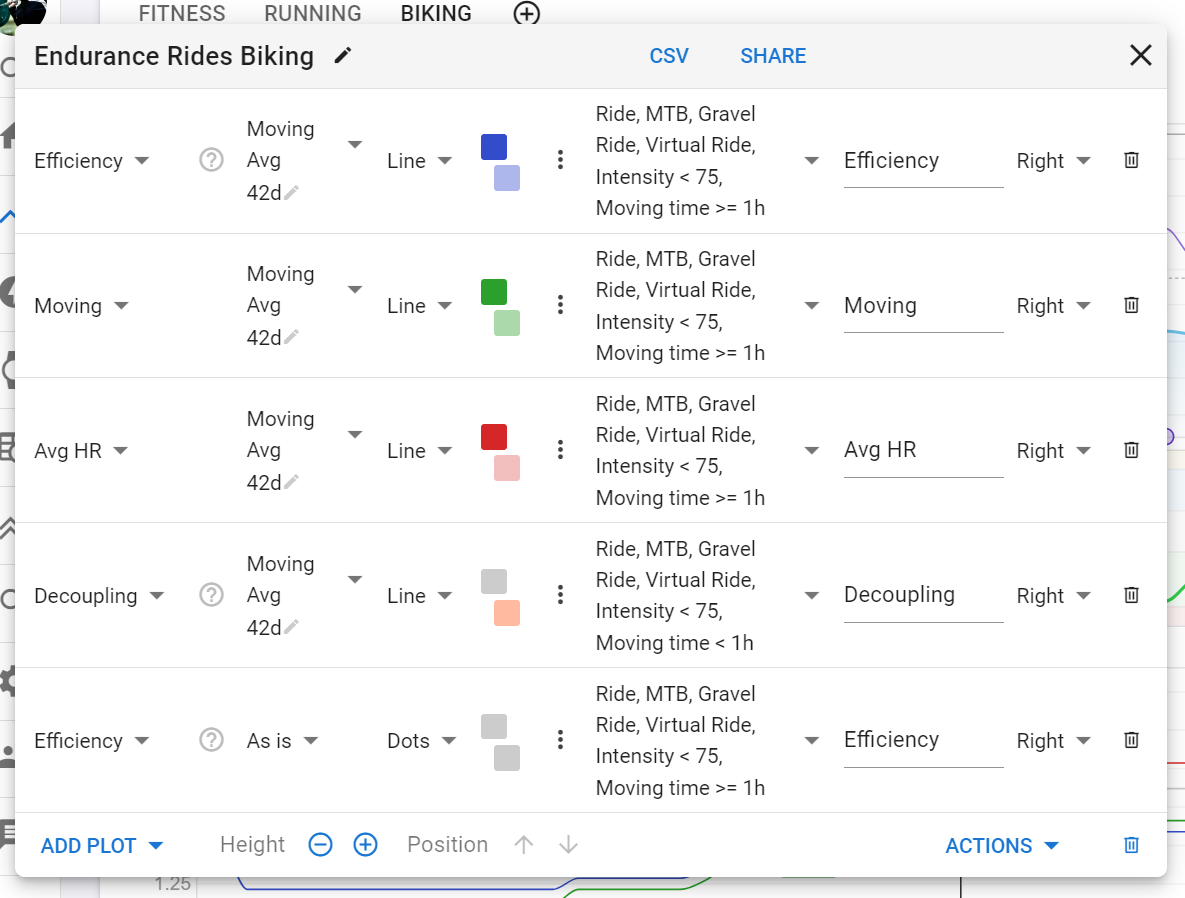
Yes, I do - for example, this one tracks my endurance rides and the metrics I noted above…
- Average HR trending down
- Efficiency trending upward
- Ride length increasing
- Decoupling trending upward inline with rides getting longer but then dropping as adapting to increase riding length
5 Likes
Thanks. I tried this for only my bike rides:
Giving me this chart:
As far as I can tell, the numbers are moving in the right direction for that training period.
1 Like
Power/hr z2 graph and trend
For some athletes with a power meter, who can’t measure/use all metrics:
- RPE might be lower for the same effort.
- Speed might be up for a similar segment under similar conditions.