You can now control the number of weather points displayed on the map. Just drag the slider. There is also a screenshot button and start and end markers.
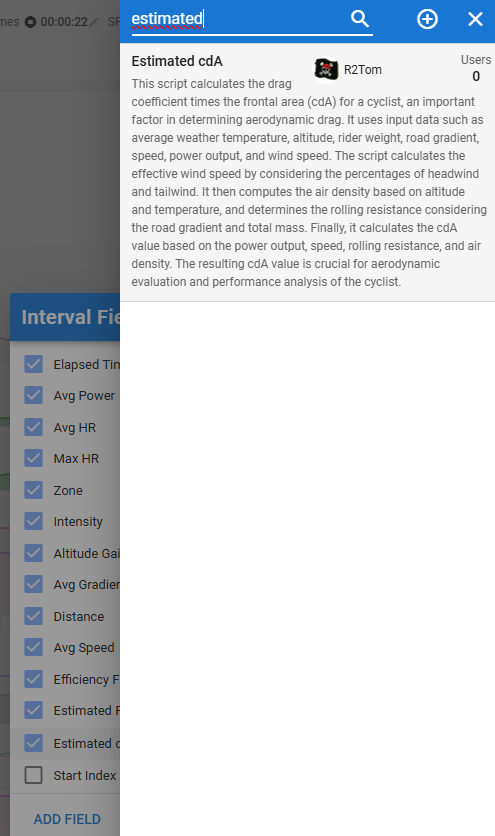
I introduced a new interval field called “Estimated cdA” and gave it an initial test run for some of my rides. At first glance, it seems to produce reasonable values for steady efforts. Feel free to give it a try and see how it works for you.
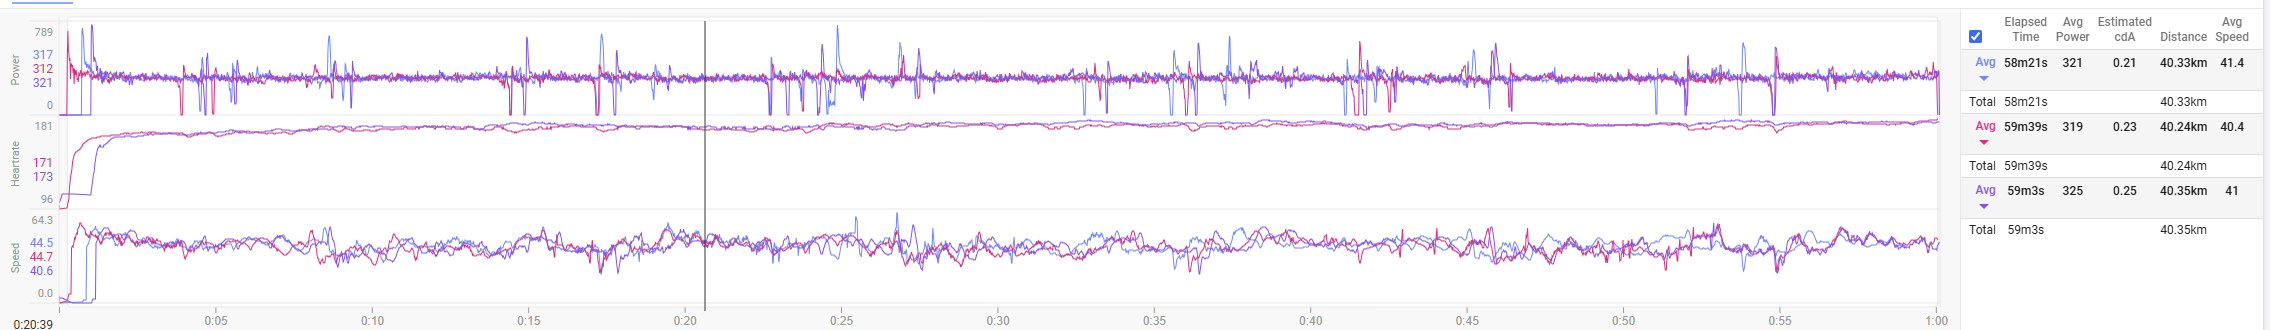
This is fantastic! Thank you very much for spending time developing this. I have tested it by comparing 3 road bike 40km TTs (on the same course) over the last 2 years where I had similar power but increased speed in each of them (based on some bike fit changes I made) and this is reflected in the CdA calc. Excellent!
Regardless of how ‘accurate’ the algorithm is, it creates a baseline to judge against so its well worth using for me I think. Thank you again!