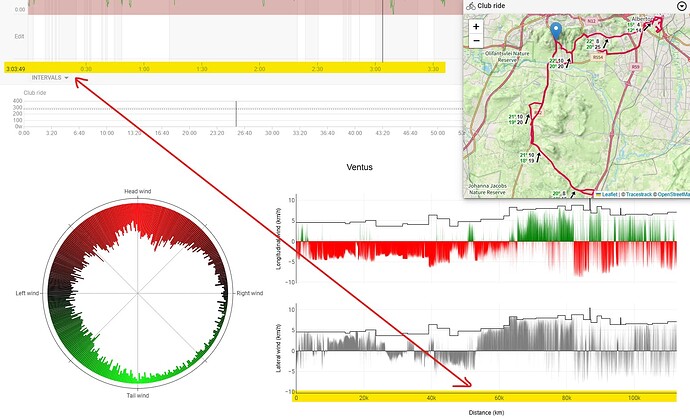
Apologies. Yes I think so. I didn’t read your post properly. And the lateral will be what we call cross wind effect.
No worries. It’s good to know it matches something else out there
Those charts look neat. I missed your original post about it.
It’s a nice app, especially for someone that likes to use the wind in a race, or needing to be aware of the direction when race direction changes (gutters).
However it’s not always correct, specifically when conditions change. The system doesn’t update immediately. I had that happen on a few rides in December in the Overberg region. Data shows a tailwind, but the wind turned (NE became a SSE).
@david
Not related to the wind discussion, but picked up when comparing the wind data.
Can the x-axis on the activty page be changed between duration and distance?
If not, is this a possibility?
Ventus and other similar apps are not measuring actual wind conditions, but they get the information from different weather services that use models.
Depending on the accuracy of the selected model in your location, you could find some discrepancies with reality.
Usually, they work fine for steady conditions, but it is true that when weather varies suddenly models could provide outdated information
yeah I would imagine none of the models can take into account wind bouncing off a cliff face next to you and you feeling the effect from a different direction.
I’m just thinking of a coastal race I do where offshore wind comes from one direction, but as the road curves the wind bounces off the cliff face and now its hitting you from a different direction.
Tricky to do but not impossible.
I realize dragging over the graph will show the direction of travel, but with just an image of the map (say, a shared screenshot), you can’t tell the direction of travel. Could you create an option to show periodic direction arrows on the GPS track?
Yes I will do that.
I have added apparent wind and yaw angle streams.
A great addition, thanks!
Would it be possible to include the time (and maybe date) in the detailed weather info? Are you showing the data for the same time for all points (and what time is then chosen), or are the data for the actual time when we pass through that point? Whatever it is, mentioning the time would take away any doubt.
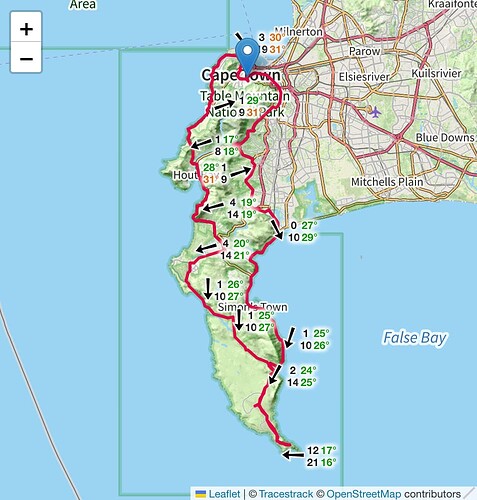
I have added that to the popup. It shows data for the time for the marker position if the marker is close enough, at 15 minute intervals. So as you mouse over the activity timeline chart and the marker moves at least the 3 forecast points closest to the marker will update to match the time at the marker.
I have added weather summary info to the activity summary panel:
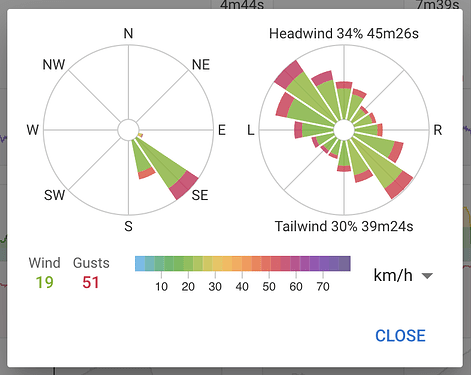
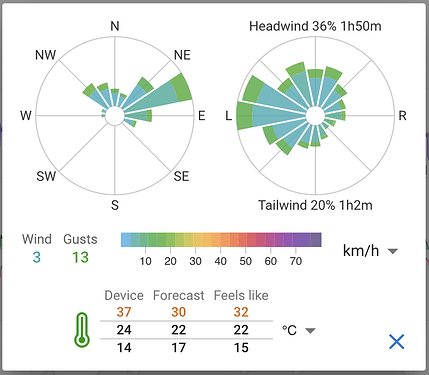
Clicking this displays a popup with more detailed information:
The arrow length on the wind rose plots is proportional to the percentage of moving time that the wind was blowing from that direction for. I am going to be adding temperature info to the popup.
Activities that do not have weather info are displayed like this:
Click the icon or re-analyse the activity to compute weather info.
I have also added a number of weather related activity fields that can be displayed on the activity list view:
- Min Temp: Min temperature
- Max Temp: Max temperature
- Avg Forecast Temp: Average forecast temperature
- Min Forecast Temp: Min forecast temperature
- Max Forecast Temp: Max forecast temperature
- Avg Feels Like: Average forecast feels like temp
- Min Feels Like: Min forecast feels like temp
- Max Feels Like: Max forecast feels like temp
- Avg Wind Spd: Average wind speed
- Avg Wind Gust: Average wind gust
- Prevailing Wind: Prevailing wind direction
This is awesome. If I ever go back into the air traffic world to do met analysis I’m giving you a call ![]()
Yet another very nice functionality implemented in a clever way!
In DC Rainmaker’s post regarding IndieVelo, we could read about a very heavy boat difficult to change it’s heading (TrainingPeaks). Intervals is a top performance F1 speedboot compared to it ![]()
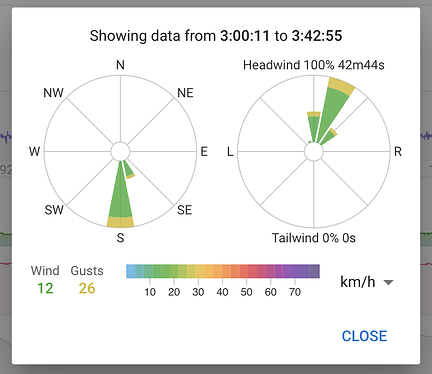
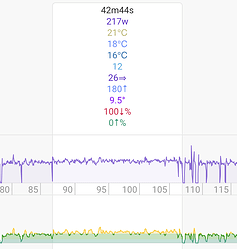
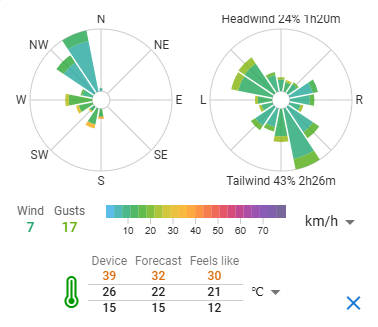
The wind/weather popup now displays info for the currently visible portion of the chart. So you can zoom to an interval or whatever and see what the wind was like:
I have added a bunch of weather related stats to intervals. You need to re-analyse existing activities to see these:
- Average temp (from device)
- Average forecast temp
- Average feels like (from forecast)
- Average wind speed
- Average wind gusts
- Prevailing wind (most popular wind direction from 16 compass point buckets)
- Headwind % (percent of moving time with a headwind)
- Tailwind % (percent of moving time with a tailwind)
- Yaw angle
Each activity now also has headwind % and tailwind % fields.
Are those current conditions, or old,like mine from a couple weeks ago?
Now we have wind data alongside all the other metrics for a interval/ segment/ etc, who is going to see if we can make a custom field to calculate CdA? ![]()
Thanks! Absolutely amazing, and more than I ever could have thought of.
