Now, for me this does not work:-O I fear, it is the same problem as with ner features before, some kind of caching… I force reloaded pages and also completely restarted the browser, but it does not work for me (yet).
On the settings page, it says “version 2024-09-26 10:47:28”.
This is on Safari 18.0 on macOS.
What’s the appropriate way to get i.icu updates in place with Safari – short of clearing all cache which I do not want to do.
But then it is not really a histogram anymore. Guess you are looking for a simple bar chart … but histograms are, in general, much more useful (although maybe not for gear usage;-)
Hmm, this does not work for me:-o
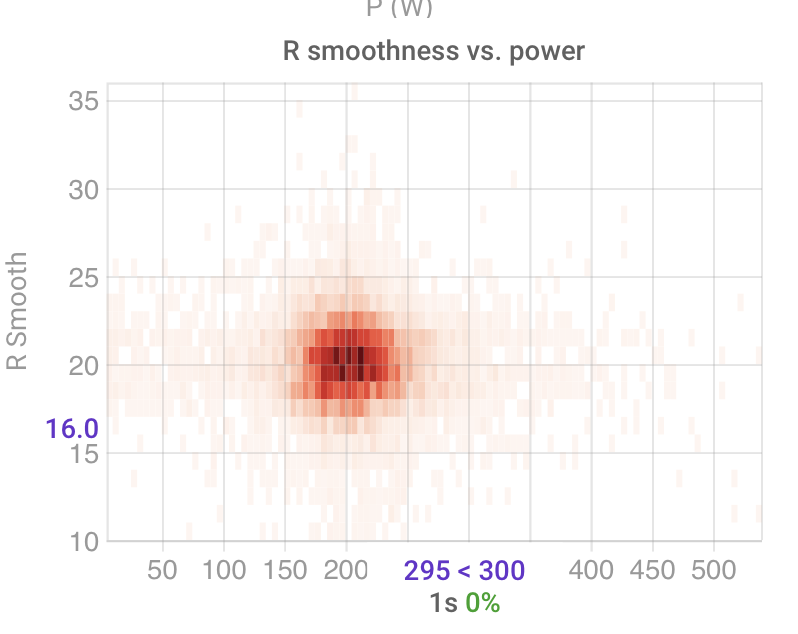
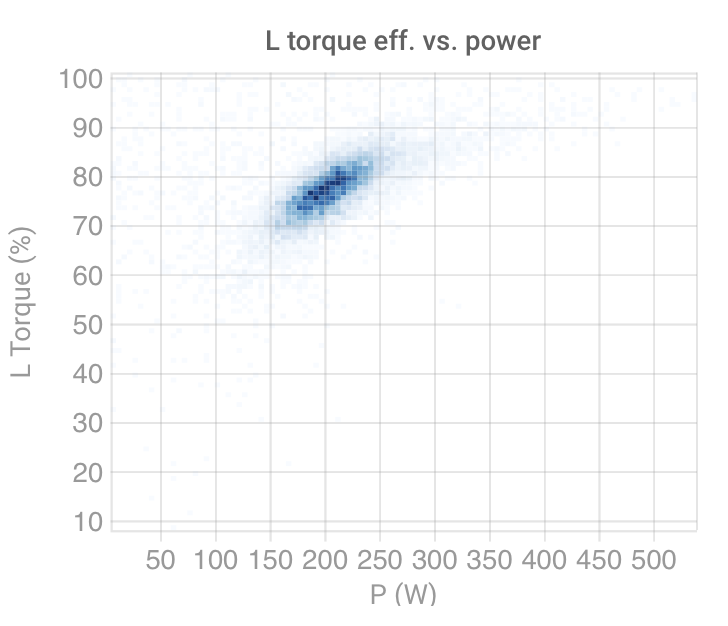
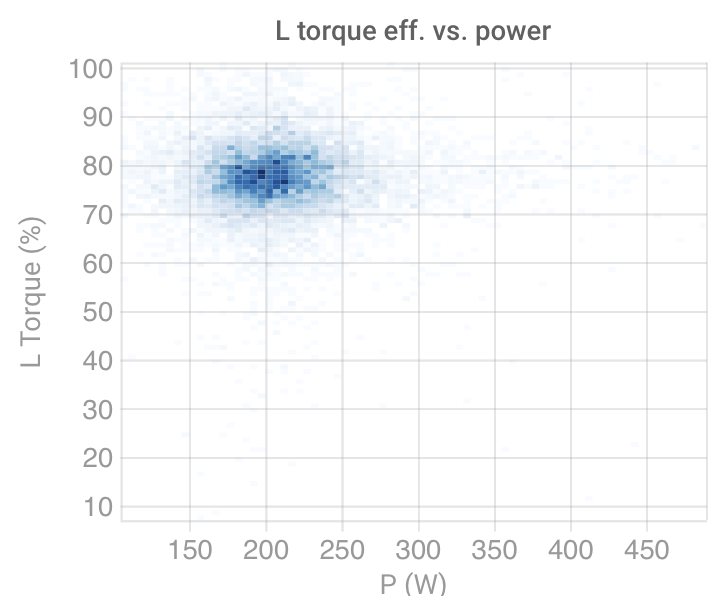
All my TE and PS histograms, for instance, show “strange” custom axes related to the range of data present, not the axis range [min, max] I specify.
I originally thought it was a “version update” issue anymore, but by now – running 2024-09-27 14:01:18 – this should not be the case anymore.
Also, the histograms really change when I set ranges – this one is correct when the power axis is on auto–auto, but when wrong when I restrict it, for instance, to 100–500 w (see how the tilt in the signal cloud is lost)
Aha. I only implemented the axis range locking for the histograms, not the heat maps. I have now done it for heat maps. I have also fixed the bug that caused the “tilt” to be lost on that chart with the power axis was restricted. Tx for all the detailed info.
I would like to create a histogramchart that shows three “buckets” based on LT1, LT2 and above => three buckets or columns. One that shows below 68.5%, one that shows from 68.5% to 86.3% and one above 86.3%.
Can someone please point me in the right direction?