I am new to intervals.icu and was wondering if someone can help me interpret my data. Trying to understand if I’m improving, worsening, or hanging steady. I did 1200 miles on the bike from 8/5/24 to 12/31/24 and then moved to Zwift mostly for the last 4 weeks.
Welcome to the world of data and you’ve chosen a great app that’s visualised for easier consumption.
I’m not an expert just been using these types of platforms for a while. Basically this is a platform that allows you to preset your work outs (whether it just be a load metric or include focused intervals,zone1,2 etc., as well), and collect your recorded activities to do comparisons or just use the latter to track your progress.
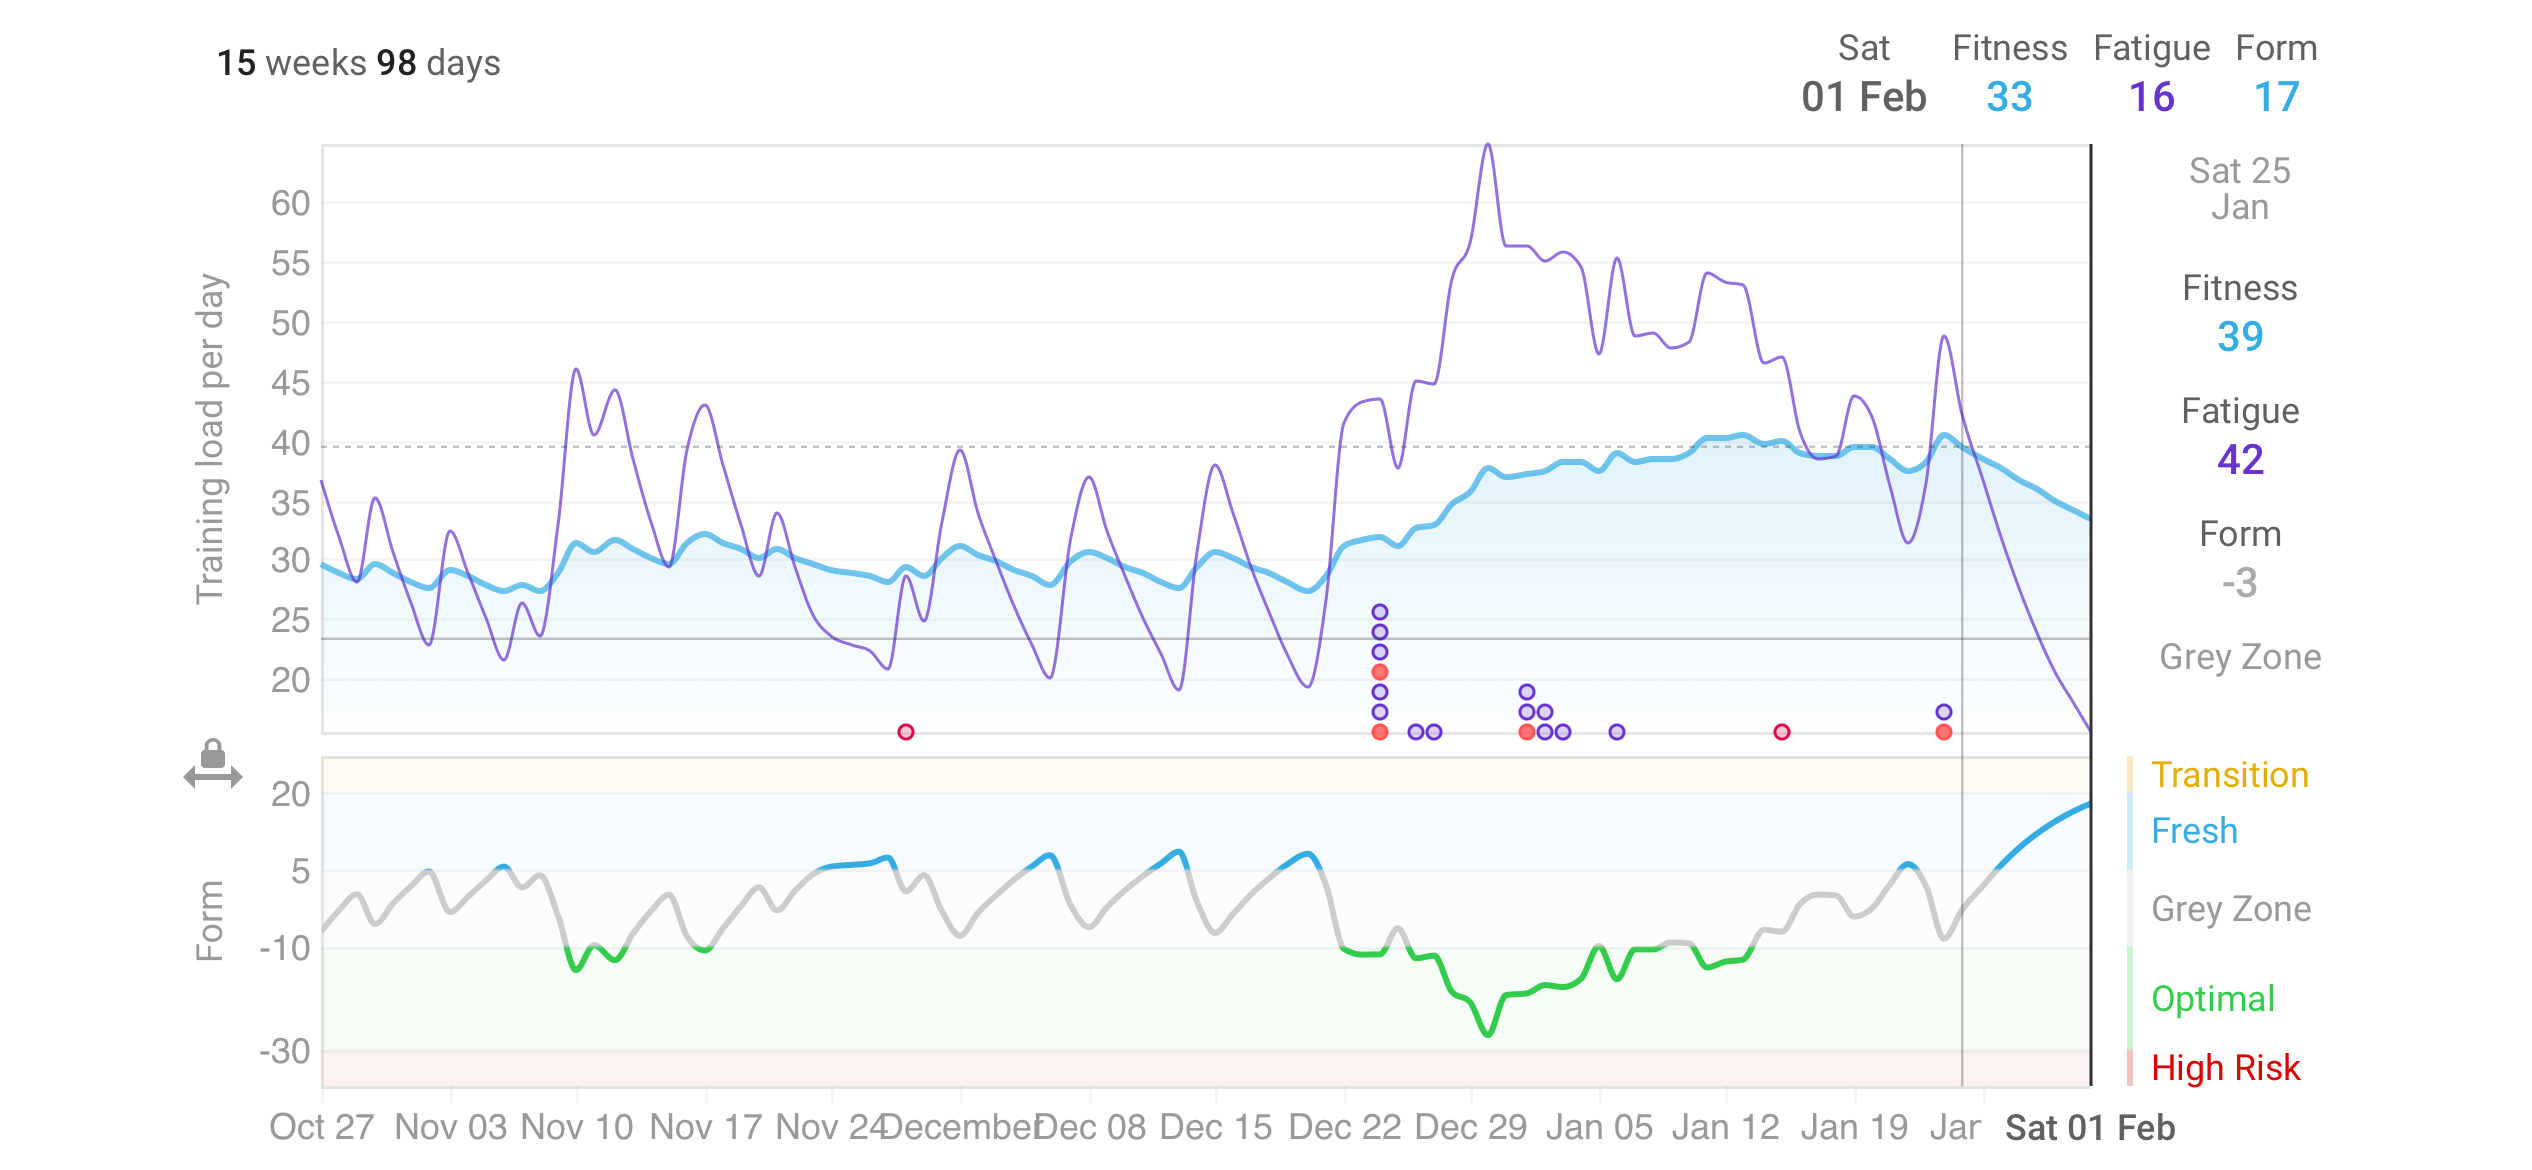
So the blue is your fitness, this you want to keep it trending in a positive direction. Expect a brief period between training blocks or pre-events from rest periods. The purple is your fatigue. I find this graph is helpful when you want to see what things had what effect on your fitness or fatigue. You can add sickness “workouts” that works on a date range and asks if you want it reflected on this graph. - What influences Fitness, Fatigue and Form
The form graph (which works on your fitness minus your fatigue) is probably the more easier to guage graph as you want to keep the line in the green strip, with drops into the red when you are doing high intesity weeks, but shuldn’t be for long periods. So it may be a workout or a week or a block depending what type of training dicipline you are focusing on, but shouldn’t be dramatic dips into the red. - I need help interpreting fitness/form graphs
Since you have zwift, perhaps try the plans in intervals and you can see how the planned fitness and fatigue changes against what you manage to complete.
Personally, I think that these metrics are best used if you have a particular other target in mind. Are you trying to increase you endurance? Or peak power? Or just generally trying to get more fit?
In each of the cases you can use your training load per day and form to make informed decisions about where you can most improved. My “Compare” tab is filled with graphs to track my more important metrics, such as running pace, distance covered, ride time, power, weight. I see the Fitness/CTL more as a way of pacing as well as motivating myself.