Hi, as everyone mentions, thanks for the great software, and your swift releases of new features.
Recently I started doing more steady rides, where I try to stay in Powerzone 2, in order to build on my base.
However, when I start of slowly, often I see that my heartrate stays more in HR zone 1.
When I trie to get my HR in zone 2, my Power goes up to zone 3.
I wonder which zone (HR or Power) provoques the desired adaptations for longer steady rides. I know Power is King for intervals.
So, feature request :
In the activity page you already have a 30s power chart with colors.
Is it possible to have a chart somewhere bigger where the left and right axis show the Power or HR zone, with the colors showing in the whole chart as background (kind of like the form chart), and have the 30s heartrate (red) and 30s Power (blue) as two lines traveling their respective zones ?
In that way we can see when both zones match, or when they are way off, which might indicate overtraining, a need for a new FTP test, sickness on the way, …?
Tx. Thats an interesting idea. You can see some of that at the bottom of the activity power page in the long Sieler inspired decoupling chart. You can also look at time in zones for power and HR for the ride and compare. The totals page will do this if you select a single day.
But your chart idea would be quite neat. I have added it to the todo list.
It would suffice to add an option to the Sieler inspired decoupling chart, where you can change the left and right Y-axis to show zone 1 thru 7, with a smaller portion for zones 6 and 7 maybe.
Add the colors of the zones to the background, and it would be perfect.
And maybe another lines in the headline of a activity charts for the HR. So it will be easy to compare the zones and % for power and HR for each segments. coloring the segments?
I’m sure I’ve heart SS say use heart for low intensity stuff… which makes sense as your trying not to tax your body. A low zone power with moderate HR would indicate you are taxing the body, meaning you should drop the power to get the heart in line with Z1(pol).
I was in the same situation, riding a lot of Z2 by power but seeing only Z1 by HR in total chart.
There is a difference in HR zone ranges between Friel and Coggan. Intervals.icu is using Friel as standard (maybe @david can add Coggan zones?) At the end i switched to Coggan (you can enter them manualy) and HR Zones are more or less overlapping with Power. But at the same time I decided to ride by power even easy rides. A lot of Tempo rides is easy way to overtrain so rising power to HR zones is risky. The HR Zones are arbitrary and power is more objective (more or less). The real solution would be to test for LT1 and set the real treshold between Z2 and Z3 (Z3 is defined as a zone where lactate starts appearing so you can test for it). But it changes in time, you can’t test at home and only new problems with it.
PS. There is a new thing derived from HRV, (google DFA alpha 1) Maybe in the future you could ramp test for LT1 with a HR strap and an app logging RR intervals. For now hard to tell. With polar strap you can try. Ther are android and iphone apps. But i think results are kind of mixed at best.
A pretty good solution is to not only test once for DFA-a1, but to use it on most of your endurance rides. Seiler’s Z1 (HR below VT1 - estimated by a1 > 0.75) typically extends to the lower end of Coggan Z3. For me this is about 78-80% FTP but can vary somewhat day by day. Which in the end is logical because you have better and worse days. The same goes when basing on FTP, your FTP isn’t stable from day to day. So I ride endurance based on a1>0.8.
LT2 is less of a problem because you don’t have to take it literally. When Seiler means a HARD workout, it can also be a Threshold or over-under where you go to (almost) failure. It’s not only above 105%FTP.
I start my hard workouts at an intensity derived from the PDC and adjust intensity to make them really hard.
In the end, I use FTP almost only to keep my numbers for Fitness, Fatigue and Form in line to correctly determine TSS. Estimation from Xert - What’s my FTP, Garmin Edge and/or Intervals.icu. The burden of regular testing is completely over for me…
I do miss a clearer everyday wording on this regard after this “polarized” polarization .
I mean usually articles leave the understanding of zones as power but sometimes it was about HR…
I face the same problem of riding up to HRZ2 and even HRZ1 and get a lot of PZ3 and even PZ4 and I’m sure my LTHR and FTP are good due to results on indoors PZ5 intervals as well some outdoors HRZ4 long steady effort’s I’ve done.
My point is despite I believe to be doing a polarized (HR TID) I get Intervals rating as something else, piramidal most of the time because is based on power. I know.
Every place ( TR, FFTT, TP, Trainerday, etc…) talks only power and a lot of people, including myself, is after zones and TID based or at least considering on HR …
Problem is we have to keep converting things all the time.
What configuration do you use? (what app, what HR strap) Is it working? Did you do lab test to confirm? I checked the papers a little and a1 > 0.75 is a theoretical approach. Would be interesting to compare your real ride results with a lab test to be 100% sure.
Agree. The real problem is with over/under intervals. With wrong lt2 they can be useless (instead of being over/unders they are only over or only under) But I think a small diffrence in power during SST or FTP intervals is less risky than many hours spent in Z3 instead of Z2 with wrong HR zones or a wrong LT1.
If you can stick to power i would ride by power and eventualy check HR for decoupling. If your trainer is your only power source i would be careful. HR indoors is hugely impacted by your cooling ability and your fans. You can’t convert indoors HR and Power to outrdoors 1:1.
What I’ve said that I’m ok with my LTHR based on long steady outdoor rides, let’s say it would be X.
If I take X and apply it to the known zones I will end up with Y HRZ1 and Z HRZ2 and when performing rides at these levels the result (for me) will not be at PZ1 and PZ2 but higher (even being indoor with expected lower power numbers to the same HR due to what you’ve mentioned).
My doubt it is not that but other:
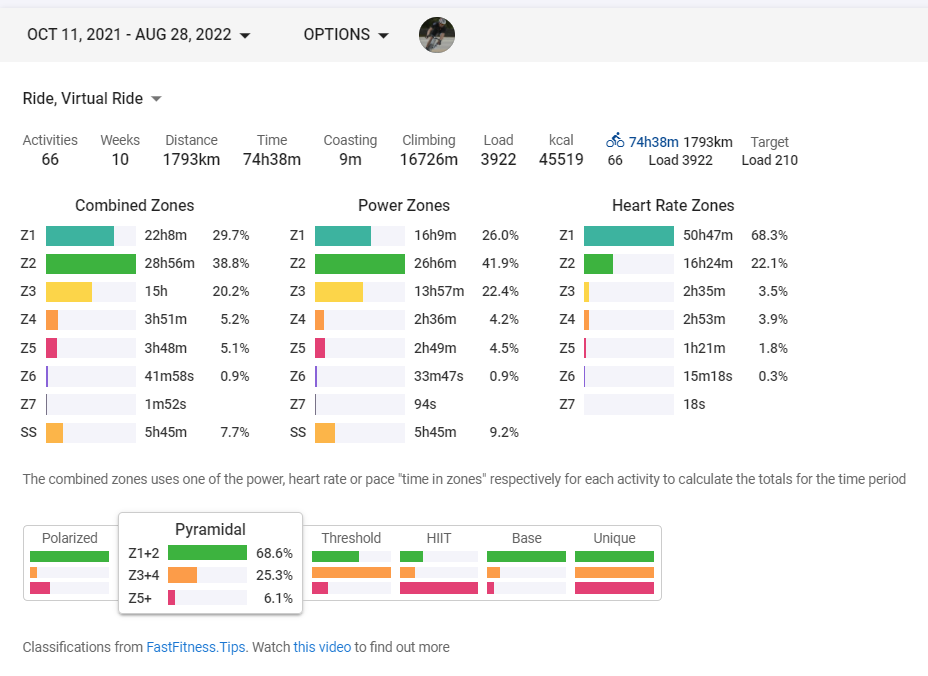
Bellow you find my current season.
AFAIK, the classification at the bottom of the image is based on POWER TID (@david ?), but isn’t “polarized talking” all about HR? VT1, L1, dFA1/HRV, max 70% maxHR, etc, …?
That is my doubt.
Everything I read (papers, articles, etc) about polarized training is HR related nonetheless all training plans, workouts, classifications/ratings etc we find is TID Power based.
So far “my power season” is toward PZ2/PZ3 while my hr season is toward HRZ1/HRZ2 being massive HRZ1, so my understanding is that I’m doing a polarized training (80+% HRZ1+HZ2) but the classification showed is for Pyramidal…
Fatmaxxer with Polar H10 and yes it is working but… it’s easy to mess up. You need a measurement with as little artefacts as possible. A couple weeks ago, I saw a huge number of artefacts and I didn’t know why. Changed the battery in the chest strap, rebooted phone, pulled the strap a bit tighter, all to no effect. Untill I realized that I had opened the strap just a day before, to wash it out a bit better then what I usually do under the shower. So I put the Polar back on and fired up Kubios, which I use for morning HRV. Set it in ECG mode and checked the signal from the Polar. It was ok in resting position but plenty of artefacts when taking a deeper breath. The strap was too tight, making it move a lot during deeper breathing. I found out that the best way to adjust the strap is to first breath out as much as possible and then adjusting the strap with just enough tension to keep it in place. After doing that, rock steady ECG even whith maximal breaths and jumping around. And only a couple artefacts on Fatmaxxer during endurance riding.
Other things to consider: dfa-a1 isn’t rock stable by nature. It is ok to have a few brief drops and you shouldn’t change intensity when seeing that. As an example, when you get out of the saddle, HR goes up a couple of beats and a1 reacts even more. When you have to burp, HR immediately lowers a couple of beats and a1 also reflects that change. But you have to look at it for longer periods of time at steady state and then it realy reflects that steady state. In Base period you see a1 rising before you see a significant effect on EF.
I can’t compare with a recent lab test because I haven’t done one for over 4 years. But former lab tests (gas exchange and ECG monitored/no lactate) came up with an LT1 that was 2-5 beats higher. Being a bit older now and recently having had a Thyroid lobectomie, that totally makes sense. My resting HR dropped almost 10 beats right after I had the surgery. When COVID finally settles down, I’ll probably have another Gas Exchange test because I’m usualy asked to perform it when physiotherapists and pulmonologists come over for a congress at our company. That’s normally every year but given the circumstances…
LT2 can’t be a problem. If you do a workout designed for that type of intensity and you are able to finish the workout and feeling almost completely wasted, I’m pretty sure the target was perfect. My favorite over under is 3*(4*2m@105%+1m@90% - R 4m@50%).
So for me it is HR and a1 for endurance, PDC and RPE for HIT.
I wouldn’t use dfa-a1 for LT2 though. That seems far less accurate.
The classification is based on all your activities. Those with Power data as is and those without Power are counted, based on HR, hence the “Combined zones”.
Polarized is more based on a principle: if you do HIT, do it as intended! To be able to do those demanding HIT sessions, you have to do the rest at a low and much less taxing intensity. That low intensity turns out to be LT1 (VT1, AeT all not exactly the same but close). By doing testing protocols, you can transfer the LT1 to a Power intensity. But that means you have to retest when your fitness changes. So it is actually easier to use HR. But only for steady state efforts. The lag in HR makes up for a big part of the differences between Power and HR zone based results.
In your case though, the difference is really big. Your Z3 Power time is almost the same as your Z2 HR time. You may be better of using customized HR zones based on a couple of tests with steady power.
And what every one seems to miss about polarized, is that a hard session isn’t necessarily a VO2max or Anaerobic session. ANY session that gets you close to your limit, is considered a hard one. What you need to avoid, is the constant medium efforts that neither target the high nor the low energy systems of your body. They only accumulate fatigue.
I’m very familiar of polarized having no doubts on the execution and per several scientific papers already published about it and all being around HR I’d say is more than only a principle.
I was being generalist in the sense of having a comum understanding of wording, terms and concepts because what I see is a mix.
It is basicaly impossible to do workouts with intensities above 110%-120% correctly based on HR. Common sense is to use power for those. I understand what you say about Polarized being more focussed on HR, but from a practical pov, it’s way easier to use HR for longer steady state and power for intervals shorter then 12 - 8 min. Set up your starting power targets for those based on the PDC and if analysis afterwards shows you that the HR target wasn’t hit, increase or decrease as necessary.
All different forms of training systems have good to very good insights. It’s up to us to combine those to a system that works for our specific use case. There will never be one system working for everybody but the basic stuff should be at least a good starting point for anyone.
But my point is that all papers, studies, presentations, etc are all about the “result” of HR TID even if you have used power as mean to achieve that. HR is the outcome of the power income.
Not saying the mixed classification isn’t of any help but that would be optional in order to facilitate the ones that would like to have a pure HR classification to compare apples with apples. The beauty of apps is that you don’t have to keep parallel records and perform your on calculations .
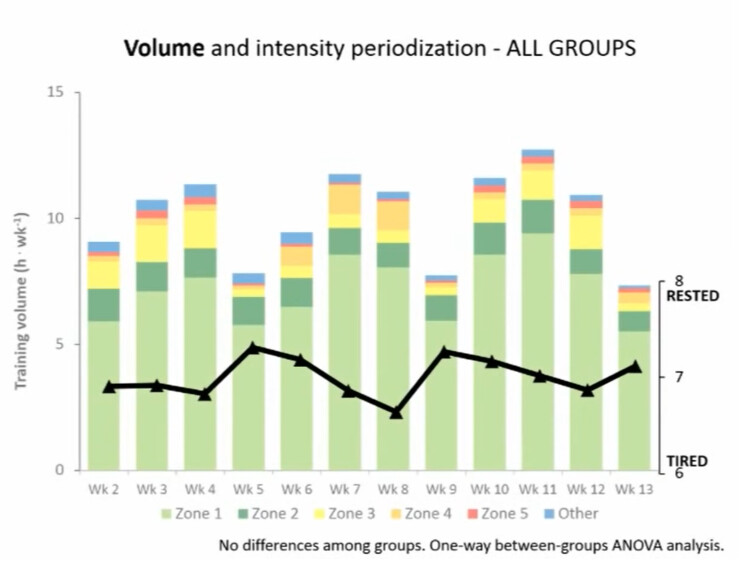
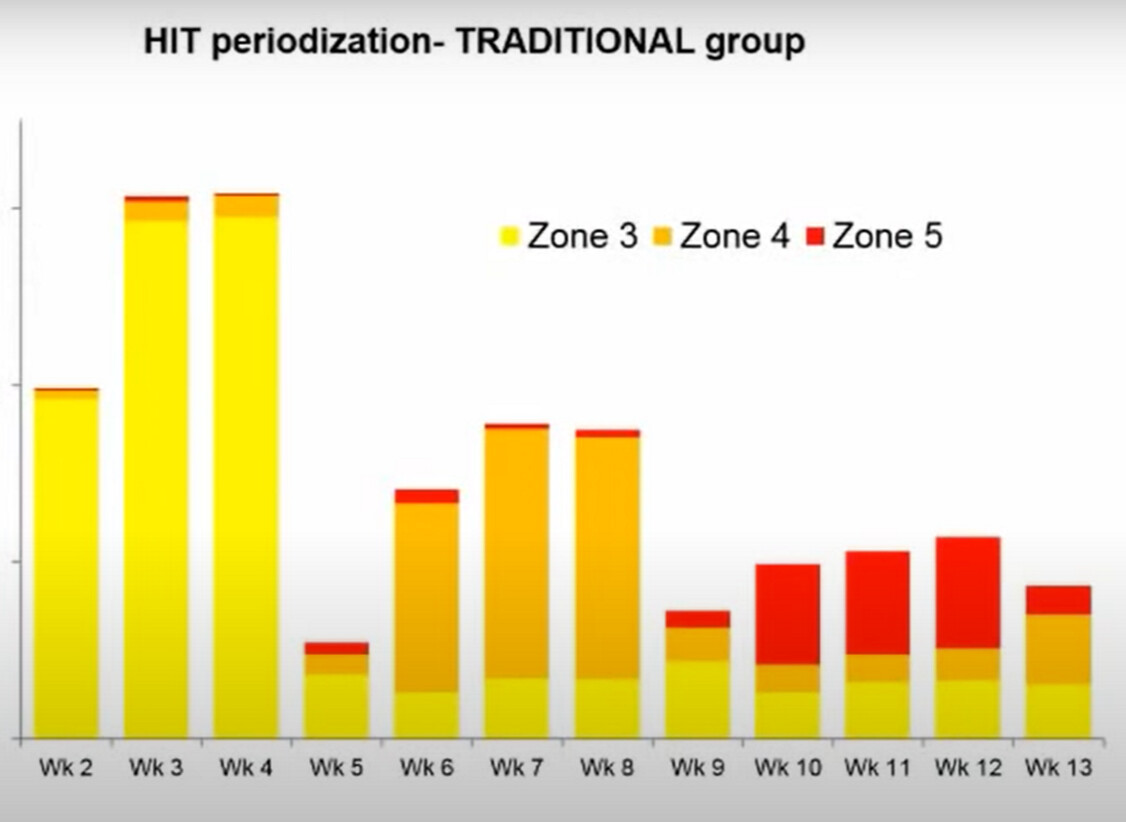
e.g.: take the charts bellow from Seiler’s and I ask: Not about the values but wording, which type of zones are they referring to? a: HR
My point is not about using power, HR or any in the “execution to perform workouts” but to have a common understanding of what we are looking at after to be able to judge what kind of training I’m doing. Polarized can be applied to many metrics but imho polarized as in “polarized training” implicit is all about pure HR as an outcome.
Only looking at HR to judge the training done, will make you miss short efforts. There’s no way around this. If you do one short hard effort, power will capture it but HR will not because it didn’t have the time to get to the zone were it would normally be for a longer sustained effort at that intensity. Thus you would be working with inaccurate data.
This is only true for efforts that are long enough to get your HR to a stable value representing the power zone you were doing. The shorter your efforts, the bigger the discrepancies.
5-10% of your volume at HIT when using HR only could easily become 15-20% power-wise this way. So I’m really sceptical…
Maybe you should drop a question to Seiler on Twitter. He’s very responsive.
The question would have to be about how to execute workouts if based on power or HR and not about the studies that where done solely ou HR TID of those same workouts.
Sure having 5% of POLARIZED HR TID Z3 would b en easily be due much more than that when looking at power. And that is the hole point.
Nonetheless I would appreciate any reference to polarized power zones because I’ve only seen HR ones.
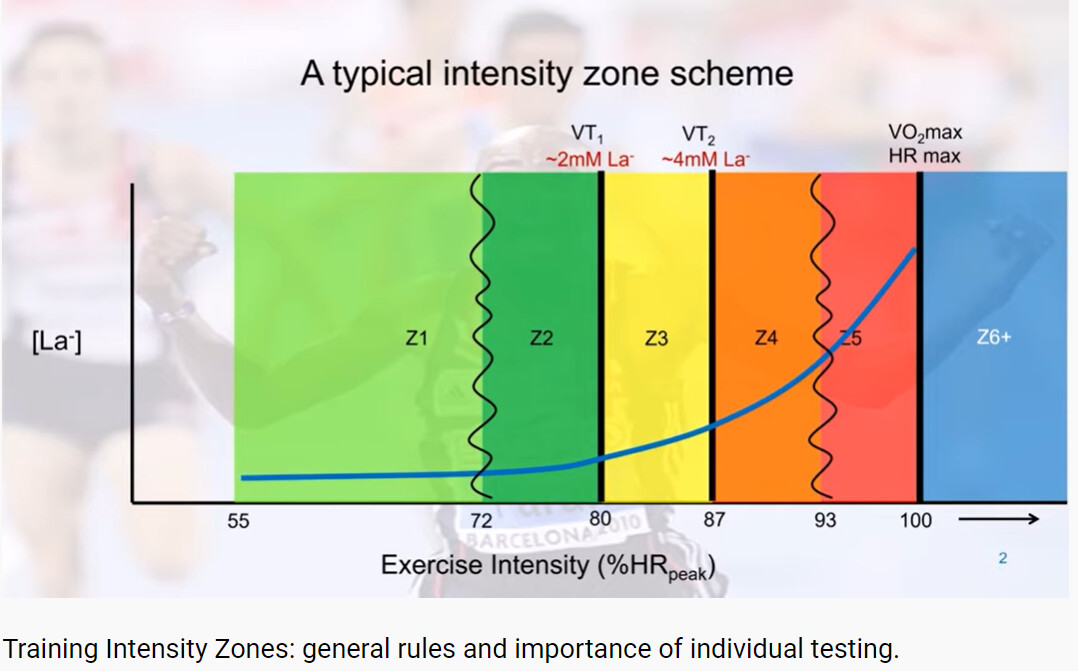
The origin of Seiler’s zones are physiological anchor points namely VT1 (closely related to AeT, LT1 ), VT2 (AT, LT2, FTP) and VO2max (6min max Power).
To make those usable in day to day training, they are transposed to HR values and/or Power values.
Have a look at his YouTube channel, specifically this one: https://www.youtube.com/watch?v=NPwyk9B0j-s
I’m so glad you brought that up because the video only talks about HR and lactate threshold and that the goal would be to have a common language which is exactly what I’m try to say in here.
The only mention to power is at 2:21 https://youtu.be/NPwyk9B0j-s?t=141 where he says he would have to add Z6 and HR would give space for power (anaerobic capacity training).
The whole presentation was made on the chart bellow which doesn’t even include power.
No to mention that in the video he most mention cross country skiers which don’t work with power.
 .
.