Yes, and that’s what is making you deduct the wrong conclusion…
He studied all kind of athletes and different sports for over 2 decades. The obvious thing to do for statistics was to use HR because it is the only metric that has been widely used over that period of time and within different sports. For the kind of papers he worked on, you need yearlong statistics with similar sources.
Check the answer to the fifth question in this video: https://www.youtube.com/watch?v=StnxjISyeWg
Or one of the videos where he talks about the training of his daughter. Her training zones are Pace zone based (but once again coupled as closely as possible with the physiological parameters)
It is all so obvious but for some strange reason you don’t want to see it:
The anchor points are physiological. And that is the common language. Not HR as you are wrongly concluding
The best solution is to have a riding laboratory next to you to measure those
Since most people can’t afford doing the above, or it is practically impossible, you switch to something doable/affordable
So use the best tool you have available, be it a bike power meter, running power meter, running pace, grade adjusted pace, rowing power… All those are OUTPUT measurements and can be calibrated reasonably well to the physiological anchor points. This is extremely important for high intensities.
If you don’t have any of the above, you can still get around with HR. Altough being a measure of INPUT that has an important lag to Output, it has served for many years to guide athletes in their training. But they all switched to more advanced tools measuring output when they became available.
If Seiler was purely HR focussed, then why would he make a decoupling chart where Power remains constant? In that case it would make more sense to keep HR constant and talk about reduced Power.
Now I rest my case because this discussion is getting us nowhere.
It really doesn’t matter. Exactly as @MedTechCD said "the anchor points are physiological. You do a lab test where you ride a bike faster and faster or harder and harder, every minute you take a blood test and someone found out that there is some lactate in the blood. Then they discovered that there are two points: Lt1 where lactate starts appearing, Lt2 where lactate is rising rapidly.
So you now have two points in space, not a graph, line or something, just two points! You don’t have to connect them with HR or power, there is no straight connection between Lt1 and HR or Lt2 and HR. Your 170 bpm can be over Lt2 on monday and under Lt2 on friday. You can ride for month indoors without a fan so your HR will be much higher, and all your graphs will show that you train over Lt1 but unless you test it in same heat condition you actually don’t know what zone you were riding. I can climb seated by power and hr just under Lt2, but when i climb standing my power stays same under Lt2 but HR goes up by 10 over Lt2. So do i ride above or below LT2? The dependence between them is theoretical unless you test your blood you just assume. You can record color of your skin during the test and make similar assumption of skin redness vs LT2 if you like or just perceived exertion or temperature of your skin. But measuring skin redness, is hard and even harder outside while riding, temperatur would change with the temperature outside and so on. To make things simple someone connected LT1 and LT2 with HR so you can train without lab tests every week. It’s more prone to mistakes, you often ride on different side of LT, but it’s mostly for amateurs and beginning pros, not elite, that makes it safe for us. We are not riding on the edge of ours training stress so even if we stay above LT1 for longer than we think, we don’t risk being overtrained, and we can always take bigger margin at the end it’s just a hobby. Cycling is different from most of other sports, we can easily measure power we put bc we ride bikes or in other words machines, so we can measure the power we put into the machine to make it move.
Zones are below or under LTs (wavy line). In the beginning they were only:
Z1 → Lt1 ← Z2 → Lt2 -< Z3 all other came by dividing Z2 and Z3 into smaller zones to make training more specific. HR, power, weather, skin redness, color of your walls , all you can put on top of the graph to search for similarities. You should read it like: there is high possibility that…with such and such HR i’m zone 3 or there is high possibility that with white walls i’m in zone 1-7…
ps. Actually i wrote the same as @MedTechCD but in other words, less logical more desciptevely but hope you get it
The video explains the 3 and 6 zones and their crude fit with each other,and then the optimal training method by adaptatikn efficiency and time efficiency.
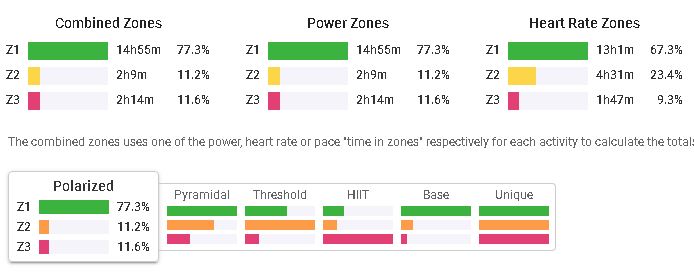
The spreadsheet allows the user to enter their FTP and LTHR, weekly training time and preferred training method (polarised, pyramid etc.) and then calculates training times in the relevant zones expressed by wattage and HR.
I use these as my settings, I deleted zones and configured to suit… It’s characterized me as POL based on 3-4 endurance rides, 1 VO2 and 1 Threshold, per week.