A new paper continues to add to the body of scientific work showing that Critical Power (CP) and Functional Threshold Power (FTP) are not interchangeable (though they are correlated closely).
Note some quality names in the authorship, such as Dr. Bettina Karsten (who has written several papers on CP) and Dr. Nathan Townsend.
Bottomline : CP and FTP are co-related but do not mean the same thing. Plus, wide limits of agreement among individuals. As the paper states : “Caution should consequently be exercised when choosing between FTP and CP for the purposes of performance analysis.” This cautionary note was seen in some past papers as well, with the same observations on wide LoA.
Let’s fall back to science and recognize each of the above terms for what they are worth. There is value in understanding that CP and CP alone is the “maximum” metabolic steady state, while FTP is a submaximal lactate steady state.
Couple of thoughts to go along :
Under the tab “Power”, the footnote under the power curve states : “Estimated FTP is calculated using power curves from FastFitness.Tips and Morton’s 3 parameter critical power model.” In light of this post, I’m not sure if “FTP” and “CP” should really be put in the same statement as if pretending they are pointing to the same thing. To continue to provide value for users who use CP and those who use FTP, there could be separate eFTP and eCP estimates laid out on the curve. Apologies if this is already provided but I couldn’t locate it.
Several (simpler) models for CP estimation would be welcome. Morton model may not be perfect in every situation.
Is FastFitness.Tips an original source of the body of work? Moreover, the link takes us to FFT’s homepage, not a source for the information linked to the graph. My two cents - the optics will be better if the developer replaces that with original non-for-profit scientific sources.
I decided to use FTP instead of CP because from what I could tell they would usually be close together and setting training zones relative to FTP is so popular.
I link back to FastFitness.Tips because Alex gave me the data I needed to build the FTP estimation (eFTP) in Intervals.icu. He provided a big spreadsheet with a couple of thousand real world power curves. I didn’t know about Golden Chetah open data at the time and needed lots of real power to implement my idea.
When I started with power modelling I quickly discovered that you need very good inputs and it is not easy to automatically identify the “best” points to use from an athlete’s power curve. I wanted something robust that would provide an FTP estimate from any max-effort without specific testing. Xert was my inspiration for this project.
I used Mortons 3P to model the real power curves (only using first 20 mins of each, suspicious drop off at 20m!). I choose Mortons 3P because I could implement it easily and it seemed to be an accepted power model based on my (limited, non-scientist) reading of the literature.
eFTP is calculated from a max effort by finding the closest Mortons 3P curve (CP, W’ and pMax) for that effort. So if you do 338w for 12m there will be a curve that goes through or close to that point. Power at 1h from the selected curve is used for FTP.
The W’ value displayed on the /power page is calculated by finding the point on power curve that has the most energy above FTP. This should really be above CP but it doesn’t make much difference and the W’bal chart on the ride timeline is relative to FTP. The athletes real pMax is used.
So as you can tell I have approached this from a very pragmatic software developers perspective. I hope eFTP is a good enough measure to use for training zones based on FTP and a way of tracking improvement. Anecdotally eFTP comes out close to Xert and mFTP from WKO.
Thanks for your reply. I totally get it that in software dev you have to cut some corners and make some other practical judgements.
I guess the crux of the matter in this thread is on “accepted practice” vs “best practice” to demarcate physiological regions of training in order to set correct training targets and that’s why I brought in the need to make a distinction between CP and FTP. Recent scientific literature continues to show there’s subtle yet important differences. Anyhow, the other coaches are free to chime in their thoughts. I’m sure those in the Training Peaks world will bring a TP flavor to the discussion.
Just eyeballing your model for my own data, I think the eFTP comes out around 5-10W too high than what I think I can possibly do for an hour. I suspect what the Power tab chart is calling my “eTP” is infact my CP and closer to a 25-30 min MMP. I also think this is consistent with your statement that you’re using Morton’s 3P model to extract an “eFTP”. Hence, there’s a bit of confusion on my side so this is where I’d rather be comfortable seeing the terms CP and FTP used explicitly and with distinction.
One of the issues related to this distinction is defining how much work and time a rider spends in a “severe intensity zone” which could eat into W’. If we go by FTP, which we know is a submaximal intensity, would “work>FTP” capture this well? Would it be relevant to some formats of racing such as track, crits and intense road races? What I really want to know is the work > CP since only CP is the true demarcation of heavy and severe intensity. Plus, the idea of W’ really stems from the CP paradigm, not FTP. W’ and CP are congruous metrics. I hope you see where I’m going with this..
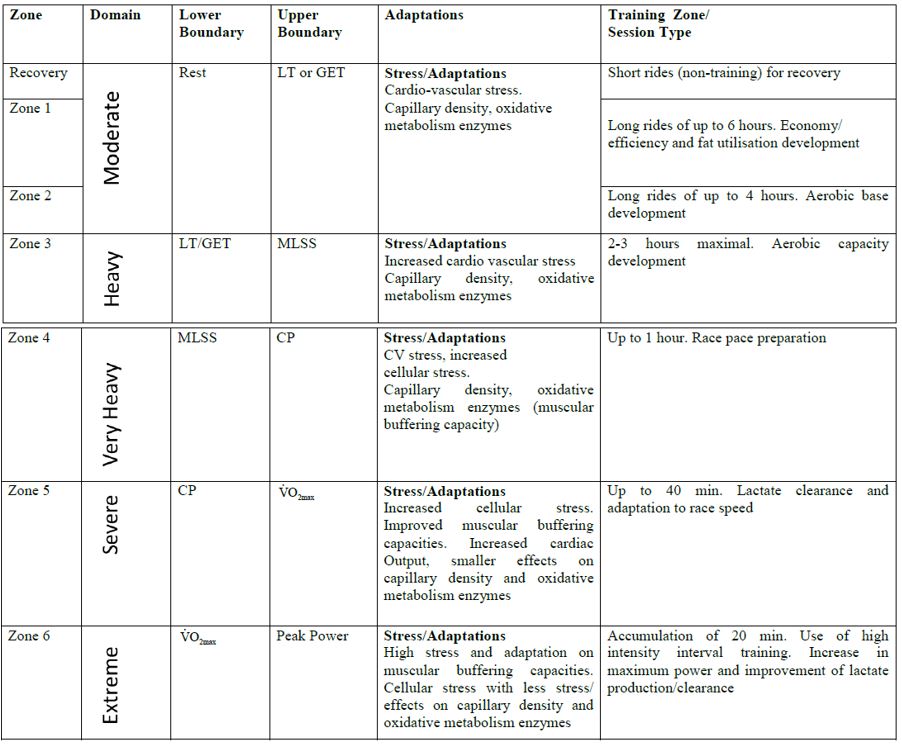
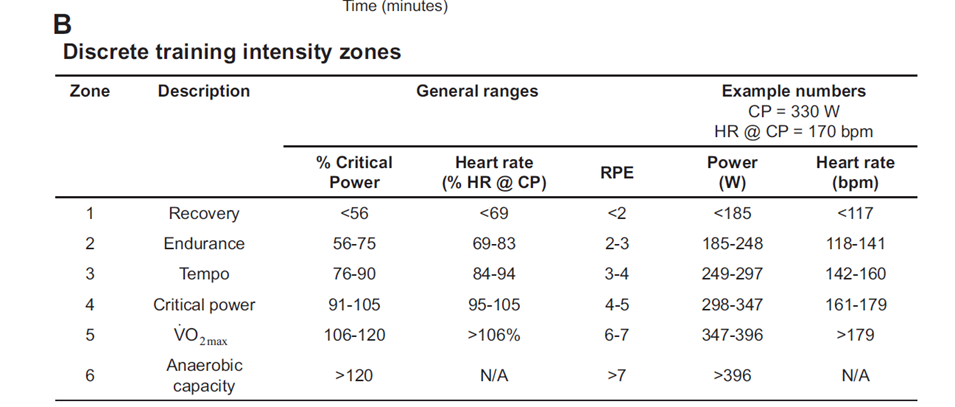
Fortunately, there’s a feature to set custom zones. Those who want to use CP to set their zones (CP testing done separately) can use this table as a guide, it came off a recent Karsten et.al paper :
Additionally, I’m sharing some recent papers since I think you’re quite interested on the modeling aspects and using the best models to identify features of training :
Development and field validation of an omni-domain power-duration model
https://pubmed.ncbi.nlm.nih.gov/32131692/
This paper tried to address specific disadvantages of the 2P and 3P Morton model with an “omni-duration” CP model that extends the range of the current CP models. Might be worth a read.
An Examination and Critique of Current Methods to Determine Exercise Intensity
https://pubmed.ncbi.nlm.nih.gov/32729096/
Crux of the argument in this paper is that MLSS (or closest surrogate to FTP) maybe “acceptable” but could also be a blunt instrument in determining exercise intensity. Just like several intensity markers that zones are based on.
The maximal metabolic steady state: redefining the ‘gold standard’
Thanks for posting these, I found them very helpful and had fun digging down the rabbit hole. I’d just like to share some quick thoughts, after having experimented with this tool which is an implementation of several CP models and allows you to enter your own data. I found that it estimates my CP in the range of 285 to 325, which, you will agree, is quite a wide spread and not very useful for training. The same goes for W’, which was anywhere between 15 and 40kJ. Now, as I have had a power meter for 2 years now, I have a very good idea of where my CP is simply by looking at the log-log plot of my power curve, which has a distinct kink at around 20 minutes. Ultimately, this would be the model validation. The one idea I had was this: is it possible to implement a method of calculating W’ by integrating the are below the real power curve (not the model generated) and the line set by the athlete as FTP (which in this case has to be entered instead of CP)? Thus, we would have realistic values for the two parameters that matter and could start on solid ground.
Hi. I’m aware of Maturana’s tool and use it in testing and also wrote about it in an article on Critical Power (attached below for reading).
With a multi-duration single visit test, you can pop in 3-4 MMPs and throw them into the tool for a quick rundown of different models and the effect on CP,W’. The engineer in me looks at the different values and tries to understand which one would most resemble a point beyond which I start losing a lot of efficiency and drive myself towards VO2max. One way to validate is do a 20-25K TT at 100% commitment under controlled conditions every time you test. Then check TTE and validate the model.
An under-estimated CP has an over-estimated W’ and vice versa. Estimation differences are due to the particular choice of durations, so practitioners need to be aware of what durations can do to the parameters from modeling. I suggest the original paper from Maturana et.al on effect of protocol if you haven’t read it.
In my experience, given a good dataset and a power curve from test day and test durations with a decent spread between 3 and 20 minutes (such as 3,7 and 12 minutes), the CP 1/time model comes out as the simplest and best estimate of CP in terms of low RMSE. A bandwidth of 5-10W around a CP estimate is a requirement for practical and physiological reality.
Protocol dependency for models is different from physiological phenomenon. Its good to set our eyes on what’s happening in the body, otherwise we are simply drawing cartoons for ourselves and won’t be training at right intensities. Critical thinking is highly recommended.
The one idea I had was this: is it possible to implement a method of calculating W’ by integrating the are below the real power curve (not the model generated) and the line set by the athlete as FTP (which in this case has to be entered instead of CP)?
You can. You need to know TTE (time to exhaustion, read off power curve), power output and CP estimate and then its basic algebra. A pre-requisite for this would still be a quality power duration curve. You run into estimation errors with submaximal data. That’s the one challenge with Intervals.ICU, you never know what is the quality of people’s power curves. In Golden Cheetah, you have a rich feature set to clean up the curve and only dot it with MMPs from maximal efforts and/or performance testing.
Additional reading :
Critical power: How different protocols and models affect its determination
Critical Power Concept in Exercise : Critique and Applications
I probably need to expose “eCP” in the UI and also W’ calculated relative to CP and not FTP. Then people who would prefer to work with CP can just enter that instead of FTP.
I do not have a background in modeling but really appreciate the detail and precision in this thread. Thank you for including articles for reference as well.
Hi Alex I read that article of yours yesterday. I see a lot of criticism of FTP where it’s clear that the people criticising haven’t even read Coggan’s book (not suggesting that’s you BTW). There’s a good interview with Coggan here (can’t remember where I got the link, may have been one of your articles) where he makes it pretty clear that some people don’t understand how to interpret his work: Fast Talk, ep. 72: Do we need training zones? With Dr. Andy Coggan, Dr. Stephen McGregor, and Hunter Allen – VeloNews.com
Eg - If you are supposed be training in a ‘zone’ that is 200-240W, it really doesn’t matter if you drop to 190W or go up to 250W. Like your statement about 60m power - nothing special happens at 200W or 240W that suddenly invalidates the work you are doing.
I think people just need to understand their training goals - are you training ‘base’, threshold or VO2Max? Do an effort at an intensity and duration (and potentially intervals) appropriate to the thing you are trying to train.
I like how he explains that the levels/zones are really just to help people to train without having to understand physiology. Eg. “go and do a 3-4Hr effort at under 200W” for base training; “do some intervals at 300W” for VO2Max.
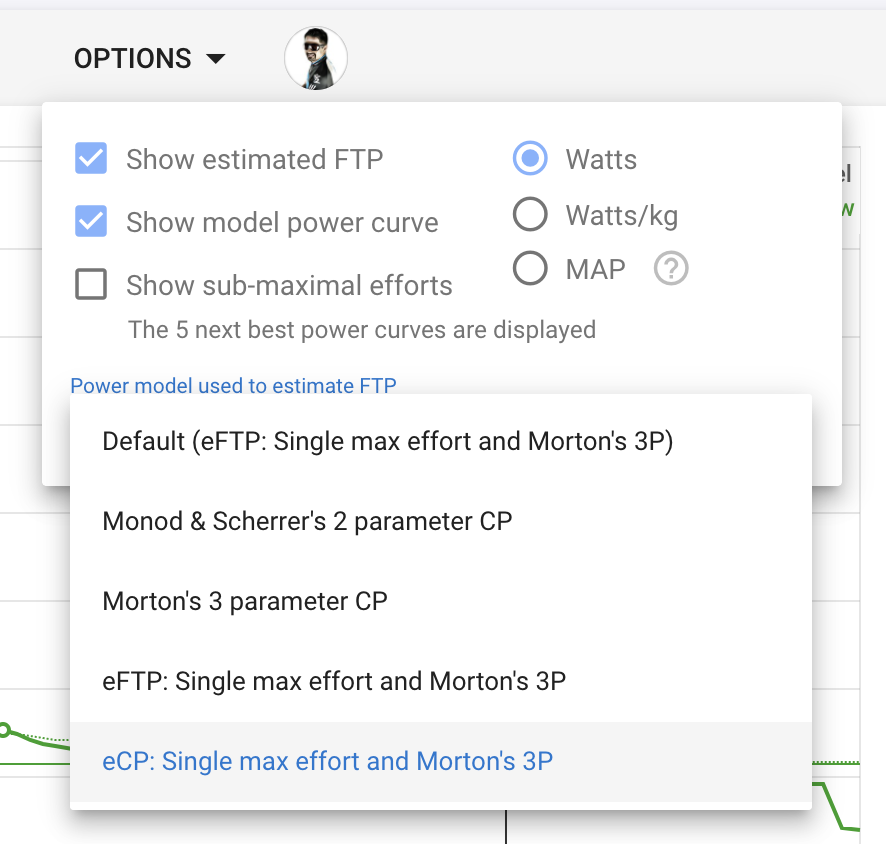
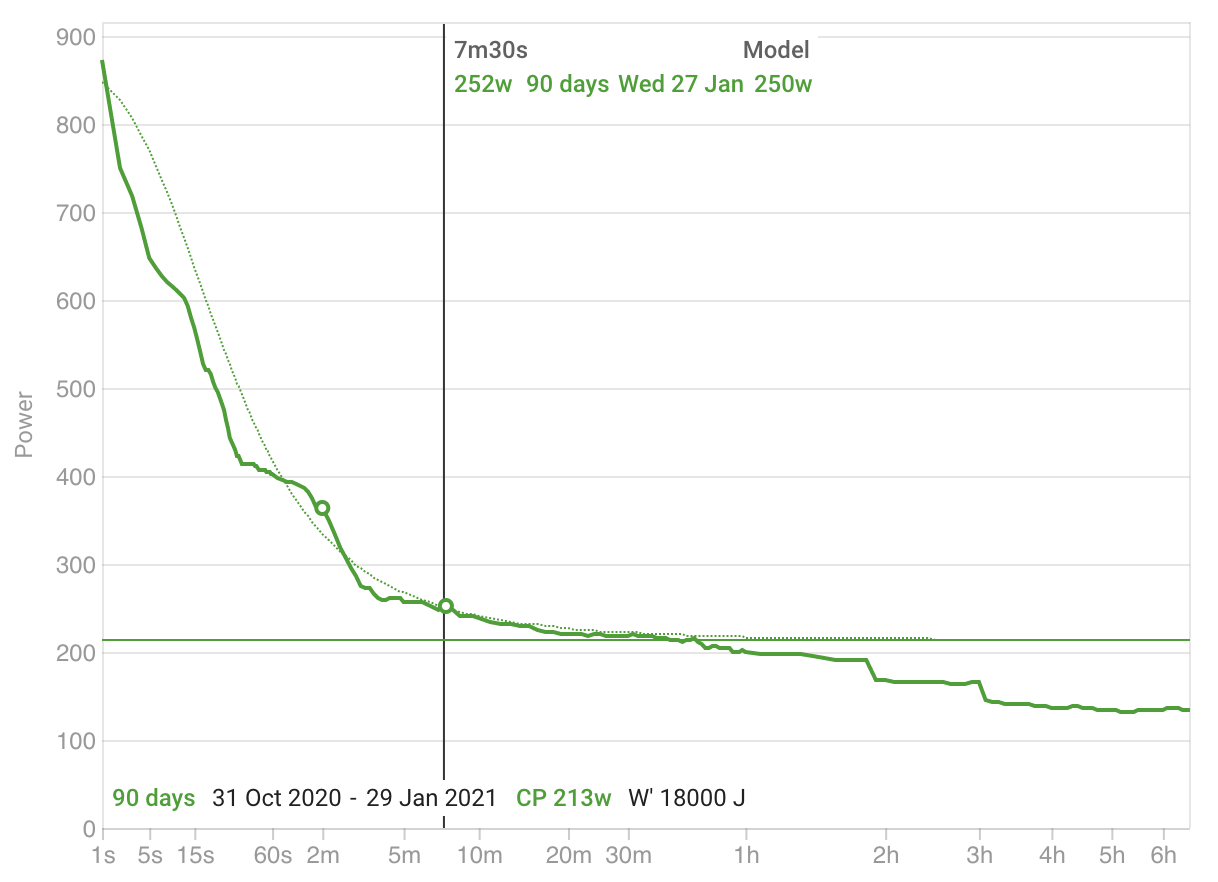
Athletes using CP to set training zones and so on can just enter CP everywhere instead of FTP. When Intervals.icu says your eFTP has gone up, go to the /power page select “eCP” power model and 90 days and read your estimated CP and W’ off the chart legend:
One’s personal liking of Dr. Coggan’s opinions does not refute the fact that FTP’s validity as either a performance measure, or a physiological proxy, is questionable at best.
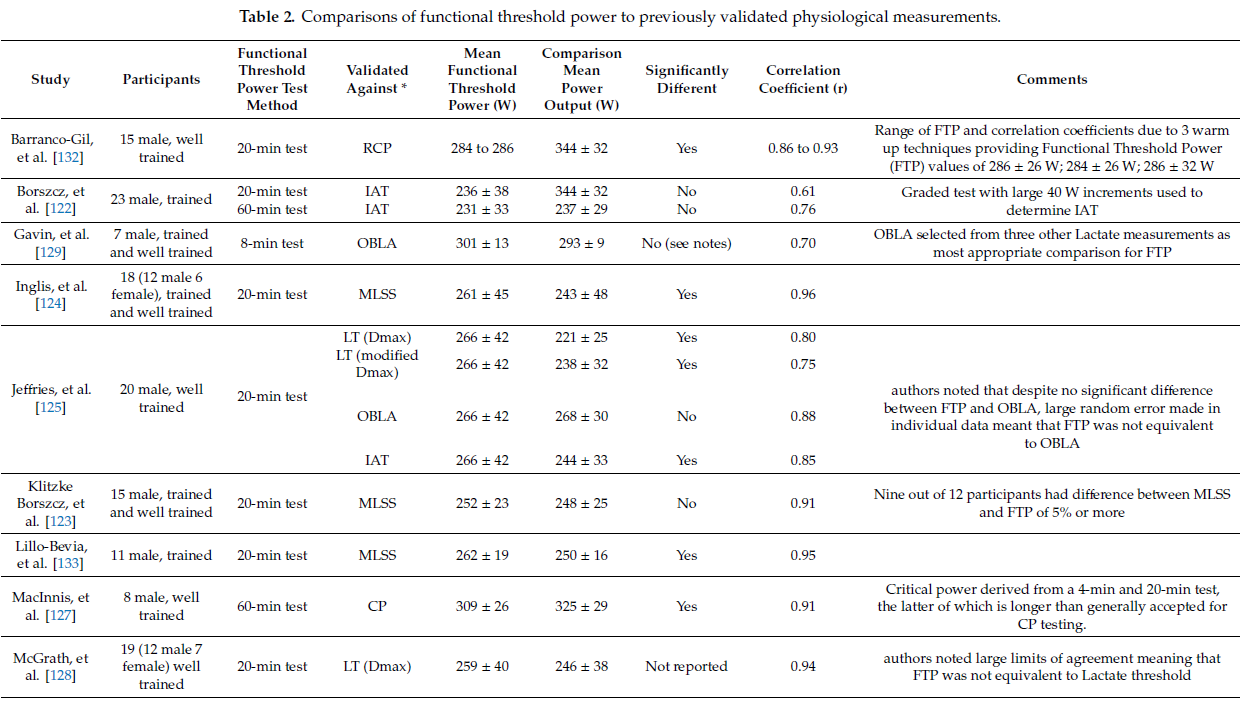
Below are some of the tabulated references from doi:10.3390/sports8090123 for further reading :
Not sure you could say FTP is not valid as a performance measure. Is a 20min TT (or 60min, or 2x 8min) valid as a performance measure? Or are race results the only real performance measure?
From what you’ve seen, do you have a sense of which protocol for determining FTP is most consistent with CP/MLSS/MPSS? eg. 60-min vs 5-min + 20-min TT vs 20-min TT vs… ugh… 8-min? Or are they all similarly inconsistent?