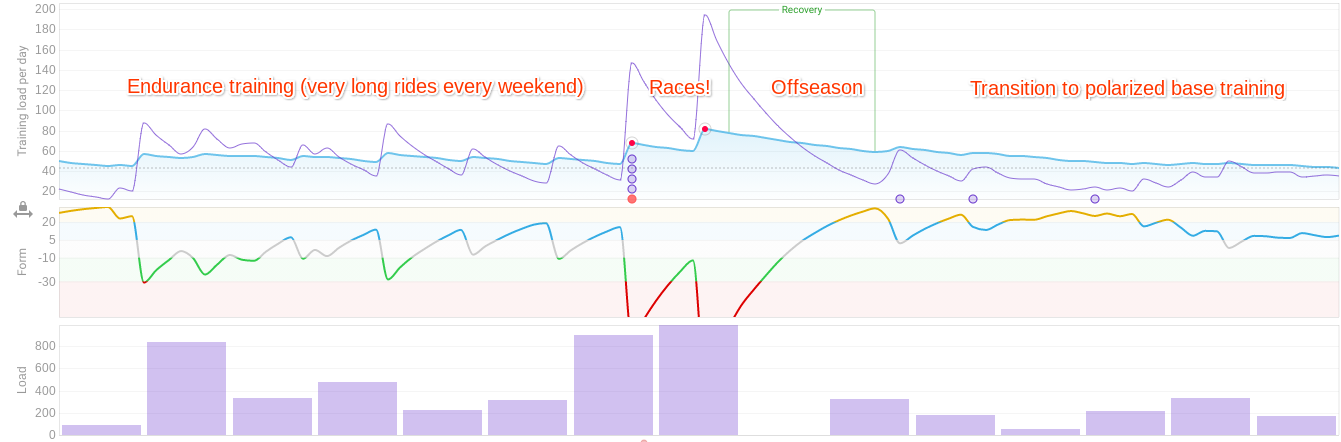
Is the form chart meaningful with the injection of very long rides? My chart regularly gets dragged into the red via endurance rides. The total training load of these rides can be 200, 300, 500… etc. This is mostly due to their duration, not intensity.
The high load raises the calculated fitness level so that regular weekday interval training rides don’t make a dent in form. My fitness chart looks like a person bouncing back and forth between the red and yellow. The endurance rides dominate the form chart, and my zone largely depends on whether I can fit a century+ into the weekend.
I am finding this makes it harder to monitor the impact of threshold work and whether I am over/undertraining Z4-5.
In my head I conceptualize threshold workouts and endurance workouts as mostly independent from one another, with the caveat that fatigue from endurance workouts can have an effect on threshold workouts.
Does anyone have any more information or understanding about how I might read this chart? Is there any evidence or experience to support splitting form into low-intensity (Z2) and high-intensity categories (Z4-5) and monitoring them in parallel?
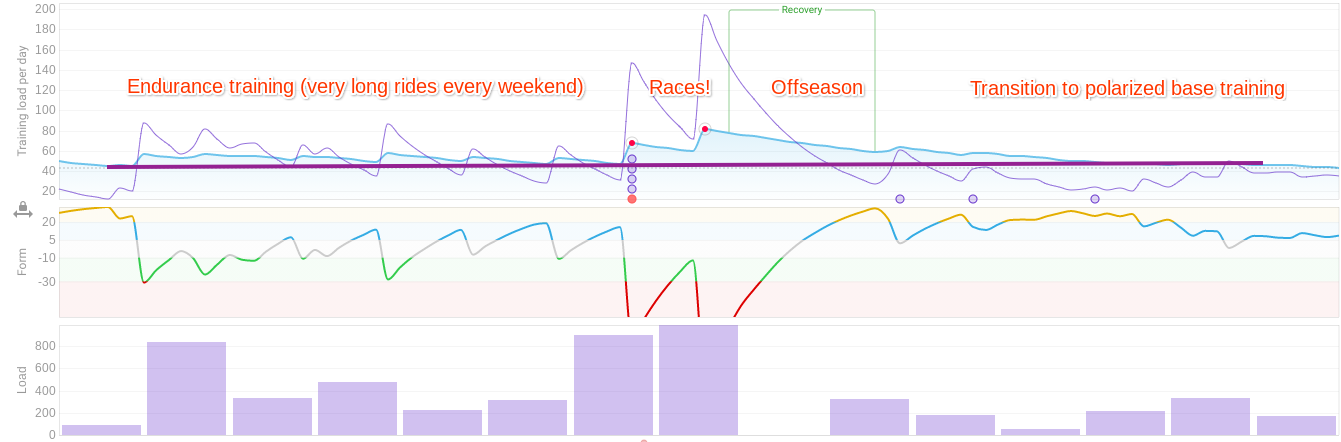
EDIT: replacing chart to make it more clear what I am referring to:
Difficult to say because we don’t see the numbers but if you have Form set as a percentage of Fitness and Fitness is lower then 70-80, you will rapidly get in the red zone after longer endurance rides. Have you tried with Form as an absolute value? With lower Fitness numbers, that might be more meaningfull.
500 TSS is 5h of FTP work. So one ride is 5 days of hard FTP intervals, considering it’s better to do them twice or three times a week not more it’s two weeks of interval work. So if you ride one long ride every 4 weeks with 2 weeks of FTP work and 1 rest week in between then it’s is kind of ok. But still you have to build slowly to that load range.
Fatigue is fatigue, 10 hours of endurance ride is similar to 5 hours of FTP work but it’s impossible to ride for 5 hours at ftp treshold.
What is the load of the interval rides? 70 TSS, 100 TSS?
You are bouncing back from very taxing ride to even more taxing ride and graph shows exactly your training style
Again, 70 TSS interval Z4-5 work is nothing for your body comparing to your Z2 rides. So the impact is exactly as the graph shows.
They are not. Actually if Pro rides could sustain efforts like yours but in Z4 they would do that. The reason they ride a lot of Z2 is to build stamina without much fatigue. So they ride a lot of Z2 like you but then they add periodisation so after building base they work on other aspects of riding like FTP and so on but are giving up on huge loads of Z2 to have energy for hard interval efforts.
You have one body and fatigue is for one body not two different bodies
I mean it’s really hard to understand what your plan for training is? All i know the graph is not the problem but the style of your rides. You should read a lot about structured plans and periodisation. You ride a lot, that’s good but even the long rides should be planned in increasing manner, so for example if you want to start with base block (8 weeks for example) you start with shorter rides and slowly build into longer ones and then you see the chart slowly going up. Then you build strength for exampel so the rides are faster, and then during the season when your fitness is high (80-100) meaning you are healthy and fit and have ridden regularly for couple of months (base and build period) a 300 TSS ride is just 3 days of work (remember that fitness is just 42 rolling daily TSS average, so 300 TSS = 3x100 TSS) So the hard ride is not that hard for your body. For now you are just overtraining your body with every longer ride and risking injuries, cold, infections and so on. You can put a ramp chart on bottom of the fitness graph, the ramp shouldn’t be higher than 6 to stay healthy and secure.
ps. It’s like lifting 200kg weight during your first month on a gym. It’s simply risky as hell.
ps2. to say it very simply, if your weekly load is 800 TSS, 500 TSS ride is not a biggie, but if your weekly Load is 200 that the graph looks like yours and 500 TSS ride is taxing your body just like 2,5 weeks of work
If your base assumption is “TSS is TSS” then I’m not sure this exchange will be productive.
I am skeptical this is actually equivalent at all durations. Eg, I have one race-ish effort at a load of 991, 75% intensity. I gave myself plenty of rest afterwards, but I didn’t need a whole 4 weeks of rest.
Furthermore, there are adaptations one gains during a long Z2 ride which cannot be gained via an equivalent TSS threshold ride and vice versa. I don’t think your deductive leap making equivalencies between long endurance rides and hard FTP efforts works here. “it’s better to do them 2-3x a week not more” studies (which I assume you’re referencing in this statement) talk about how you see diminishing returns in terms of threshold workout frequency and performance gains. Barring some other study I’m not familiar with, I don’t follow your deduction that the 2-3x a week recommendation for threshold work implies what amount of recovery is necessary for non-threshold work. By the virtue of the fact that there are different physiological adaptions for each, it would stand to reason that one’s ability to perform and recover from endurance efforts could be more highly trained relative to threshold/VO2 efforts.
Friendly reminder that you are making some assumptions here.
The winter plan is a six week polarized base. Two short interval threshold workouts per week with Z2 everywhere else. Raise intensity for five weeks, then have a recovery week. I’ve cut the endurance rides now that the weather is bad. Will be adding the long rides back in progressively once I get my fat bike during the next block.
I’ve started my high intensity workouts at a shorter length (30 mins ~40-50 TSS) because I have learned (the hard way) that I cannot expect to do the same load per week of high intensity as I can with endurance without overtraining. You can argue that TSS is TSS but my legs would disagree. Seems the TrainerRoad blog would disagree as well:
TSS is most effective as a tool for tracking long-term training load. Comparing total TSS/week over time is a helpful way to monitor Ramp Rate and ensure you are not doing too much, too fast. As a way of comparing individual workouts, it is important to remember that because of how the TSS calculation includes handles duration and intensity, it can be misleading.
A similar TSS value might seem to equate the stress of two dramatically different efforts, but this is not an accurate way of quantifying how your body responds to training. For this reason, TSS is best used for direct comparison only for workouts that stress similar energy systems- sweet spot and threshold rides, for instance. However, as we will consider next, even comparing similar rides by Training Stress Score can be dubious.
I’m still at a loss as to what information I can reliably glean from the Form Zones. When I’m focused on endurance, I use it to gauge my recovery from very long rides. When I am focused on high-intensity (and have been for some time), I can also use it to monitor training load and prevent overtraining. But I’m not sure what to do when transitioning between these modes or combining them.
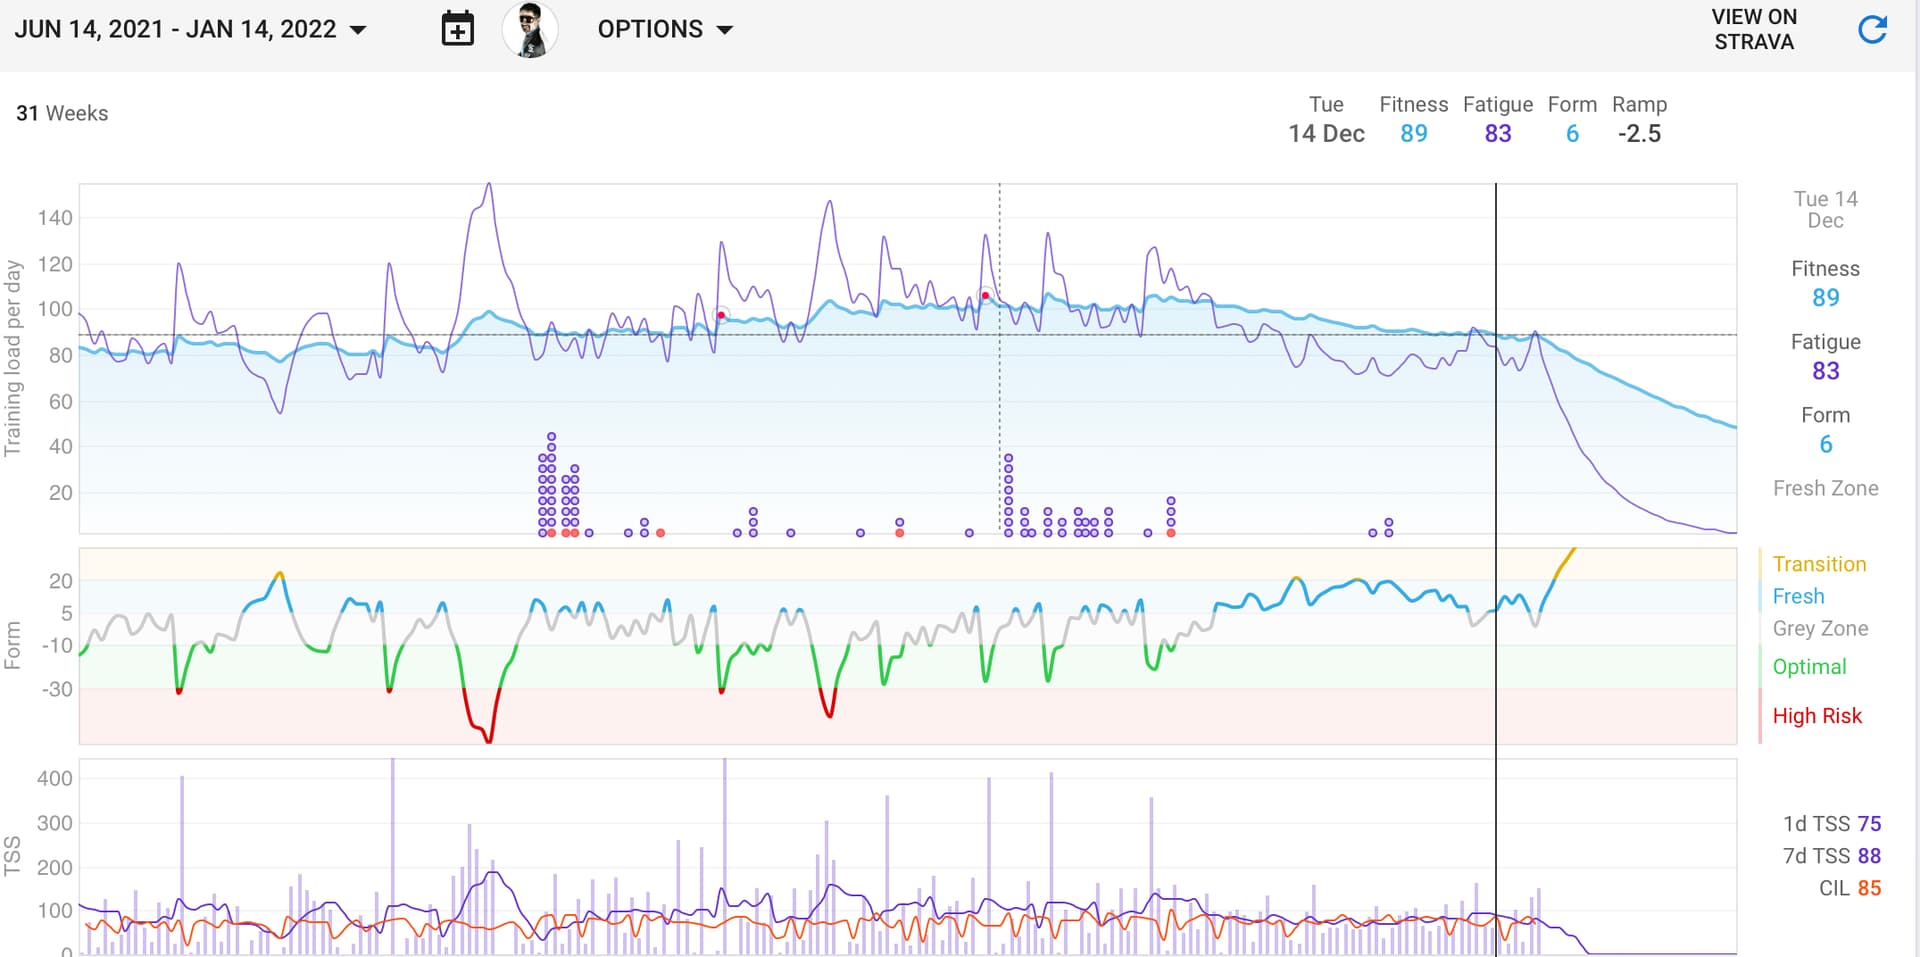
Perhaps this graph would be more helpful. Right now I’m looking at how everything is “fresh” because I’m simply not putting in crazy miles over the weekend. I have very little ability to gauge my threshold efforts via this graph until the moving calculation adjusts to the relative lack of endurance work. I could add more high intensity work to get me into the green, but I’m pretty confident it would be too much too fast.
My assumption is according to the graph you posted, post better graph with data like dates and numbers then maybe my assumption will be better.
You asked about your graph not feelings. Math can’t recognise different kinds of 120 TSS loads.
During base period? What was your fitness level? What is the idea behind such ride just out of curiosity?
Sorry, my assumption was that if someone can’t post a proper graph, his ability to plan is limited so i oversimplificated my answer. I apologise
Agree but again, your question was about the fitness graph not adaptation you can get from riding in different zones.
There is no planned rise in intensity on that graph, you start on level X (i don’t count the first long ride) and end on the same fitness level X
As i said, after 500-991 TSS ride couple 50TSS rides make some good recovery but calling them high intensity intervals is missleading. I would cut the long rides by half and work on rising intervals duration.
Exactly as i said earlier, create a ramp graph, put it underneath fitness graph and compare.
You get me wrong. I think that your ability to ride many hours in Z2 is amazing but i don’t understand the idea of working still on your strongest point, and you leave your weakest point behind. If you have to manage weekly TSS of 500 for example, you can divide it into Z2 and Z4 as you like, ofc at the end how you feel is most important thing.
Ok i saw your new graph. I will try to explain my point, i kind of understand your problem but at the same time i think that i don’t or at least i see a bigger problem somewhere else For me you are riding a lot and sometimes racing but not training. You did 6 similar rides before your races. From training perspective if you did the first one, your body adapted already to the load so the next one must be more intensive/longer to push new adaptations. your next 5 rides are kind of pointless they just maintain your fitness you are just circling around not improving.
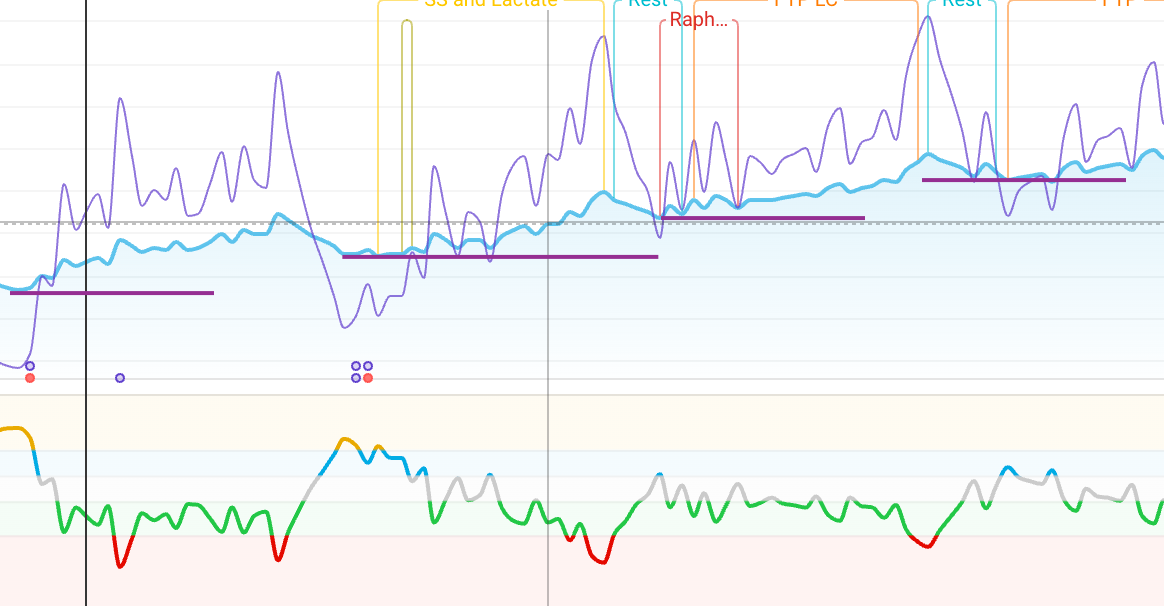
i put the horizontal lines to show you effects of periodisation. 3 weeks build 4th recovery, as you can see after recovery week my fitness is higher than at the begging of the block so i can take higher load and still maintain proper ramp and fatigue (i use % based) and every week my average TSS is higher so if i make a big weekend ride it’s not that scary and not that fatiguing. Thats also a good way to build for the race and planned load. Before a race you make a tapered week, your fitness drops a little but it’s still very high so you can take much higher load without risking an injury. You stress your body and let it rest so it adapts to new higher stress. Your way of training, and keeping the fitness flat is kind of dangerous and i can understand why you are afraid of high intensity intervals. But i think there is a difference between stress and fatigue and overtraining. If you stress your body with 2x10 min ftp interval and than let it rest, you can ramp up intensity next week to 3x10 or 2x15 as you like and so on. If it’s to hard you just back off a little. If i imagine doing intervals just as you ride long rides, same intervals week after week without building duration i can imagine being tired, angry and feeling overtrained. And no graph can tell you if you should/can train more or not. Always observe yourself and if you feel tired just take a day off no matter what you graph is showing. You dont listen to the graph when you race 3 times harder than you should looking at your fitness level
I can understand but the only reason is the small intensity of your intervals. A sweet spot or FTP intervals of 2x20 or 2x25 you would definitely see on the graph but you have to build to that intensity just as you’ve built to ride many hours in Z2. Maybe just start from something like 2x10 and progress slowly. I mean it’s is really a huge discrepancy between your racing/long ride abilities and intervals work. Just rest a day after every interval day and make a recovery week as a 4th.
ps. i’m trying to help and getting angry that i don’t know how, sorry if i got harsh
It’s the second of the two red efforts on the following graph. Before base. Last hurrah of the season.
It was the week after a 900+ load race. Shorter recovery than what I would’ve planned, but essentially I had a window of opportunity to chase down an FKT the following weekend. I was feeling good that week and I knew the effort would be low intensity, just super long. I jumped on the opportunity and it was fine. I was also trying to collect some data on what races/distances to sign up for in 2022 based on how I felt during that ride and after.
Each weekend effort leading up to that race was very different in character and route. They each stressed different aspects of endurance riding. This worked well because the race I had was a little bit of everything. Furthermore, there’s a lot more than raw “on paper” fitness at play with self-supported ultras. Eg, mental endurance, comfort on the bike, etc. There are aspects of riding I have to address which don’t appear until after mile 80 on a training ride. I was very satisfied with my training leading up to that race. I was prepared mentally and physically. The miles flew by relatively quickly and I placed well. There were faster riders than me who DNF’ed.
Big weekend rides aren’t “scary” nor “fatiguing” because I do them often. I am not “afraid of high intensity intervals” but simply starting lower and slower this year compared to last year. As I explained before, the intervals are increasing in TSS each week. It’s a pretty standard polarized base. I am trying to be patient with you explaining things of which I am already aware. If you are getting angry, I think you should maybe reflect on why you see something which seems strange to you and assume all sorts of negative things. (This person is overtraining and going to get a bunch of colds, this person has never heard of structured training, this person finds big rides to be “scary,” this person is “afraid” of high intensity intervals, this person is doing similar long rides over and over again, this person doesn’t understand what a taper is, etc, etc). You keep jumping to all sorts of conclusions; I’m not going to spend time correcting all of them.
There isn’t a lot of research about training for the events I’m aiming for. I’ve based my plan around observations of athletes in my discipline and the little research I can scrounge up. The people on the podiums are often eschewing traditional training methods and many don’t do structured training at all. You can say I’m just “riding a lot and sometimes racing but not training” but given your metrics, a lot of top athletes in these events are doing the exactly that.
I’m not looking for broader training advice unless you are a self-supported ultra-endurance specialist. I’m very happy with my progress and results this past year. I have a solid plan for this year. Now that I’ve shifted my focus, I am trying to figure out if there’s some trick for better interpreting this form chart, or perhaps a different metric to be looking at. I have to decide how much to ramp up my intervals each week and right now my form chart is dominated by past long distance efforts.
@Samus , I‘d a somewhat similar pattern this fall – at the end of first year of cycling (but with a previous life in semi-pro sports a significant while ago)
To me the load of a long weekend ride (shorter than yours, but still) is also different from a set of short 70–100 TSS Interval sessions. The former is more a general-body fatigue whereas the latter is directly going into “aching” legs/etc. But, for me it worked well to use the fitness graph for mid- and long-term analysis and guidance, including tapering for 300 km races or such – and to simply listen to my legs and body for fatigue and necessary rest on a daily basis.
You see that the only way for me to get into the “green” training zone is to do long rides – around Fitness ~= 100. Recently I have only be doing 1–2 h rides or training, with ~10 h per week: there is no way for me to get into the “green” zone that way. I can not train harder (per time) and more (time) and thus that’s what it is. Grey zone seems to be the best training zone for me with a pretty-full-time job and family. Fine for me.
And I’ll throw in some long/endurance rides in the holiday season again, which will push fitness up – and, @Lukasz_Pludowski , I am pretty certain that this is not going to be a (injury) risk due to the style of riding: even 6–8 h at NP < 2/3 FTP is truly easy if ones takes it easy, eats and drinks sufficiently during the ride.
For me, it does require a day off the bike afterward and I often go for a short run;-)
Now, maybe I am too lame to push myself into green with intervals, my body feeling says it’s not where it, the body/legs, wants to “be” – that’s too high a(n injury) risk for me to try.
Amazing! I also have a previous life of being in a totally different sport. I picked up cycling because I am literally too beat up to do anything else, haha. Four surgeries over my career.
The fatigue feels totally different to me as well. The high intensity intervals feels closer to the fatigue I get from lifting. The muscles feel depleted of their ability to perform at their best. The endurance ride fatigue feels more like the energy reserves have been burned up.
Yeah, this is what I’m doing at the moment. I also throw Olympic lifting into the mix so there’s a lot of listening going on during any given week. While intervals.icu adds lifting to fatigue, it doesn’t factor into training load. You have to figure out your own way of working it in.
My power profile seems to be the rare “sharp V” pattern. It’s an odd marriage of anaerobic base with long distance specialty.
I’m sure there could be some weird data collection bias at play as well. Hard to conclude much. However, this profile does match my observations. It’s clear where my advantage is relative to my age group. The longer the ride, the more the advantage. Unless it’s < 1min.
You may also be looking at the Performance Management Chart with CTL, ATL, TSB, etc. I think this is well explained in this TrainingPeaks article so have a read and then let me know if there is anything you don’t understand. It is worth keeping an eye on performance management metrics, but bearing in mind it will go mad when you do long events and may even get quite odd if you go touring. In my experience it is a bit skewed to weight the loading of longer durations more than higher intensity. In that respect, be careful not to be led into doing too much intensity.
Sounds a bit like what you experienced.
Not much else to be found in a quick search. Interesting topic.
I see a clear progression on your chart, you went from 80 to around 110. And your fitness and form are all ok. Looking at your graph i agree that your body is prepared for a 6-8h ride. 300 TSS ride is not that taxing if your daily average is 110, it’s only 3:1 ratio I wouldn’t compare it to 900 TSS did twice in a row from a 50 fitness level, it’s 18:1 ratio, it would be for you 1980 TSS twice in a row. And i hope you agree that 2k TSS ride would be really taxing for your body.
I know that you can bump up your graph with long endurance rides, been there, did that. All i’m trying to say is, with many long rides you are collecting fatigue and the graph is showing exactly that. When you do a short intensive FTP interval work, muscles/hearth are your limit preventing from overtraining, you just get tired quickly and it is hard to collect much fatigue that way. With tempo rides things are getting more complicated. They are just slightly harder the Z2 but in a long run can be leading to overtraining, and i look at endurance rides just as longer and slower tempo brothers with fatigue building very slowly over time, and graph shows exactly that and prevents from overtraining which for me is easiest with continous long endurance rides and not hard intervals.
I’m glad you are happy and congratz on your results
I know some ultras and they do structured training, so i can be biased.
Thanks for the link! The quoted section seems to be exactly what I’m experiencing.
My approach seems very similar to this coach’s. I do two short threshold/VO2 sessions during the week and long, slow rides on the weekend. (The weekend rides are relatively short right now as I suss out my winter gear, but will be ramped back up progressively once I can get outside.)
The fat adaptation he mentions is another critical component. You get to a point where it is impossible to eat enough calories relative to the effort. I’m not sure how one measures training of fat adaptation other than subjective experience while riding. This summer I had some unplanned circumstances where I was able to test the extent to which I could ride without adequate nutrition. But it’s not something I’d repeat by choice.
lots to unpack here. From your initial post as well as from the discussion so far.
Yes indeed, not all TSS is created equal.
And CTL (Chronic Training Load) or the “Form” curve in Intervals.icu is just a mathematical means.
Is it a good tool? Depends. What does it measure? The external load which is put into your pedals as a proxy for the stress you put on your body. Which, while catered for intensity and duration as well as decay (42 and 7 day exponentially weighted moving average) ist not equal to / doesn’t have to be the right representation of the strain your body is underlying. Maybe as a slow twitcher, riding at 120 % FTP does fatigue you way more than it would a fast twitcher or vice versa. So same stress, different strain.
To complicate it further: stress does say nothing about the adaption which occurs. So this begs the question: why calculate or use TSS and then CTL and ATL at all?
Well - you have to answer this. Maybe, with at least two or three years training experience under one’s belt, one could make some assumptions on what “ramp rate” one could use as a maximum before breaking down or what CTL number could be sustainable. But… only if life stresses you equally in all those years and situations for one. And maybe only if your training composition is comparable in those years. It might become thrown off, if you in one year only try to do HIIT. Well, that would be the “not all TSS is created equal” part, then.
But would it? For all its practicability, the concept of TSS is quite, well practicable. As in: yes, with the normalized Power going in, the part of high intensity or better - of relative intensity is taken care of. Again - not all individuals are created equal in what they can produce relative to their VO2max and how hart it is for them to ride at 90 % or 100 % or 115 % etc. But here’s the thing: even if you would conceptualize a LIT-CTL and a HIT-CTL to have them drawn on two separate Y-axis’ this wouldn’t remedy that problem to clearly depict the strain your body is experiencing there (and no - I don’t think using TRIMP - Training Impulse and Heart rate would solve this. Although the HR is a valuable and not to be neglected data).
And as a second point: yes, these long base rides - as easy as they sometimes might seem - put a lot of strain on the body. That’s why they are so effective.
I personally go more or less totally by feel. I know when I’d rather would want to train a bit more but are held back by life’s realities and I also know when I rather go a bit slower because a bit of rest would be sound. Yes - I also keep an eye on the CTL curve but rather as one of many data points and I never aim for any number, be it CTL, ATL and least of all “Form”.
And yes, after a week or even two of bikepacking or even a bikepacking race the ATL is astronomical and the CTL follows. With Form deep in red and High Risk. But - that is a very true representation of yourself even if it is neglecting your sleep deprivation, the strain on your muscles, tendons and ligaments, bum and everything. So it actually paints a picture which is still way too good. And of course every metric tanks thereafter. Because normally you should rest but even if you doesn’t you would need enormous amounts of load to point the CTL upwards again. Mathematic algorithm and life reality work in tandem here.
Coming back to the PMC chart and the “form” curve. As I said - it behaves like it should and is expected. But you could try and go into the settings of intervals.icu and pretty much the first line where you can edit things has at the far right the field “form”. There you can switch between “absolute value” and “percentage of fitness” to see, which you like for your form curve a bit more. doesn’t change the underlying principle that much or at all, though.
Hope this helps a bit. If not - I’m happy to indulge into all things ultra endurance training.
Out of interest, what type of events interest you most, there? Any events planned for next year already?
I have 1-2 winter ultras (B and A events) around the corner, depending on some factors (eg, whether I can get my gear leveled up in time, borders being open in COVID era, etc). The goal is to hit two ITI qualifiers before next winter. We’ll see if I can pull everything together in time.
I made the Unbound XL lottery. That’ll be my A event for the summer. Also contemplating Gravel Worlds–we’ll see. I’d like to do some longer bikepacking races but gotta figure out when to squeeze them into my schedule.
Third - the shape of the graph is what it is because of the nature of your training and racing profile. We’d all show the same shape of chart for the same efforts as you. Likewise, yours would replicate others was your training plan to change to theirs.
In my head, I remind myself this whole site is the tool, not just the one chart. If your PMC is the expected pattern for your training/racing, it’s job part-done.
Time to look at an output graph or two to see if other dials are moving too. I’m assuming FTP and HRLT and thereby training zones are updated every couple of months, thus making stress scores / PMC a relative thing one to another across the seasons and years. However, eg
is absolute FTP/kg going up?
is there a positive change in the shape of the power or HR duration curves?
how is your training impacting pace?
etc etc etc
If the performance measures are going in the right direction, and the shapes on your PMC chart are as expected given the nature of your specific training/racing (with a stepped movement up-shift left to right… and possible narrowing of variation??? I don’t know) then all’s good in your world. It’s the shape you’d expect to see.
Sorry if I get this horribly wrong.
I come back to repeating my appreciation of the efforts you do do. Top stuff.
For what it’s worth, my stats looked all barmy due to a 1000mile endurance ride not so long back. I’m looking at my VO2max and FTP/kg presently falling away because I’m not putting in the same efforts I did in training or on that event. Those are the metrics I’m focusing on just now as I begin again to rebuild load after 3-months off. My PMC is beginning to look more as I imagine others will, but not yours. We’re all here for the same reason but with unique circumstances and requirements. Good luck with yours.
Tx for publishing that writeup, I hadn’t seen it before!
This data is only available at Intervals.icu and your account there.
I have taken some steps to address this.
You can configure Intervals.icu to push all incoming files (from Garmin et al, not Strava - against their TOS) to Dropbox
You can download all the wellness and fitness info in a CSV anytime
You can download all the workouts in a folder in a zip of MRC, ERG or ZWO or JSON files
Developers can use the Intervals.icu API to extract data
I still need to add support for downloading (or pushing to Dropbox) a fit file of an activity post power edits and so on.
With regards to the lifetime of Intervals.icu itself it is true that I cannot guarantee anything (like any online service). However it is making some money and I have done a white-label deal with a coaching company so its not likely to go-away anytime soon!