Hi my Fitness on Intervals.icu seems to be inaccurate over the last few weeks although load has been fairly high fitness continues to decline and form increases. Garmin training status which used to mirror intervals fitness has got my trying load ratio at 1.1 maintaining fitness with load focus high aerobic.
Has anyone any ideas why this has happened as intervals has me as fresh but don’t feel that with the amount of rides and intensity.
Your weekly training load has been dropping. Your FTP hasn’t changed so it really does look like you are doing less training, hence the drop in fitness (CTL). Your training time has also been dropping so it looks correct to me.
Intervals.icu is using TSS as load, garmin is using its own epoc. They can overlap but most of the time they will not. If you look closely at Garmin connect in your workout details, you can find TSS score there so you can recheck if it is the same as in intervals.icu (your hr/power zones need to be same here and in garmin) but again, Garmin graphs will be epoc based.
intervals has me as fresh but don’t feel that with the amount of rides and intensity.
fresh is load independent, meaning it just means you are doing less then before (just as David said)
CTL is rolling avg from 42 days (or so) so it is less prone to changes meaning responds with dealy (it is meant to be used mostly when planning)
Garmin is showing a load graph which is jsut a sum of epoc load for each day/week meaning it responds imidatelly, but you can’t use it to plan your training in the future. But is nice to track daily load.
Don’t mix both systems.
TLDR. both graphs (garmin and intervals.icu) will overlap by accident with more or less constant load for 42 days (intervals will flatten, garmin will be flat)
The purpose of training is to improve performance. If you are focused on Fitness (CTL), you’re doing it wrong. The Fitness/Fatigue/Form is a good way of following up on planning and checking if you’re not going too hard. It isn’t telling you anything about performance.
Once you reached your max for available training time, Fitness will plateau. There’s very little you can do about that. But that doesn’t mean you will no longer increase performance. Fitness is based on Load and Load is the result of effort done referenced to FTP. If FTP goes up, you’re doing more work and get more performant. But that isn’t reflected in the Load number because that Load number is related to a % of FTP.
In the end it means that 2 athletes with the same Fitness/Fatigue/Form numbers, can be very different performance wise. Like one having an FTP equal to 150W while the other has an FTP of 350W. If they both have a similar training program and time-availability, that’s perfectly possible. The one with the higher FTP will normally have a much longer training history and has build to that FTP over several years of consistent training.
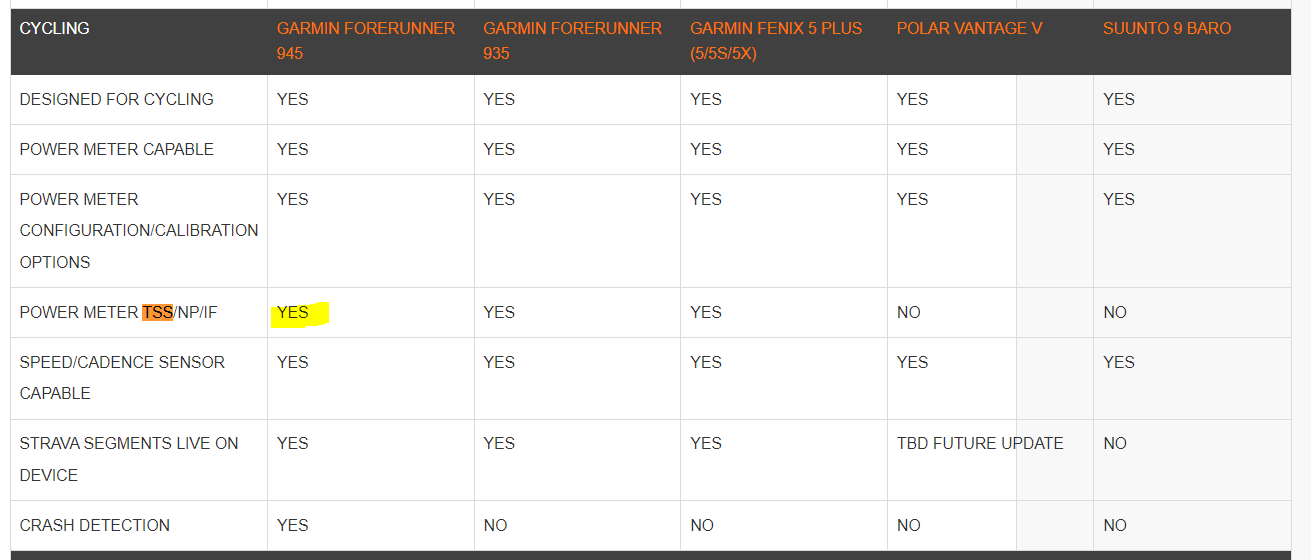
Where can you see TSS from garmin connect? I don’t have that value calculated, just their own training load (epoc) and a value from 0-5 measuring aerobic/anaerobic training benefit. I understand that not all watches have TSS, I have the FR 945.
From DC rainmakers review on FR945, it should have TSS available as a displayable field. That is, if you have a Power meter connected to it because TSS from HR is another story that may be available as a IQ field.
I used to have a Suunto watch, where the application of the different forms of TSS is straightforward. Yeah I can get in in Garmin with a power meter, or with a third party hack to Connect IQ, but why would anyone want to just see the TSS and not use it anywhere? The whole point of TSS is to use it conjuction with CTL/ATL and TSB. That’s why I ditched Garmin Connect and started using this web site in the first place.
I don’t think that DC Rainmaker actually did a very good review of the triathlon watches, making a big point about the use of maps but totally missing to mention the fact that garmin doesn’t have or use the most fundamental parameter of training in a native way.
Copyrights probably.
I don’t think Garmins epoc is that useless and I kind of think TSS is only good for planning and has its own huge limitation.
I can give you a simple example from my last month of training. I did two very hard (for me) workouts which were from my RPE and recovery I needed very similar (I was shocked actually that they are were so similar) for comparision added 5h z2 ride which was much easier from those two workouts.
it was:
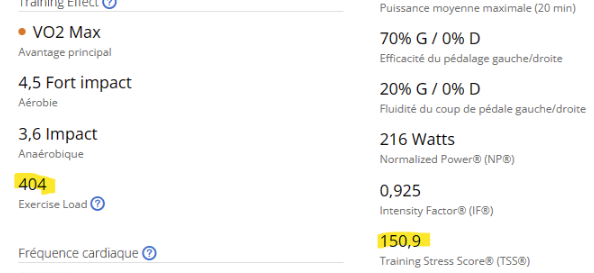
2h30min long ride with two 1h intervals at 88% and 84% of ftpn(and 15min recovery)
169 TSS 295 EPOC
1h40m with 5x3min hard start vo2max intervals (30s 125% into 2m30s 109%)
92 TSS 237 epoc
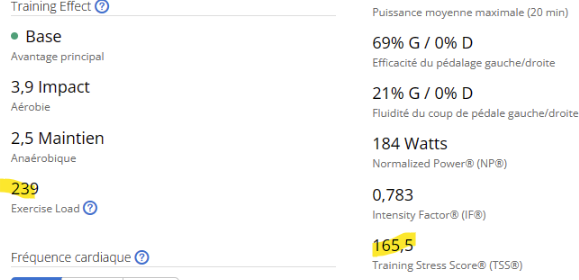
5h z2 ride
177 TSS 185 EPOC
And now looking at TSS there is no way I could do vo2max without like 3 days of recovery (but it is only 92 TSS) I could ride 5h z2 ride again next day or like every second day with no major fatigue. Those two 1h intervals made much harder workout than the 5h z2 ride, like twice hard and were harder than vo2max intervals. etc
Now looking at epoc everything is more or less correct whats most important it is correct comparing to my individual RPE from that sessions.
2x1h was overkill, died from fatigue next day 295 epoc (highest epoc whole year)
5x3m vo2max was again almost overkill, but a lil bit lighter than 2x1h 237 EPOC
5h z2 was just a nice ride with some fatigue next day 185 EPOC
So at least for me (I planned for now by TSS but already think how to change that during next season) Epoc give much better results comparing to how I actually feel during and post ride. And I think Garmin is not that stupid at all in terms of tracking overal fatigue and training load.
PS. Jesus, your nickname gave my some melancholic feels (my fav game when being young on my ami 500, like remember hours it took me to complete that game without Jools getting hit once)
Thanks for all the comments I have ignored Garmin training status in the past as a result over trained then ended up sick . The last several months been trying to focus on 80% Z2 which is easy the hard part is getting the other 20% correct to keep VO2 & Threshold efficient.
20% is a lot if you only consider Z4 and higher!
Please make sure that you’re not using Duration (time) for this balance! Use number of sessions 4:1. Depending on your goals, Z3 can be a target for part of the 20%.
I agree with you that TSS from easy biking is overestimated. Or yeah that’s a limitation but at least the formula is transparent. I used to follow EPOC as a graph during an exercise in my suunto watch, and it’s usefull for seeing how your load is balanced during the exercise. But for the recovery time: I think the first beat algorithm (that both suunto and garmin use I think), is pretty accurate. If it says 120 hours recovery, then I usually get sick afterwards.
I would say: TSS is more accurate when you are closer to FTP workouts (I did FTP block where the lines are getiing closer) but gets inaccurate above and below FTP. Considering it is derived from FTP it makes sense.
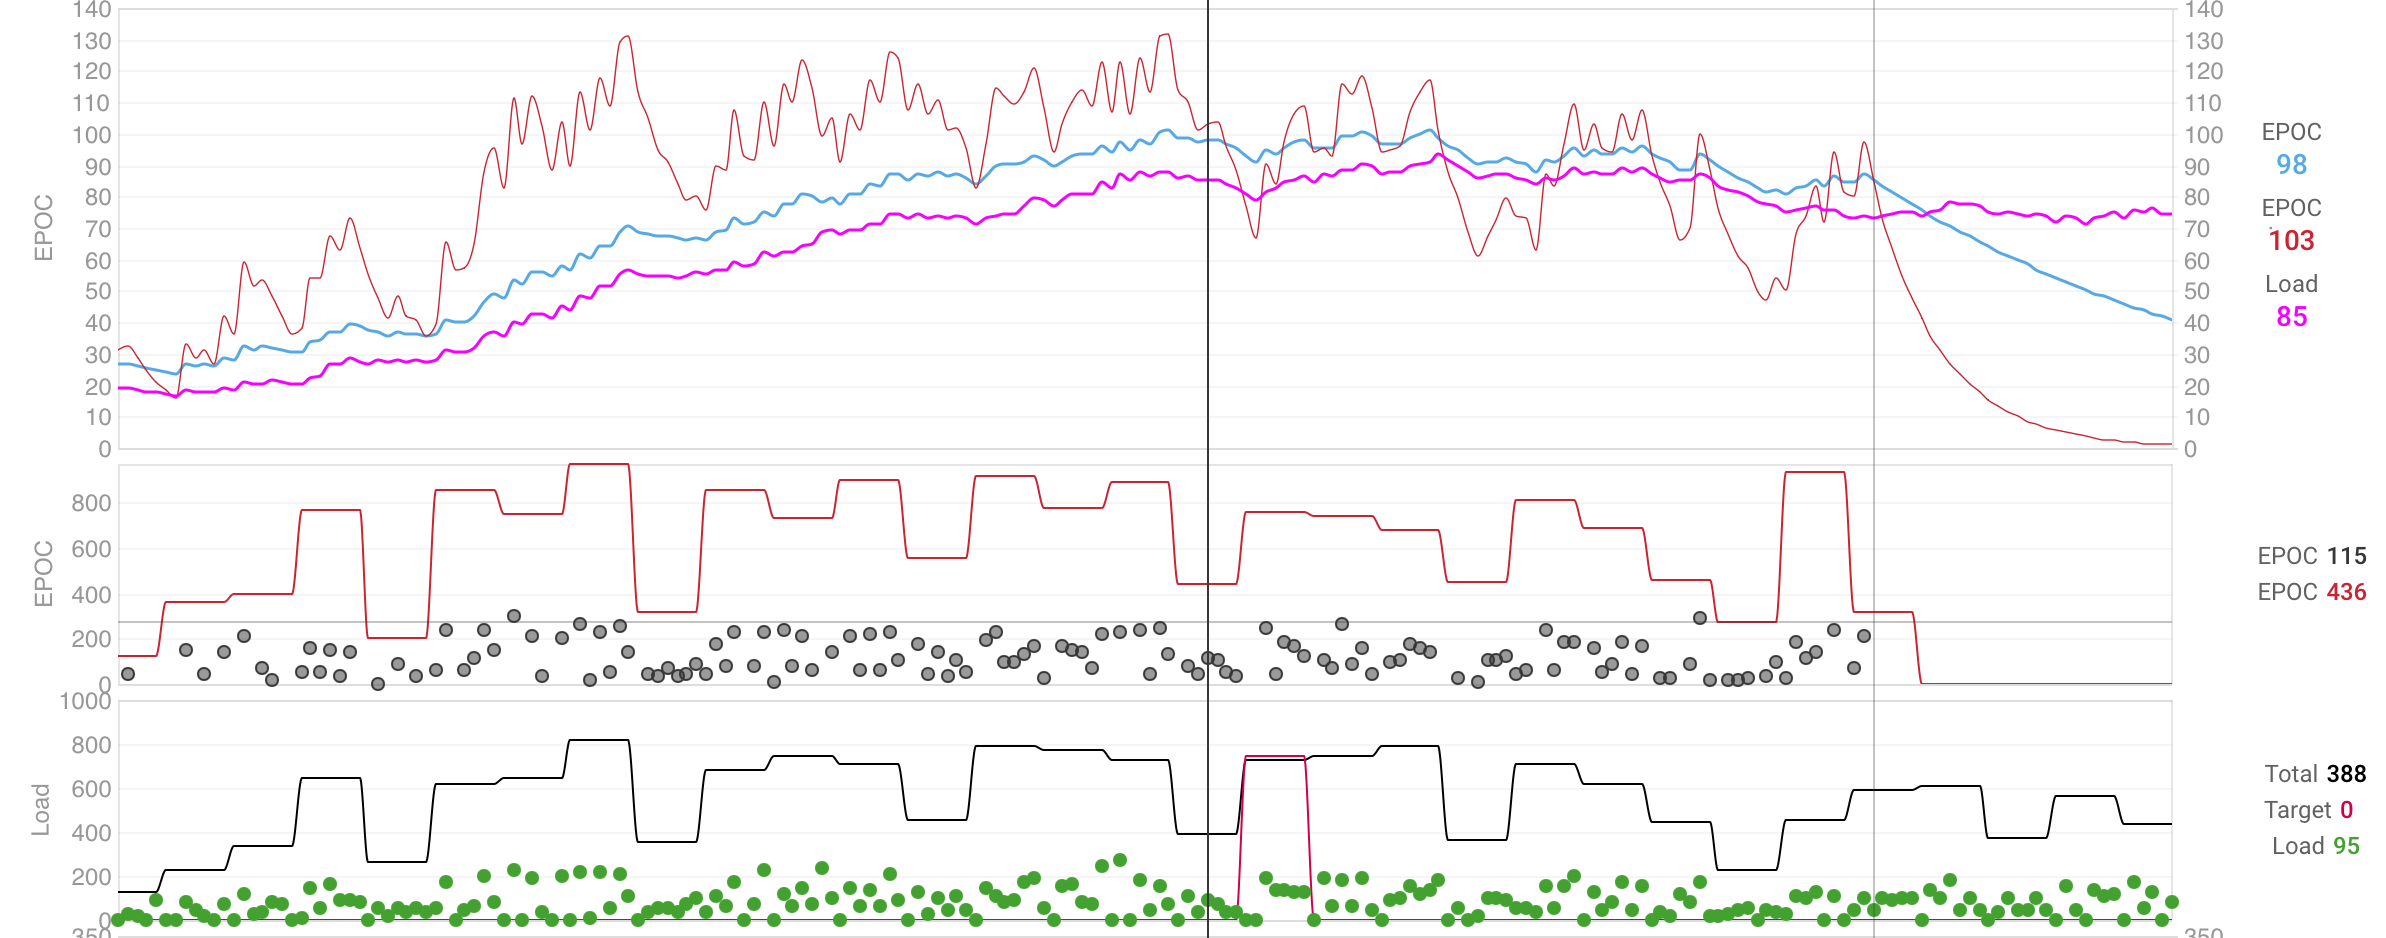
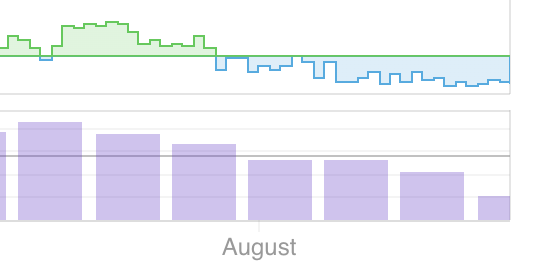
I made a graph of EPOC similar to TSS Load/Fitness (42 fitness avg) EPOC blue/TSS pink
During a season they are more or less similar, epoc being higher. But what is new to my and the whole reason why I did that graph, is a huge difference in my last weeks (starting vo2max block). TSS is showing dropping Fitness, and EPOC is showing a very hard week relative to prev weeks.
.
Not saying that one is better then the other, but I was trying to figure out how can I keep my TSS graph from droping that much during VO2max block where I need like more recovery than ever and can’t ride weekly TSS load (was frustrated by that). And I think EPOC can be an answer here. TSS just underscore harder workouts (for me) and I should be more relaxed about TSS graph. Don’t know how EPOC is calculated but it somehow takes into account starting fatigue from a system (ana/aerobic) being just started to be work on.
I think RPE is a king again
PS For easy biking the difference is not big I think.
PS2. If you’ve got 120h reco time, there is something incorrect in your planning/consistency
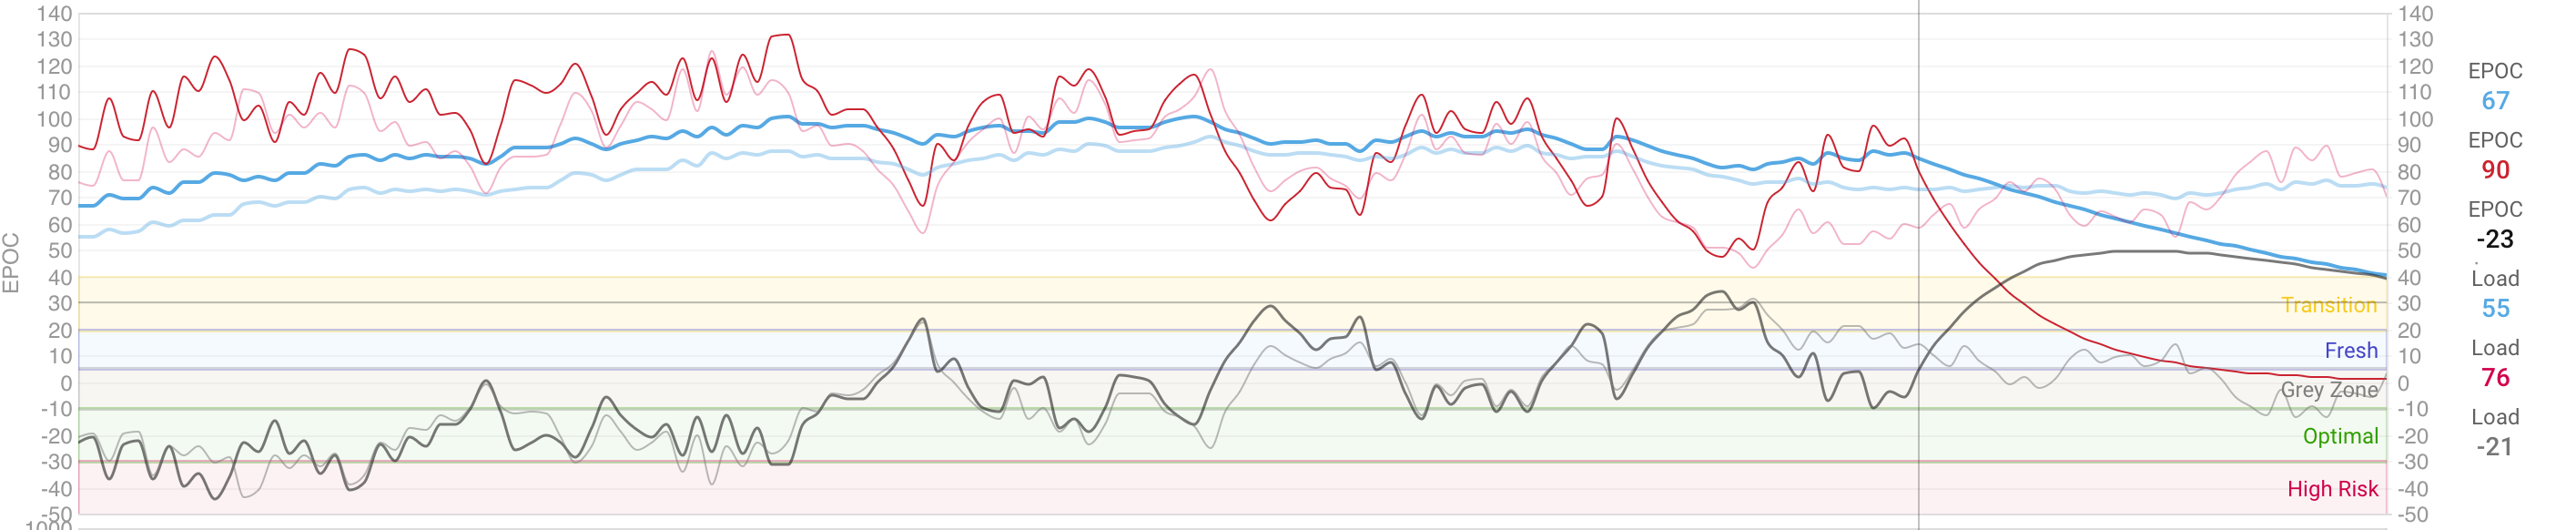
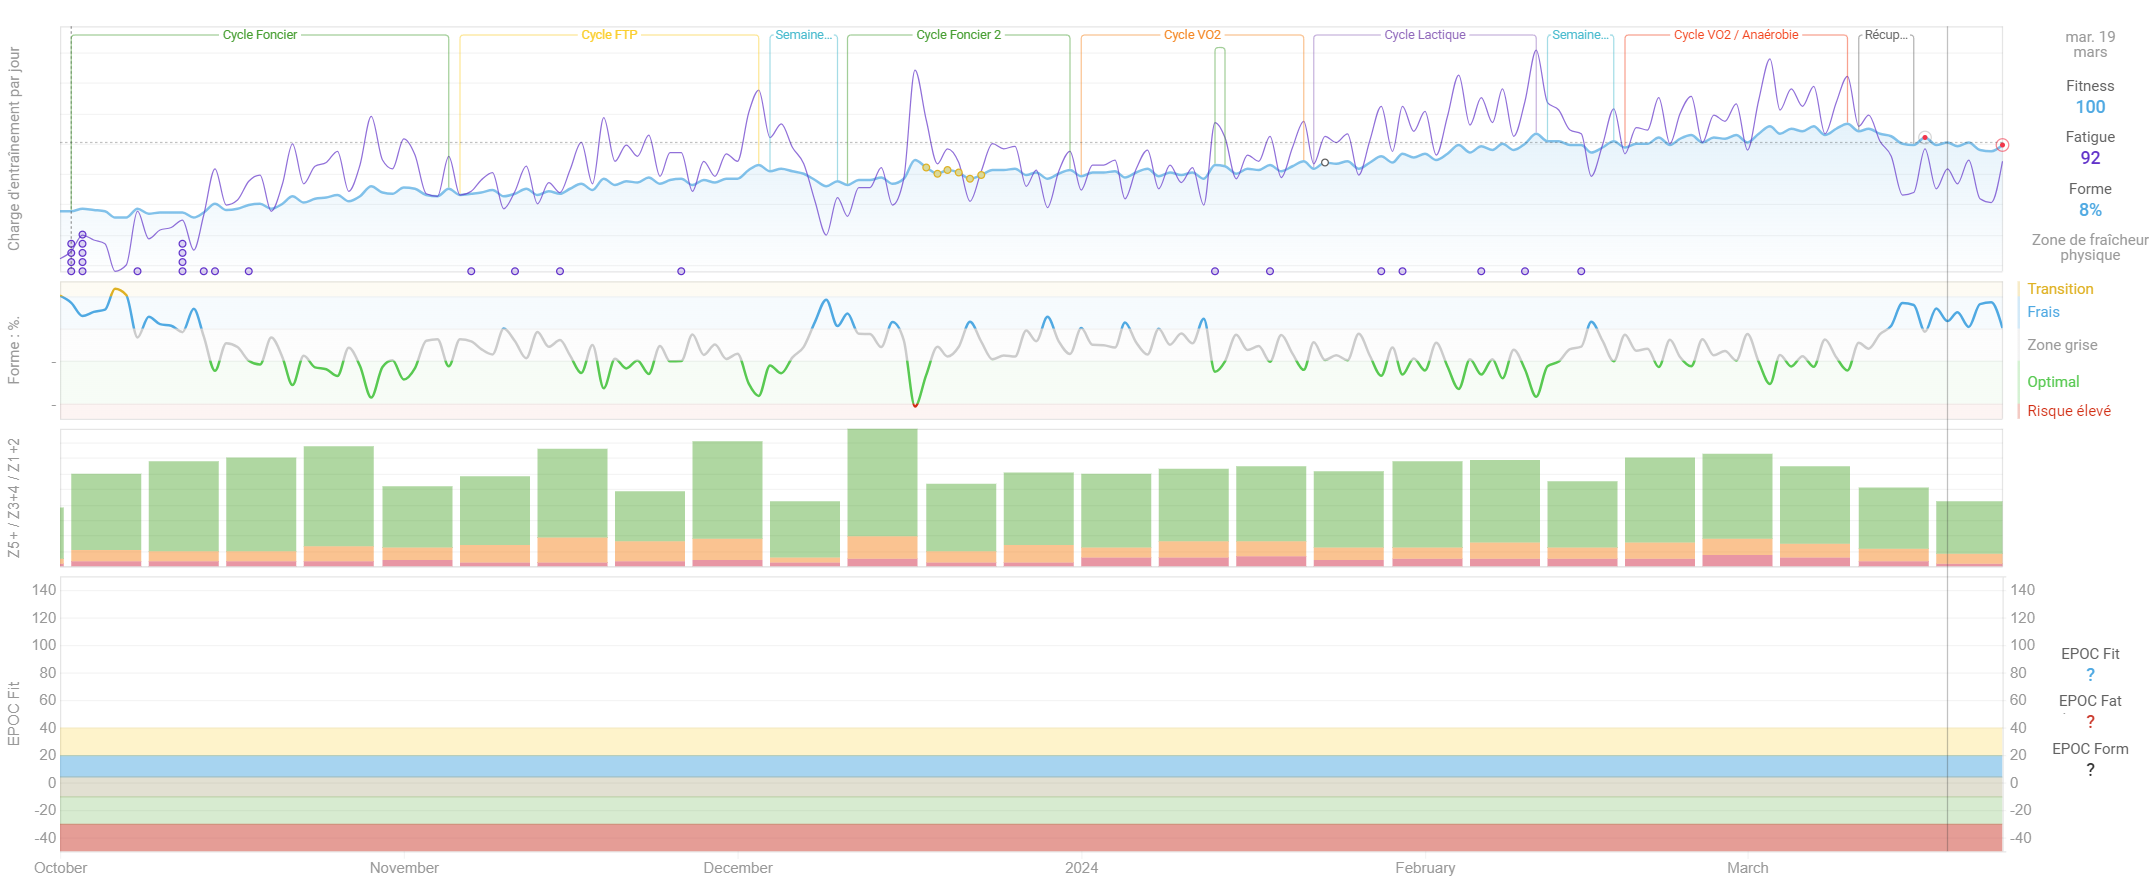
@david Don’t want to start a new topic. Just a question, is it possible to add an Epoc Form (42fitavg-7fitavg) as a choosable graph plot? Same as Form plot just taken from EPOC? I could add it then on my graph to further investigate my RPE vs Epoc Form
“EPOC form” probably needs to wait for computed longitudinal wellness fields. I can’t think of a neat way in the UI to create plot row that is a function of other plot rows.
I thought maybe you can add it here as a hardcoded Form to chose and it would be just 42avg-7avg.
Ofc I don’t know the internal structure of intervals.icu backend so fully understand that what sounds easy for me can be hard to implement
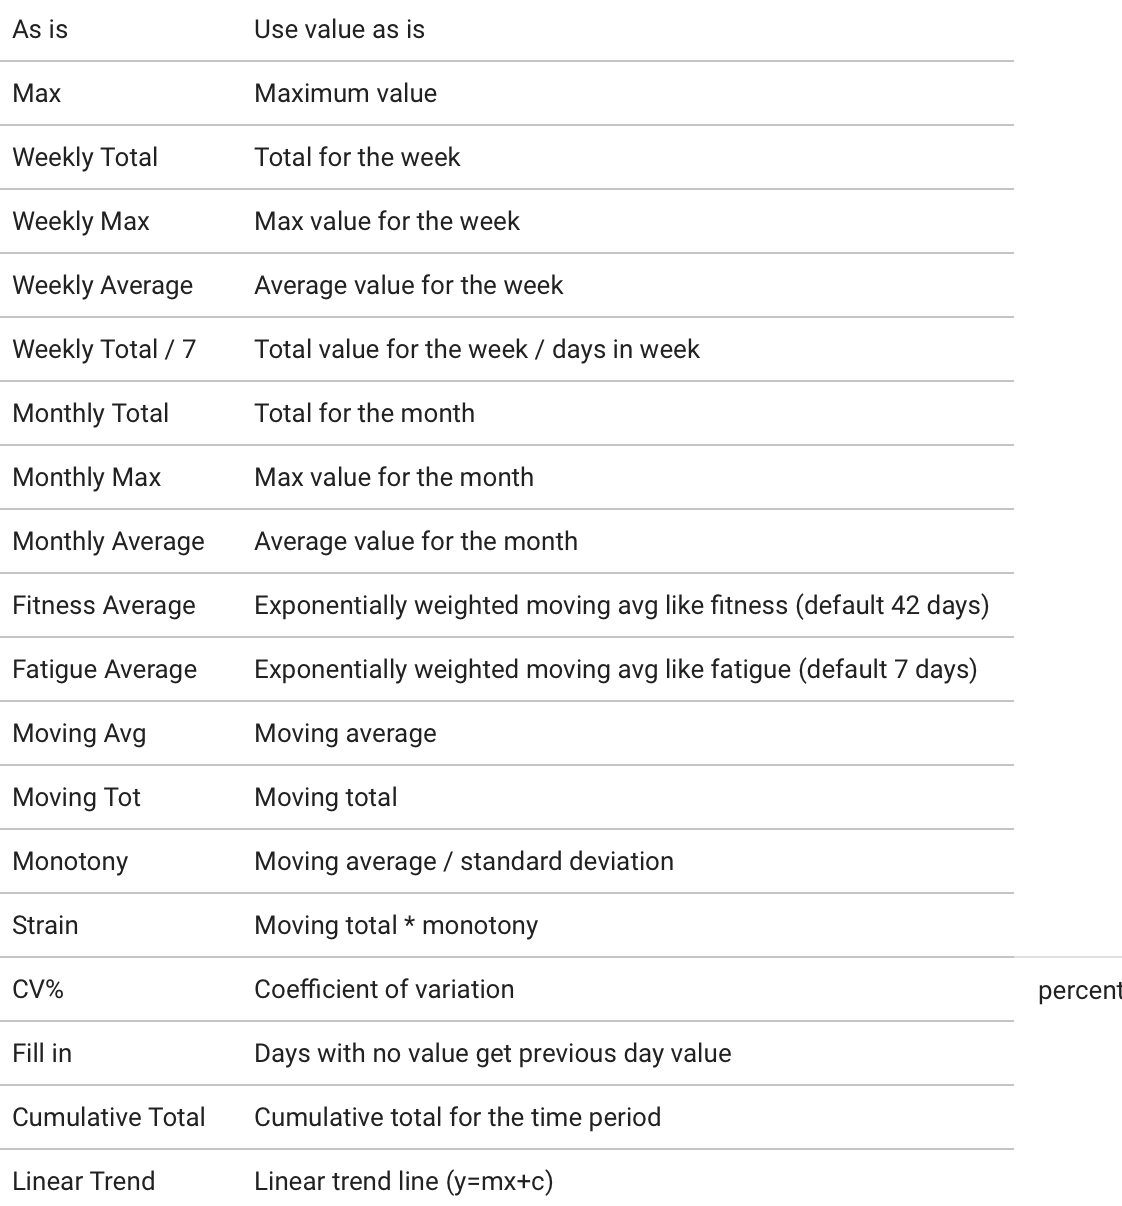
How can I get this graph please?
I tried adding a custom graph but it doesn’t work. I thought it was because my activities were imported from Strava and not Garmin so I deleted them and imported from Garmin but without success.
 . The last several months been trying to focus on 80% Z2 which is easy the hard part is getting the other 20% correct to keep VO2 & Threshold efficient.