What’s most impacted by age, is recovery.
I’d rather suggest to increase the fatigue constant to 9 or 10 days iso modifying the fitness constant.
What’s the point of entering a date? I changed fatigue from 7 to 10 and entered a date of August 10 but there was no change in the graph. When I looked again at where I entered 10 it still 7.
I think you are also experiencing the bug described here
Must be fixed now. I just tried it again and did not need to move the entry. I did not even know how to get back to it to edit it but I saw it on the timeline with the correct number and it did move my fatigue line down a bit (or raised the fitness)
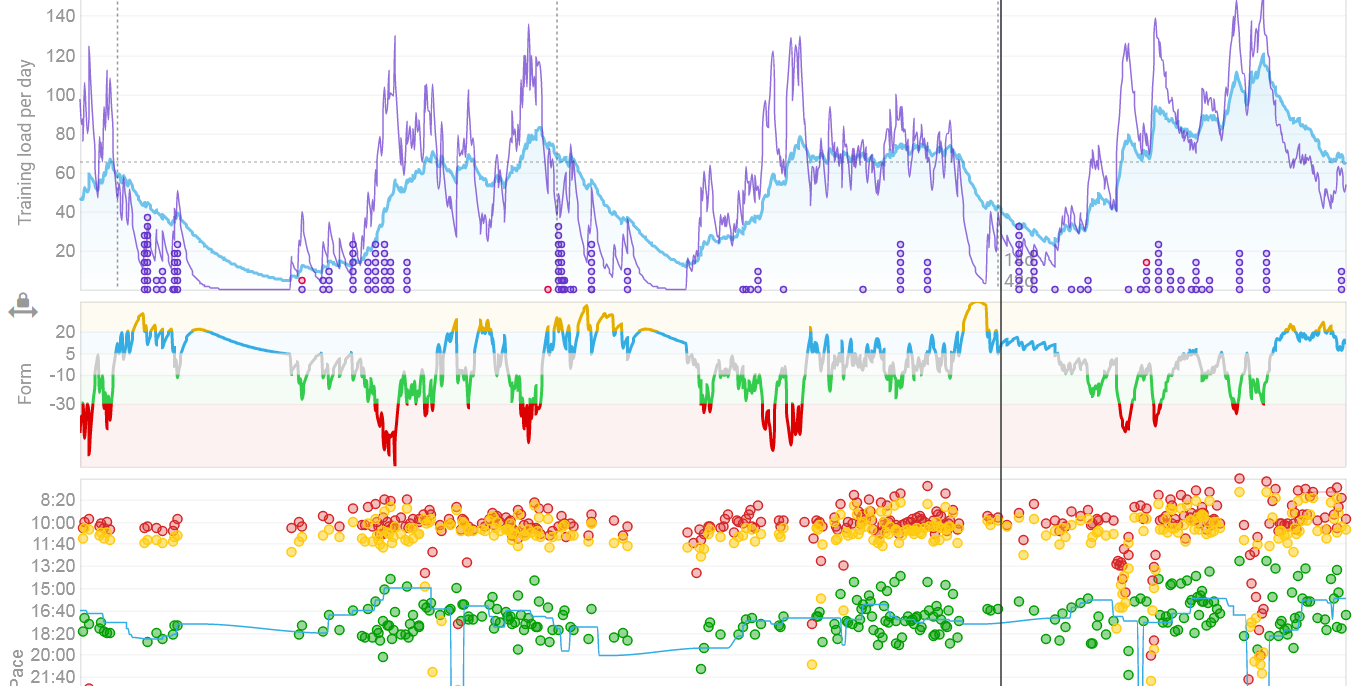
It flattened the “Form” and eliminated a lot of what was deep into the red zone. What happens if I change “Fitness” to a longer or shorter period? It did look cool with all that red zone on the graph though :o)
Great guide — thanks for putting this together. Understanding how your fitness metrics change over time is key. For example, weekly calorie balance (intake vs burn) can really clarify what’s actually happening behind the scenes when you look at your fitness, fatigue, and form chart.
Whenever I’m unsure of a snack or drink’s impact, I check it on the Starbucks Menu Calculator it helps me keep things consistent with my data.
Would love to see a future feature where Intervals displays “calories in” alongside “calories burned” by default for better clarity.
The Fitness page on Intervals is great for tracking fitness, fatigue, and form. Along with these metrics, recovery and flexibility are just as important. On my website Stretchlee, we share simple stretching and mobility routines that support faster recovery and help athletes stay consistent with their training while following data-driven plans.
Is it possible to hide the explanation text under the fitness chart? I’ve searched everywhere but haven’t found a way yet
Hello all, is it possible to create multiple fitness pages with a different period?
I wanted to set up a yearly overview of fitness and a current + next month fitness page for proper forecasting.
Every time I change the period, it is changed on all fitness pages.
Can I do something to make this work? Thanks!
That’s not possible.
You can use the quick buttons at the right of the date range to quickly switch date ranges used recently.
This Season - One month - Next month, etc…
Is there a way to “hide” planned workouts from certain charts/graphs? I would like a graph that shows my weekly distance ran, but not show whats planned for the rest of the week/month/year/whatever.
On which charts/graphs?
The standard behavior for distance is what you’re asking. Distance ‘covered’.
There’s also Distance target, which is the Weekly target (not planned on workout but general loose plan with a week target).
This Fitness chart for example shows the Distance covered and the Weekly target for Run/Walk/Hike. There’s a planned 10k run 2 days ahead, and that’s not showing up because it hasn’t been done yet.
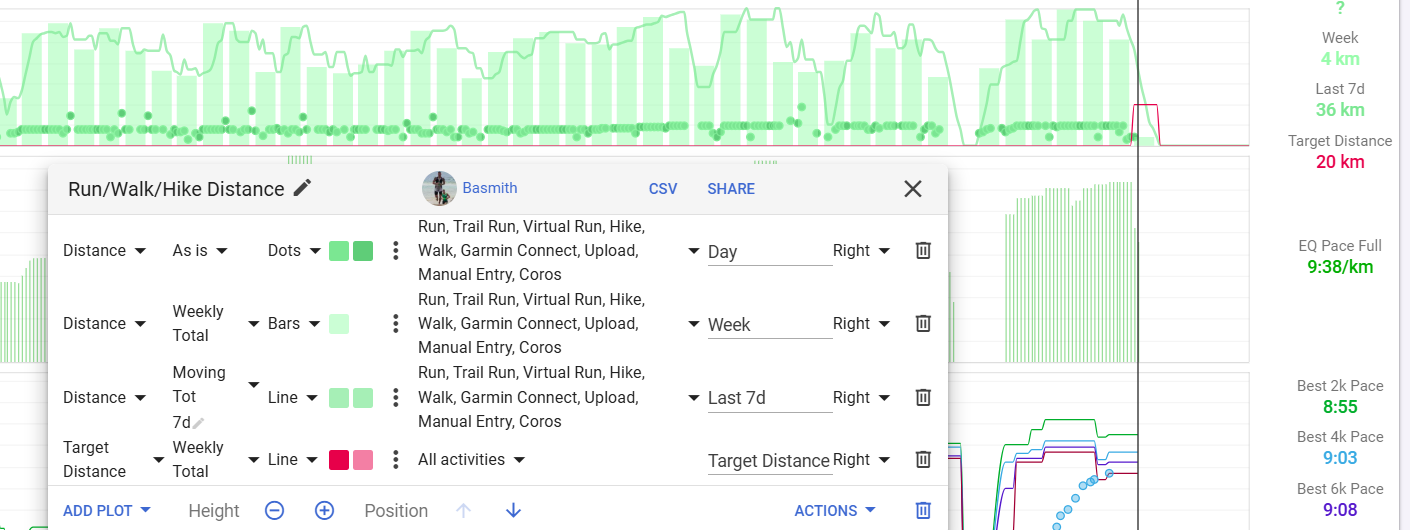
This it what it looks like to me:
(just marked roughly today with the red marker)
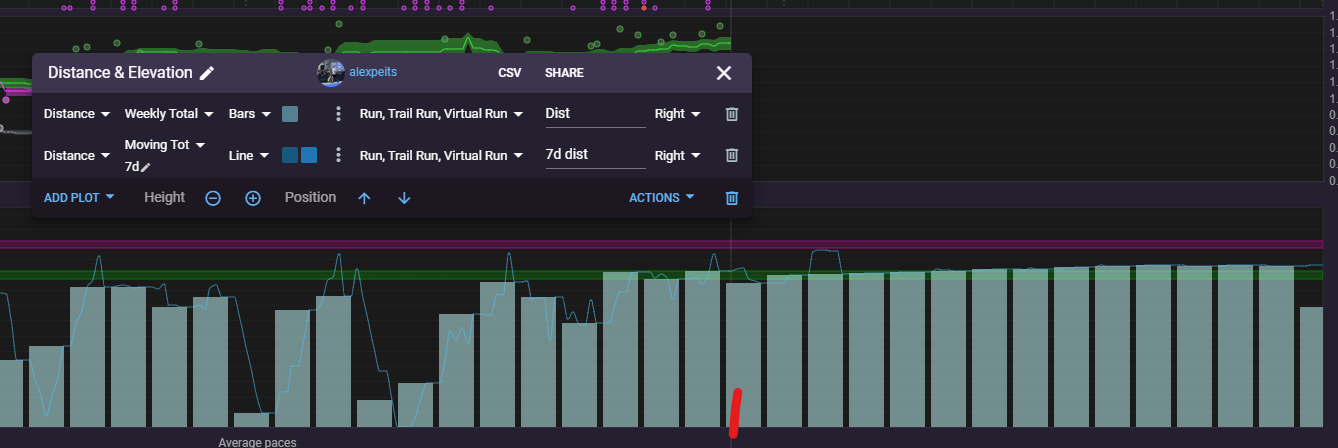
Edit: It looks like your chart has a Device filter, so that’s what filters out planned runs. I could do something similar.
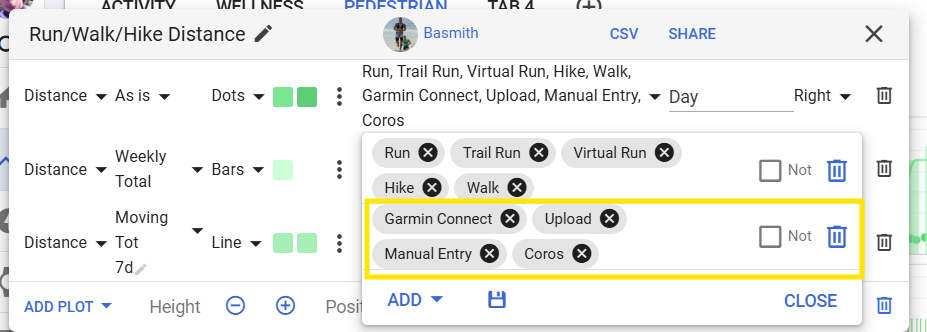
Oh, right! I forgot that I found a workaround for that by adding a filter specifying the source(s).
If you only count activities coming from your possible sources, the planned stuff is not interfering.
2 Likes
Yeah, figured it out from your screenshot eventually thanks! Made a filter that filters out anything with cadence less than 1.
1 Like