Looks like stacked bars isn’t working for daily ‘as is’ values.
But I was able to get around that by using Moving Avg or Moving total with the averaging period set to 1.

1 Like
Thanks for the suggestion. It doesn’t seem to work for me though. I can get HR 1+2, HR 3+4 and HR5+ to stack with as-is values, but not with my custom values (as-is or moving 1d ave).
It’s ok though, the data is there, it doesn’t really matter if it doesn’t stack.
Cheers
The Fitness page chart takes the planned, not-yet-recorded activity of the day into account when drawing the graph. Is it possible to toggle the inclusion of planned activities?
1 Like
How to plot daily average for custom fields from two separate activities?
I created a custom Select field “Excitement” for activities, with the values “1 - Meh”, “2 - OK”, “3 - Fun”, “4 - Epic”. When plotted as a dot on a graph it works fine except for days when I have multiple activities. It seems to add the numbers together and show “5” instead of an average of “2,5”. Shouldn’t I use Select fields for this purpose? Looks like the standard field ”Feel” shows an average score with the same settings in the graph.
(And - AWESOME app!!! Found it yesterday and it’s amazing!)
Edit your custom field, select description and change your aggregation from sum to average ![]()
1 Like
Thanks!!
I’ve searched but haven’t been able to find my situation. I had major surgery in April and was unable to workout for a few weeks. It involved my heart, so my HR zones and FTP metrics are now different. What’s the best way to reflect this and to essentially start from zero without disturbing my prior fitness data? I tried using a calendar entry to set Fitness and Fatigue to 0 on the surgery date, but it didn’t change anything in the Fitness tab, and now I’m working very hard on my recovery and it is barely registering.
You don’t need to start from 0 fitness:
- Adjust your HR zones adjusted (in settings) to your new values.
- In list view (activities page), show all activities from your surgery date to your latest activity.
- Select all (tick boxes should be checked)
- Edit, update zones
FTP follows the same steps.
Have you been advised on your zones, or have you tested? Both HR and FTP works off threshold values, so you would need to adjust both.
All the best with your recovery.
I have the following loads for six weeks:
292 (completed)
321 (completed)
358 (completed)
400 (currently completing)
450 (planned)
500 (planned)
But my Fitness at the end of that will be only 41.
How is this possible given that 41 x 7 = 287, which is even lower than the lowest load in that series? Shouldn’t Fitness at the end of that be at least 55 considering that the average load across those six weeks is 387, which is 55 per day? I say ‘at least’ 55 because weighting should make it even higher, no?
My activities are spread across 5-6 days each week.
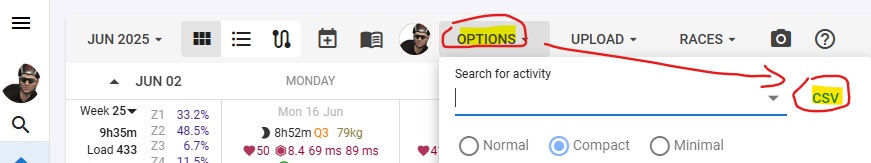
Download your activities (csv file) from the Options dropdown on the activities (calendar) page.
Open the file in Excel, or an online spreadsheet app.
Copy only the date and icu_training_load values to this file. Days with no training with show 0. It needs to be here.
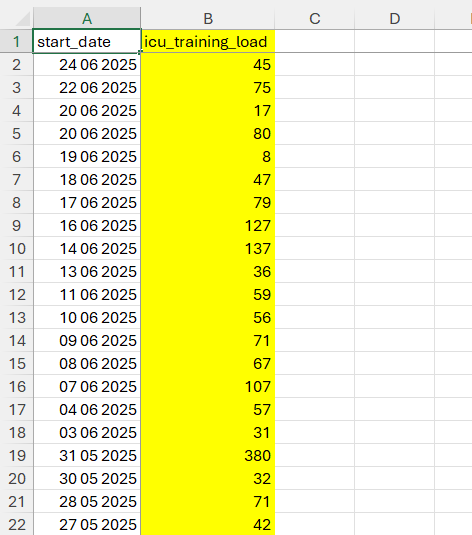
-
Use this file, on Google Sheets to paste the data and training load in the second tab (yellow).
Fitness-Fatigue calculation.xlsx - Google Sheets -
Enter your Fitness and Fatigue values that correspond to the date in row 23.
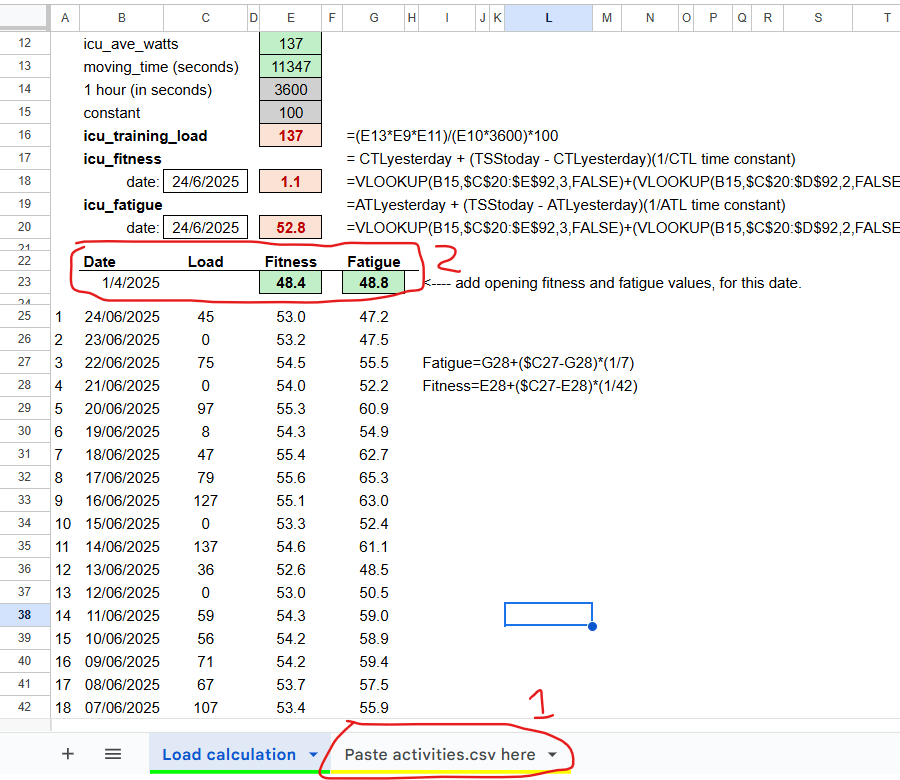
The fitness and fatigue values will show (newest to oldest order).
Fitness and fatigue for today should show in row 25.
This file was created for something else, but shows the same result you’re looking for.
Thanks but it’s not clear to me how this answers my question. I’m not looking for a result. Rather, an explanation for the result.
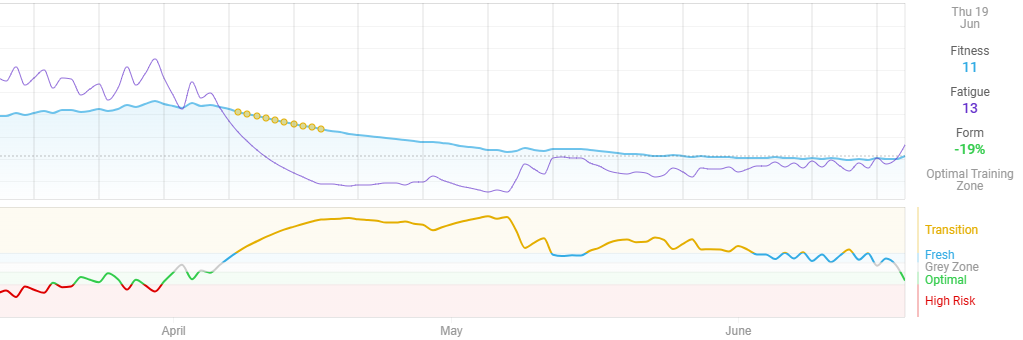
My Fitness graph’s future projection already tells me what my fitness will be after the 42 day training block, as I have entered the future activities into my calendar with the planned load. I’m looking for an explanation as to why it doesn’t seem to add up.
Fitness is a 42d weighted average. The weighted here means that the oldest activities don’t count for their total load anymore but only partly.
Look at it like this:
If you do a 200TSS load today and then nothing anymore for the next 41 days, would your fitness have increased after those 42 days? If so, it will be a very tiny bit. It’s not like you put 10L of water in a closed can where the 10L will still be there after 42 days. Your body increases it’s functionality because of the applied load, to prepare for an eventual repetition. If there is no repetition, your body returns to its initial state. The goal of consistent training is to repeat and increase that load in a balanced way, so that it can sufficiently recover and build a higher functionality. The Fitness number represents your ability to take on a certain load, and that’s what you’re building up.
Yeah I get that it’s weighted toward more recent activities. I mentioned that in my original post. What I’m looking for is a simple (if possible) explanation for the actual numbers that I provided. Correct me if I am wrong, but I think I have read elsewhere (from you?) that if you do a load of e.g. 40 every day (280 per week) for 42 days, then your Fitness will be 40. As you can see from the numbers in my original post, I would be doing much more than that, especially in more recent activities as the load starts at 292 in the first week and increases week on week up to 500 in the sixth week, and yet the projection says my Fitness would be only 41 at the end of the sixth week. It doesn’t add up to me, so I’m trying to figure out what I’m missing here.
The formula works on daily numbers not weekly totals. In order to help you, and explain using your own data, you need to share the daily numbers from the last 84 days, and also the value you want to project going forward.
You could do the math with @Gerald spread sheet.
But as an example week.
Let’s take your next week and an example Fitness of 30.
If you distribute it to 7 workouts equally:
450/7=64,286
30+(64-30)/42=30,81
30,8+(64-30,8)/42=31,59
31,6+(64-31,6)/42=32,371
32,3+(64-32,3)/42=33,0548
33,1+(64-33,1)/42=33,836
33,8+(64-33,8)/42=34,519
34,5+(64-34,5)/42=35,202
If you do only one workout
30+(450-30)/42=40
40+(0-40)/42=39,0476
39+(0-39)/42=38,0714
38,1+(0-38,1)/42=37,193
37,2+(0-37,2)/42=36,314
36,3+(0-36,3)/42=35,436
35,4+(0-35,4)/42=34,557
So the result is nearly the same. But
450/42=10,714 won’t up add these 10 fitness points to your value. Because it’s always subtracts the old value too. You won’t make a jump from 30 to 40.
You could roughly calculate it weekwise with a starting value of 0:
0,865 * (0 + (292-0)/42)=6,0
0,865 * (6,0 + (321-6,0)/42)=11,7
0,865 * (11,7 + (358-11,7)/42)=17,3
0,865 * (17,3 + (400-17,3)/42)=22,8
0,865 * (22,8 + (450-22,8)/42)=28,52
0,865 * (28,5 + (500-28,5)/42)=34,363
If your fitness was higher than 0, your fitness value will be higher too. So the values seem plausible to me. (The factor 0,865 is (41/42)^6 assuming you doing only on workout a week with your defined work load as a simplification).
And this is the simplified formula if you distribute your workouts evenly on 7 days:
f7 ≈ 0,84651⋅f0 + 0,15349⋅l/7
f7 is fitness after 7 days, f0 is starting fitness, l is weekly load. Result will nearly be the same as above.
It depends on your starting fitness value.
Your eye for detail (as you wrote elsewhere ![]() ) is missing an important fact. Every day’s Fitness value carries a 42 day history component. If you start from 0, the first value has no history at all and the rest only limited history.
) is missing an important fact. Every day’s Fitness value carries a 42 day history component. If you start from 0, the first value has no history at all and the rest only limited history.
So basically the (quit complicated) math formula takes into account every load ever done, but the impact of those that are long ago becomes less and less.
This is some quick and dirty math out of the top of my head that I regularly use to get a rough idea of where the user approximately sits regarding Fitness. It will work more or less ok for those with a history of more then 3 months and a Fitness value in the order of 25-100. On the extremes it does fail…
The next lines are not specifically for you, so please don’t take it wrong, it’s more a general remark.
Sometimes I wonder if people here on the forum think that we have a glass ball. We are constantly trying to, first, understand what the user is asking, what he may have as as a problem and what could be the answer or solution if the above assumptions were correct. Some questions posted over here have almost no information and we need to start hunting for it to be able to answer. So once again, I would like to kindly ask to give a better description of the problem, a rough idea of the actual situation and all eventually relevant information. And screenshots are usually the best sources for us to evaluate what is going on. This will serve better for all users and moderators.
In your case, the important factor that was missing, was your starting point of 0. And I probably could have guessed it if I was paying more attention.
A second remark is that the Fitness chart is not something that was developed by/on Intervals. It is a math model that exists for over 3 decades and is widely used by all main analysis suites. If you want dig deeper into how it works, launch an Internet search for PMC chart or ask an AI engine. The PMC chart is really a very nifty piece of math.
Thanks to you all.
It seems where I went wrong was in thinking that anything older than 42 days is not part of the calculation. I was thinking of it as a shifting window of 42 days, where only loads from activities within that window count (with weighting). That’s why I didn’t mention anything about starting fitness / loads prior to the 42 day training block, as I thought it was irrelevant.
Apologies for not including screen shots in my original post.
1 Like
This was a good question because I learned the same thing you learned by you asking it. I also thought it was a shifting window of 42 days and now I know better.
Thanks MedTechCD. Lots to take on board to align reality with the graphs…but thank you for your reply. ![]()
What would be a good number of days for someone that’s 70 years old? All 70 year olds are not the same but we all respond slower than young people so I’m wondering what would happen if I set mine to something other than 42