Hi everyone,
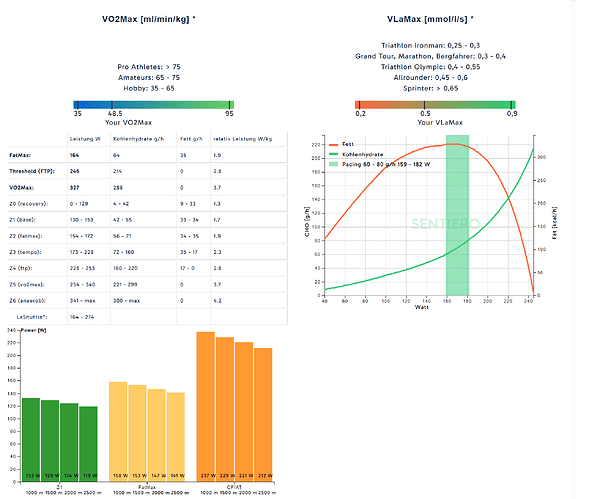
I’d like to suggest a new feature that could be a valuable addition to intervals.icu: the integration of a metabolic profile, similar to what is shown on platforms like Sentiero (see attached screenshot).
The key idea is to visualize FatMax – the point of highest fat oxidation – and show how much fat vs. carbohydrate (CHO) is being burned across different intensities or power outputs. This type of data can be incredibly helpful for endurance athletes looking to fine-tune their training and nutrition strategies.
Specifically, it would be great to include:
- FatMax: The power output (in watts) where fat oxidation is maximal.
- Fuel utilization curves: Graphs showing CHO and fat usage (e.g., in g/h or kcal/h) depending on wattage or intensity.
- Training zones: Clearly indicate zones (e.g., Z2, Tempo, Threshold) and how fuel usage shifts across them.
This is currently well visualized in Sentiero’s metabolic chart (see screenshot), and having something similar natively in intervals.icu would be a major upgrade for those of us who monitor not just performance, but also energy system efficiency.
Thanks for considering this feature – I’d love to hear what others think!
Best regards,
Andreas
P.S. Of course, truly accurate values can only be obtained through proper metabolic testing (e.g., lab diagnostics). However, with the wealth of data available it might be possible to get reasonably close — or at least provide useful estimates to guide training.
