Topic bump.
Still triggered by this chart provided by @RIDUCK .
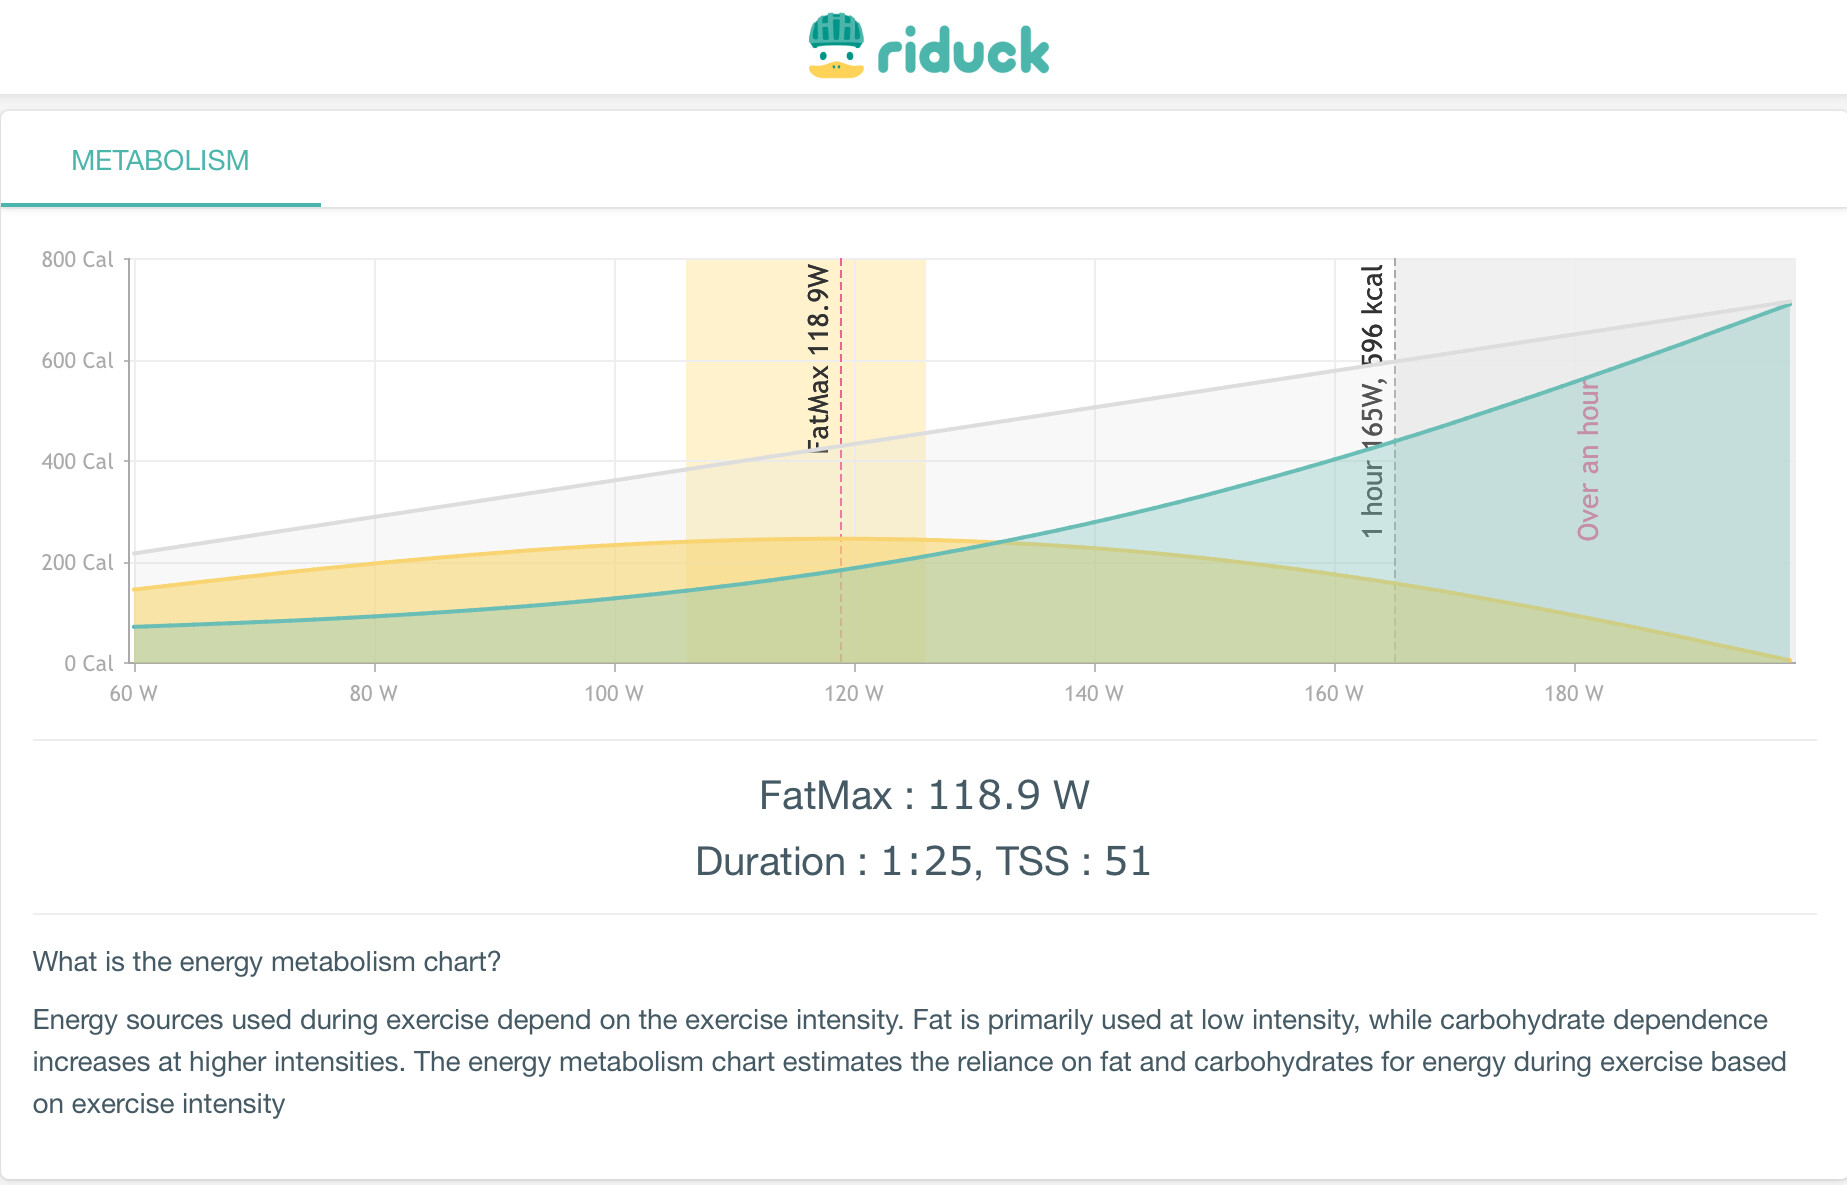
Especially for Z1 rides, the (calculated) LT1 value is interesting. But also the LT2 value how it relates to your threshold values from testing.
Ps. The chart above isn’t up to date as I don’t upload data to Strava anymore ![]() @david would be nice to collaborate with @RIDUCK
@david would be nice to collaborate with @RIDUCK ![]()