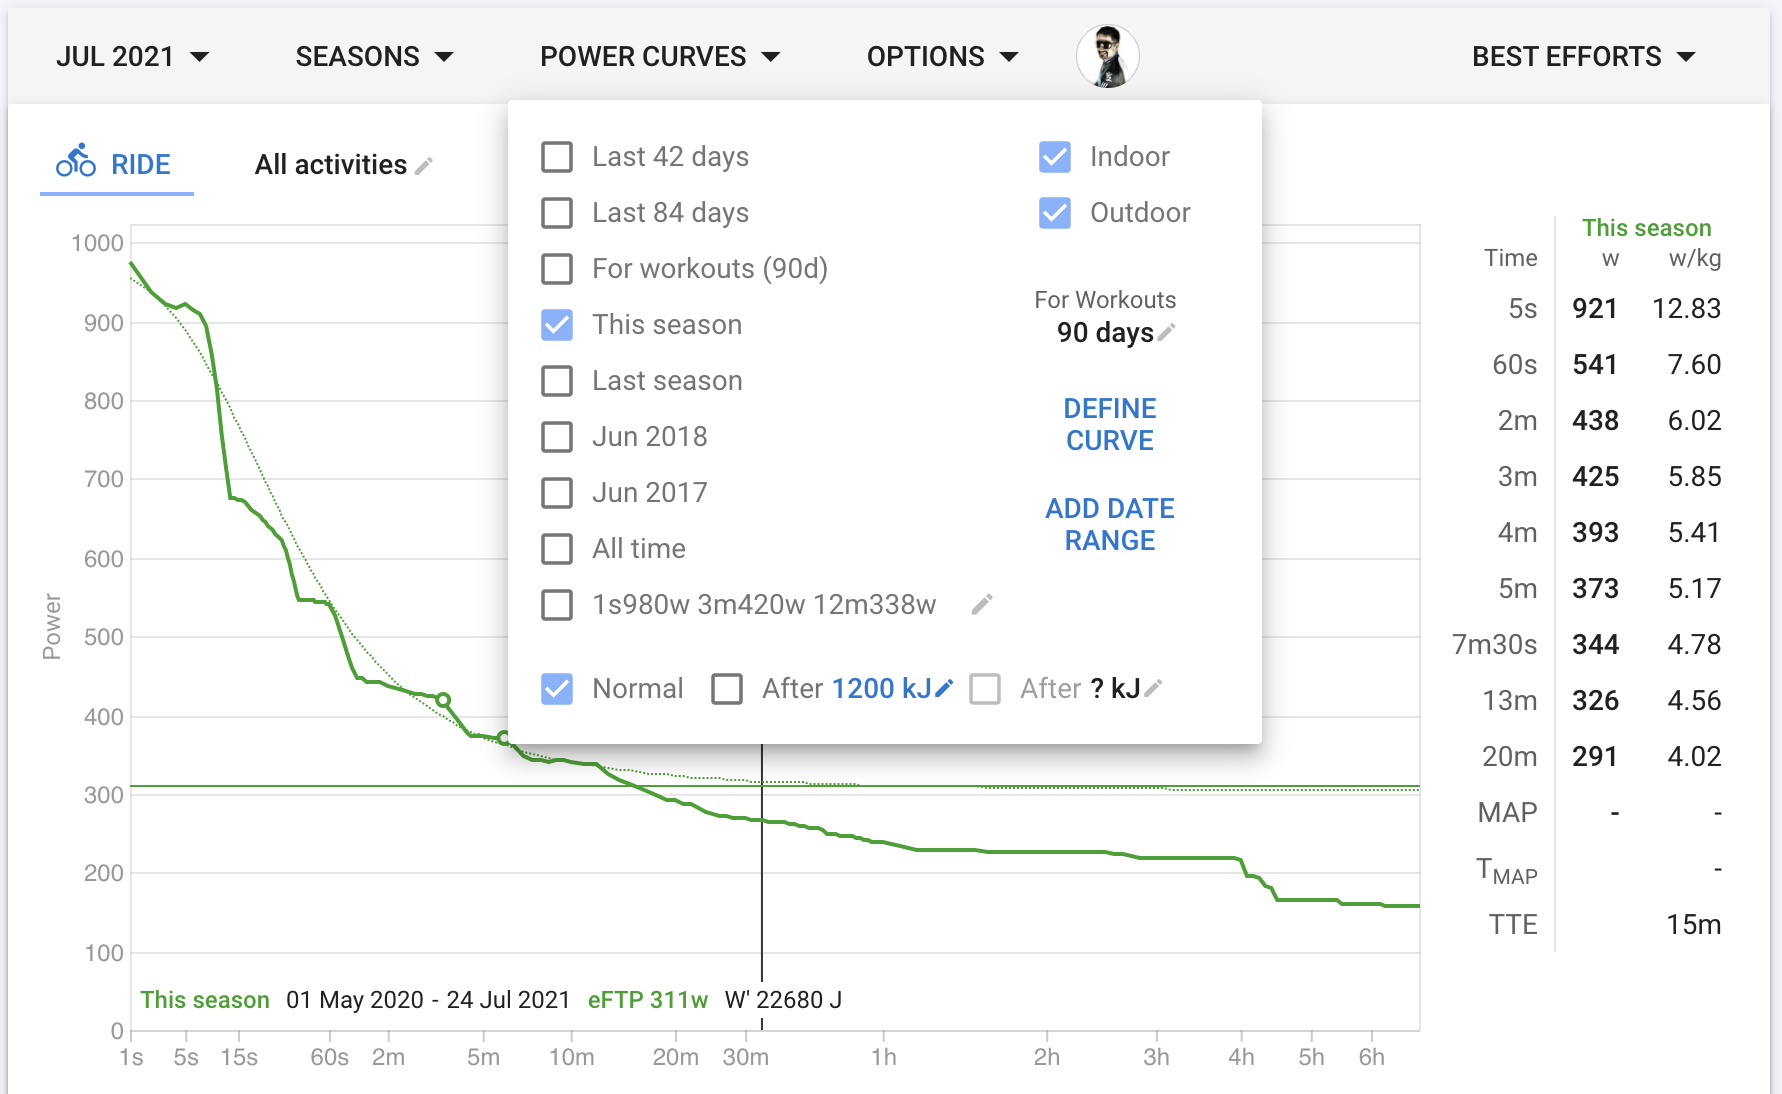
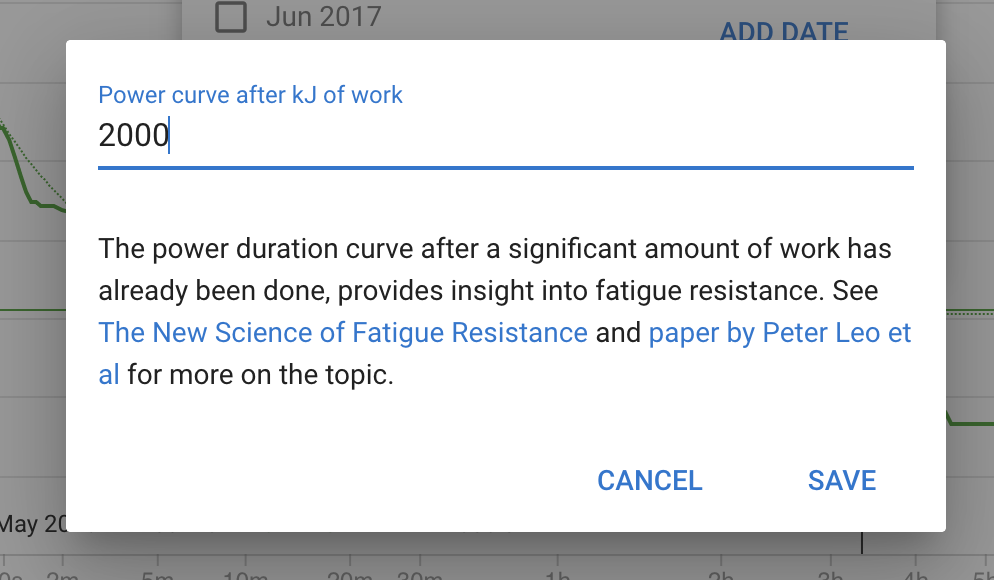
Intervals.icu can now plot power curves after a certain amount of work (kJ) has been completed. This useful to track how well an athlete performs when in a fatigued state. See The New Science of Fatigue Resistance and paper by Peter Leo et al for more on the topic. Tx Peter Leo for encouraging me to get this done finally!
I’m just putting on a thinking hat to address two issues regarding fatigue resistance, after my recent experiences doing 3 week stage races for science (that’s a whole other story) :
Issue #1 : We might say that the PDC (power duration curve) from sitting and cruising along in a peloton of riders at say 45kph can be more “dampened” than trying to do the same effort alone or in a small group. In other words, how the race in a mass-racing situation actually plays out impacts the PDC profile. So could that be a confounder? The original paper from Leo et.al seems to be looking at professional riders in racing situations.
One day can see lots of “hits” on the PDC, one day is kind of like “hardly doing any work”, so to speak. With that idea, how do you compare two riders from the same race, one who was “doing lots of work” with one who was smartly sitting in a bunch cruising along? Or comparing groups of riders from different racing situations?
Issue # 2 : Would this feature help identify fatigue from successive days of stage races? In a 3 week Tour for example, from Day 1 to say Day 21, you see 1000’s KJ of work everyday. It sounds like the feature would do the trick if it lets you identify a “season” of stage racing but then thats not really a season, rather a window of racing days.
Regardless, it seems to me issue #1 would still affect things quite a bit.
Btw, I see that Alex Hutchinson addresses this also in his blogpost, without any clear answers.
Hi Ron,
as you most probably know, the PDC does show only the respective maximal values for a given duration - not how many nearly as or exactly as high values for the same given duration. I.e. the repeatability capabilities of an individual athlete. Or - indeed - not the capabilities but the requirements of the race, the given stage or any other period from which said PDC is derived.
E.g. if my PDC of the last 3 months doesn’t show any wattage higher than 300 watts for 5 minutes that doesn’t mean I couldn’t hold it. Just that I didn’t do any effort in that range for any amount of time.
Now - in the article we can conclude that they must have used PDCs for the respective stages and that these stages must have had enough different power requirements for often enough occurances. Not surprising - if it isn’t a transfer stage snooze fest with a break away a normal road race is a very stochastic event.
So - most probably ample opportunities to build some meaningful PDCs for fresh, 1000, 2000, 3000 etc. calories burned.
And - of course - if the stage isn’t as hard, those 3000 calories are burned later. If it is hard, they are burnt faster. Or if the rider was sheltered in a peloton, they are burned later. If the rider is in a 3 man breakaway they are burned faster. In the latter case you could probably even say that both efforts where comparably even paced. One harder, one leisurely. While in other cases it would be pretty different with lots of hard accelerations and matches burned for the same calories as for another riders even paced effort. But… you have to start somewhere and take one parameter to base your comparisons on. One such parameter is “calories burned”.
Makes a lot of sense to use it for such a differentiation of PDCs. Not only for stage races and between riders. But also for a single athlete along the course of a evenly or every time similarily paced effort or training activity.
Now - your issue no 2 is a good question. What discerns riders capabilities to cope with repeated hard days? Or even - much more interesting to me - moderately hard days but not for a puny Tour de France stage but for real ultracycling. I.e. 14 to 24 hours per day in the saddle moving. For days. How fast is the recovery when you factor in the possibility for an athlete to sleep and eat / digest off the bike. There will be also differences between individuals. What drives them?
So - most probably ample opportunities to build some meaningful PDCs for fresh, 1000, 2000, 3000 etc. calories burned.
I thought the U23 and older elites were racing two different races but having looked again into the study, it looks like the data were from the same races. My bad.
My next question is - what decides what is magnitude of the calories that need to be fixed to compare to groups of cyclists ? Does 2000 kJ correspond to … 1/4 , 1/2 , 3/4 of the total work..or?
Light weight riders may not expend as much watts as heavier riders to go from point A and point B, so if we use some arbitrary number, it could mean the latter half of the total stage-work for one rider, and something else for another? Does this make sense?
So instead of specifying the levels in kJ you using kJ/kg instead? Thats a bit tricky to do because of weight changes. I could do something in the input dialog showing that using the athletes current weight.
I think that kJ works fine - if I’m looking at the energy requirements for a race then usually that’s just kJ. kJ/kg seems like it’s complicating matters - unless you’re comparing athletes, I’m not.
As @John_Nye mentions, this is exactly correct. If you want to just see relative change in your own abilities, you can use absolute kJ. If you want to compare yourself against others, then the kJ/kg becomes better at standardizing. What might actually be the most useful is the percent loss of maximal Power after x kJ of work. As an example, if after 2000kJ of work, your loss of power is 10% for a 5 minute effort, you can see if your training is working to reduce that loss of power. Percentage of power lost at 500kJ increments could be a great curve to build to see where your fatigue starts to really affect your maximal performance. Hope that makes sense!
Over the last couple of years has there been any improvements in that Intervals will now automatically calculate these fatigued efforts? Intervals of course knows all of my efforts in Watts and Time - is it capable of determining these values itself?
Or is this something where the rider is expected to do a benchmarking test specifically for this fatigued effort evaluation?
My go-to calculation for racing these days. Is there a way to calculate this fatigue resistance as a custom chart on the Compare page? My teammates and I want a chart to see who is favourable to be our team leader for when the going gets tough in a race.
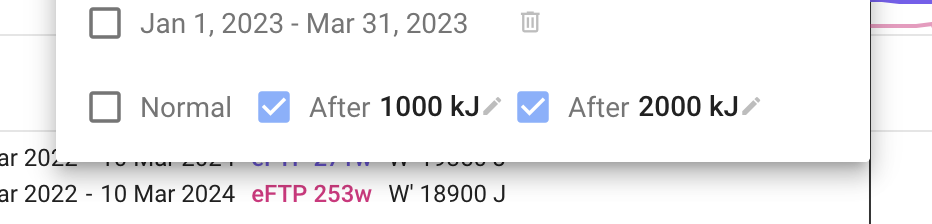
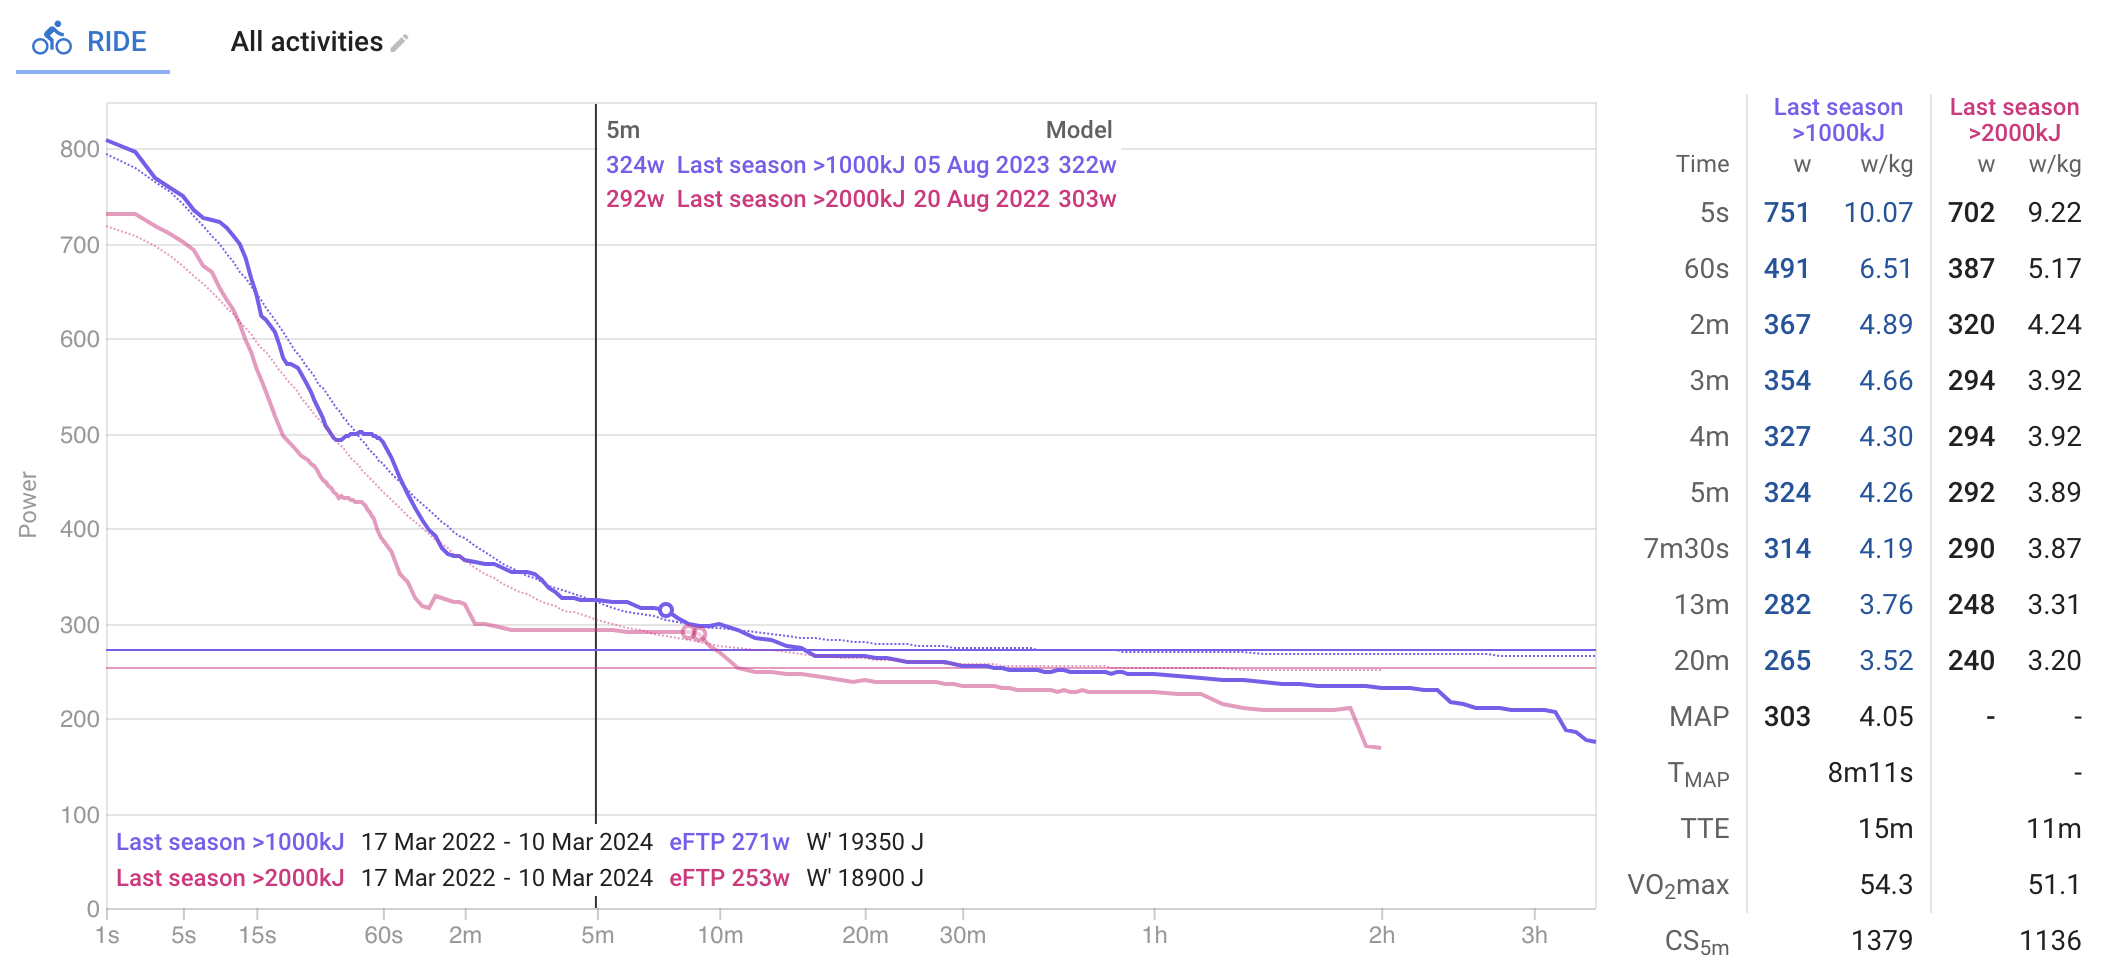
Not yet unfortunately. But you can use a couple of browser windows and read the power numbers you are interested in off the curve on the /power page or from the best efforts table. Also @Gerald you can edit both fatigue numbers.