Ok, thanks! I just typed in values until the numbers on the axis made som sense. Worked just as well but of course it’s better to actually know why what you are doing works.
Tnx. I’m getting somewhere. I’ve added the Custom Activity Field within an activity and that field is checkmarked for every running activity I view. I have added the field in column view BUT…
- the graph doesn’t show for all running activities
- in column view only three running activities for the selected date range actually have a value in that range.
- I can’t see a way to re-analyse in bulk from the column list view. I can only reanalyse from within an activity.
- I noticed that your run needs a certain time (or a % of total time, I’m not sure) in Z2 to have this field calculated.
- This is how you re-analyse in bulk:
Evolution of pace in specific HR zone over time plot - #8 by david
Thanks for helping me troubleshoot.
- Yup, all runs have Z2
- Not that the bulk activity verbiage is different than when inside an activity. Dunno if this is just a label difference but it didn’t seem to help the problem regardless, tho it did seem to analyse all the activities in the list.


Hi, new to Intervals.icu and loving this feature. I’ve got it working based on the instructions above, but I haven’t been able to get the Y axis to read values in min/km even though the actual chart is showing min/km values when you hover over a data point. Can anyone point me in the right direction?

I can confirm that @david 's version of Z2HR works significantly better (previously, some runs didn’t have any Z2HR, and currently most runs will track something).
@Matheus_Silva please consider updating your custom activity metric with david’s code: ~140 users now use your metric and could benefit from the updated version.
Thanks for setting it up in the first place!
Where do you find David’s version?
Post #5 just above in this thread:
I’ve also poked Matheus (via in-intervals.icu Chat) to see if he’s be willing to update his metric, as it would in my opinion be the most scaleable option for all.
If he updates his version, everyone will need to remove the Custom field and add it back. It will not update by itself, because as soon as you start using it, it becomes your own personal copy.
You could just as well create it yourself and paste david’s code on the script tab. Then share it.
@David Do you have any way to filter the activities in the custom activity field script to a specific tag or other custom property? (similar to the way you can change which ActivityType is included/ignored)
For example, I want to plot zone pace over time, but for trail runs they vary in how technical they are. I’d like to separate pace for technical and non-technical trail to separate fields.
Could someone help me with the code to create an imperial units version of AvgPace at HR Z2? Same thing as-is except units would be min/mile.


Awesome, thank you!
Just a note for anyone else who finds this thread, you will have to recreate the chart for it to take up the new units.
Good point!
You will need to re-analyse any activity to display the change because the value only get’s calculated at analysis time. You can do this in bulk from the activity List View.

I went ahead and copied David’s code (including improved run filter) over Matheus’ settings and called it a day, set to public too.
So three steps needed in total:
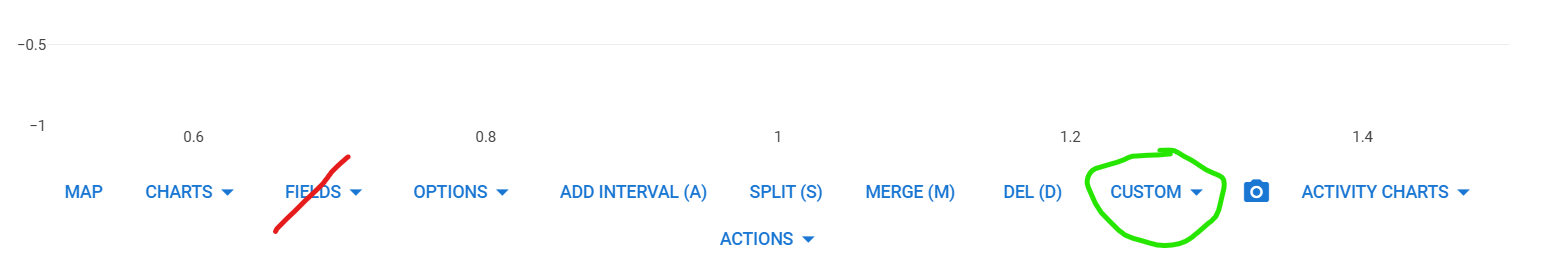
- Add custom field inside of an activity view → Custom → field search → AvgPace@HRZ2
- Select past runs that you want to show the value and click Analyze
- Go to fitness chart and add a new plot for it (whether points, line, as is or moving average – up to you).
- ???
- I said it was three steps, enjoy now!
Hi, hoping someone can help me with this!
I’ve created the custom field type and re analysed my activities for this year, so I can see the data for this field in each activity.
However when I try to create a custom chart (in either fitness or compare) the field doesn’t appear in the list, and I can’t add it to a graph.
Am I missing something really obvious, or is there some kind of bug at play?
Thanks!
Did you create the new field in ‘Fields’ or in ‘Custom’?
If you want to use it on the Fitness page, it must be created as a Custom activity field.
The ‘Fields’ are what is used in the data and header information. A Custom activity field will display in the summary on top of an activity and is available for the Fitness and Compare charts.
1 Like
Thank you! Yep, I created it in fields.
I’m pleased it was something so simple
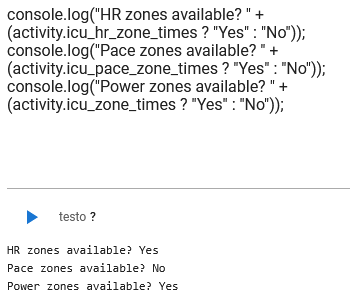
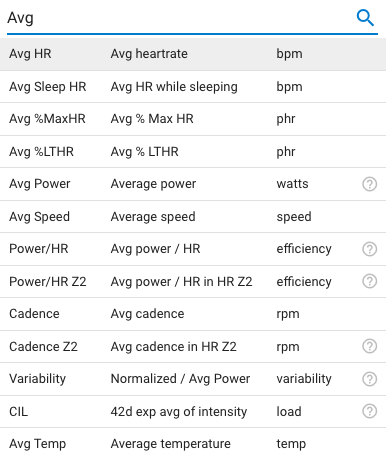
Hey I want to add a custom field showing distance and another showing time spend in pace zone 2 (and perspectively the other zones as well). However as you can see in the screenshot, I am unable to access the pace zones. Can anybody help me with his?