I would like to see how a runner’s pace evolves over time, but only in a specific HR zone.
Specifically: Average pace when running in HR zone2 over time.
I don’t seem to find a good way to clearly plot this.
Any ideas or tips?
I would like to see how a runner’s pace evolves over time, but only in a specific HR zone.
Specifically: Average pace when running in HR zone2 over time.
I don’t seem to find a good way to clearly plot this.
Any ideas or tips?
This is exactly what I have been looking for too. I can see by comparing older runs that my pace at a given HR zone is clearly improving, but it would be so nice to see it in a clear overview.
Maybe you can create a custom activity field for Pace in Z2 and plot that on the fitness page.
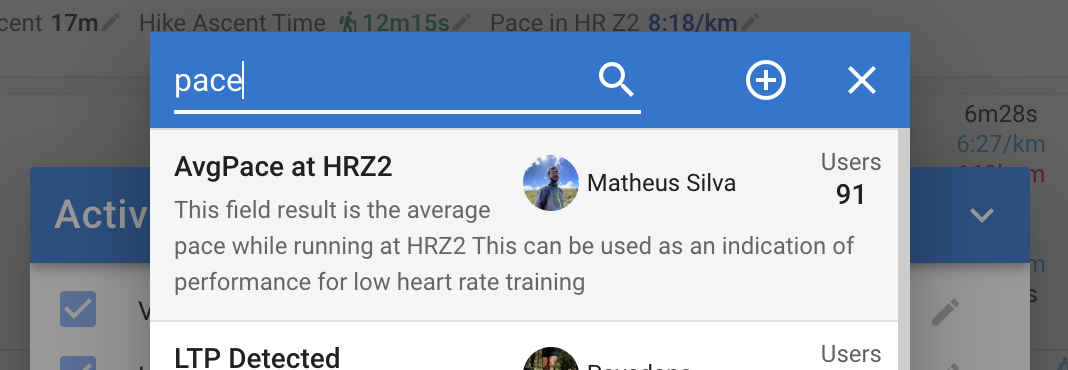
Yes a custom activity field will work. I was busy creating one and then I noticed @Matheus_Silva already published one (thanks!):
Matheus’s version checks the time in HR zones to make sure the run actually looks like a Z2 run (neat!).
Matheus your version only considers “Run”. Intervals.icu now also has trail run and virtual run so maybe do:
if (activity.type.indexOf('Run') >= 0) { ... }
Also there is an out by 1 error in the HR range check. The max HR for Z2 is activity.icu_hr_zones[1].
This is the code for my attempt:
{
  let heartrate = icu.streams.fixed_heartrate
  let velocity = icu.streams.velocity_smooth
  // activity.icu_hr_zones = max HR for each zone (index 0 = Z1, index 1 = Z2 etc.)
  let z2Min = activity.icu_hr_zones[0] + 1
  let z2Max = activity.icu_hr_zones[1]
  let tot = 0.0, c = 0
  for (let i = 0; i < heartrate.length; i++) {
    let bpm = heartrate[i]
    let mps = velocity[i]
    if (bpm >= z2Min && bpm <= z2Max && mps > 0) {
      tot += mps
      ++c
    }
  }
  c ? tot/c : null
}
That custom field looks exactly what I need.
Is there an easy way (I bet there is) to calculate this retroactively for past runs in bulk?
Edit: I found how to do it activity per activity. If there is a way to do it in bulk, that would be nice though.
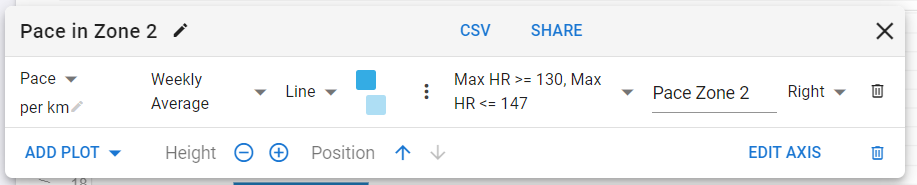
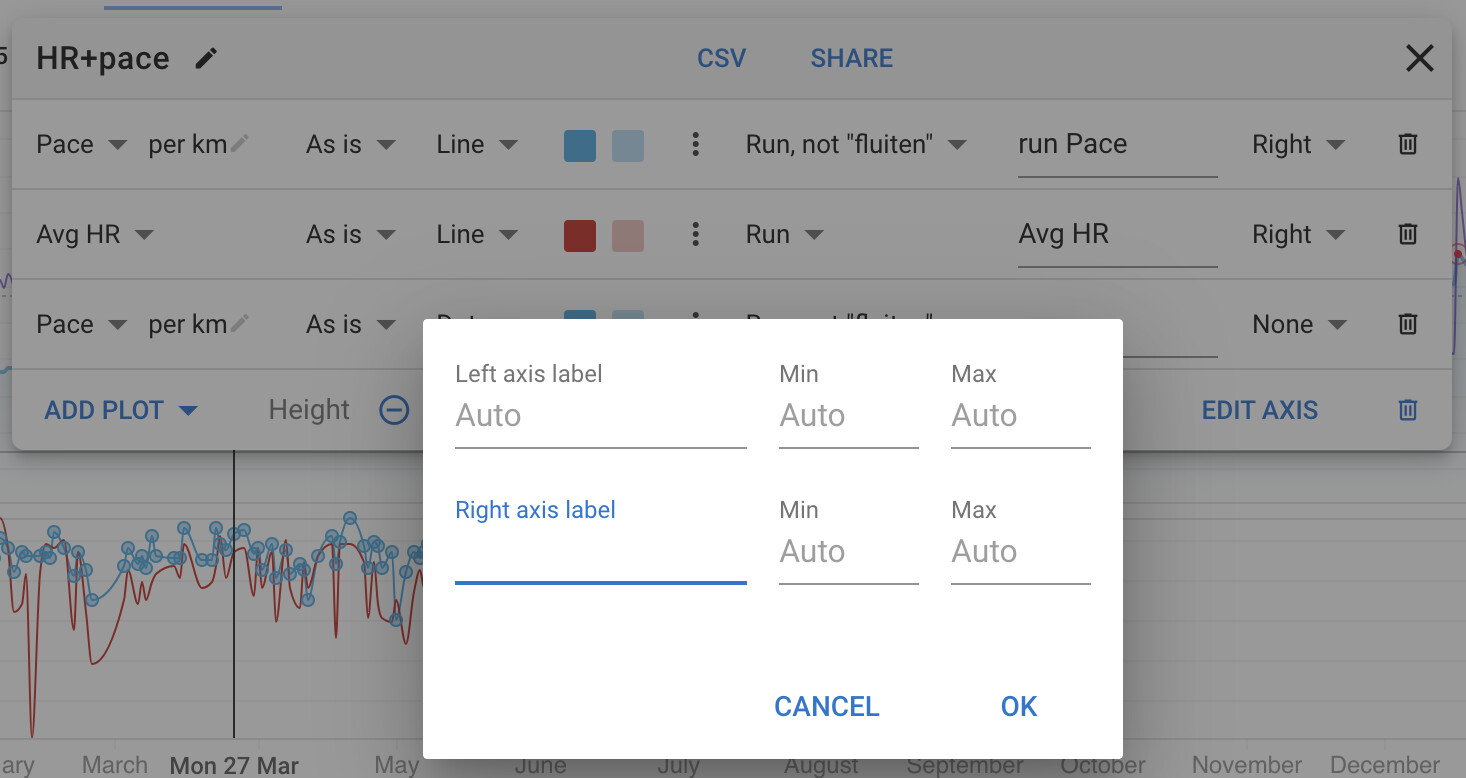
And just another question when using this custom field on a plot in the fitness page: the axis does not automatically scale to the values:
![]()
How can I fix that?
I fixed that bug yesterday. You probably need to delete the plots and re-add them to the chart to see the fix.
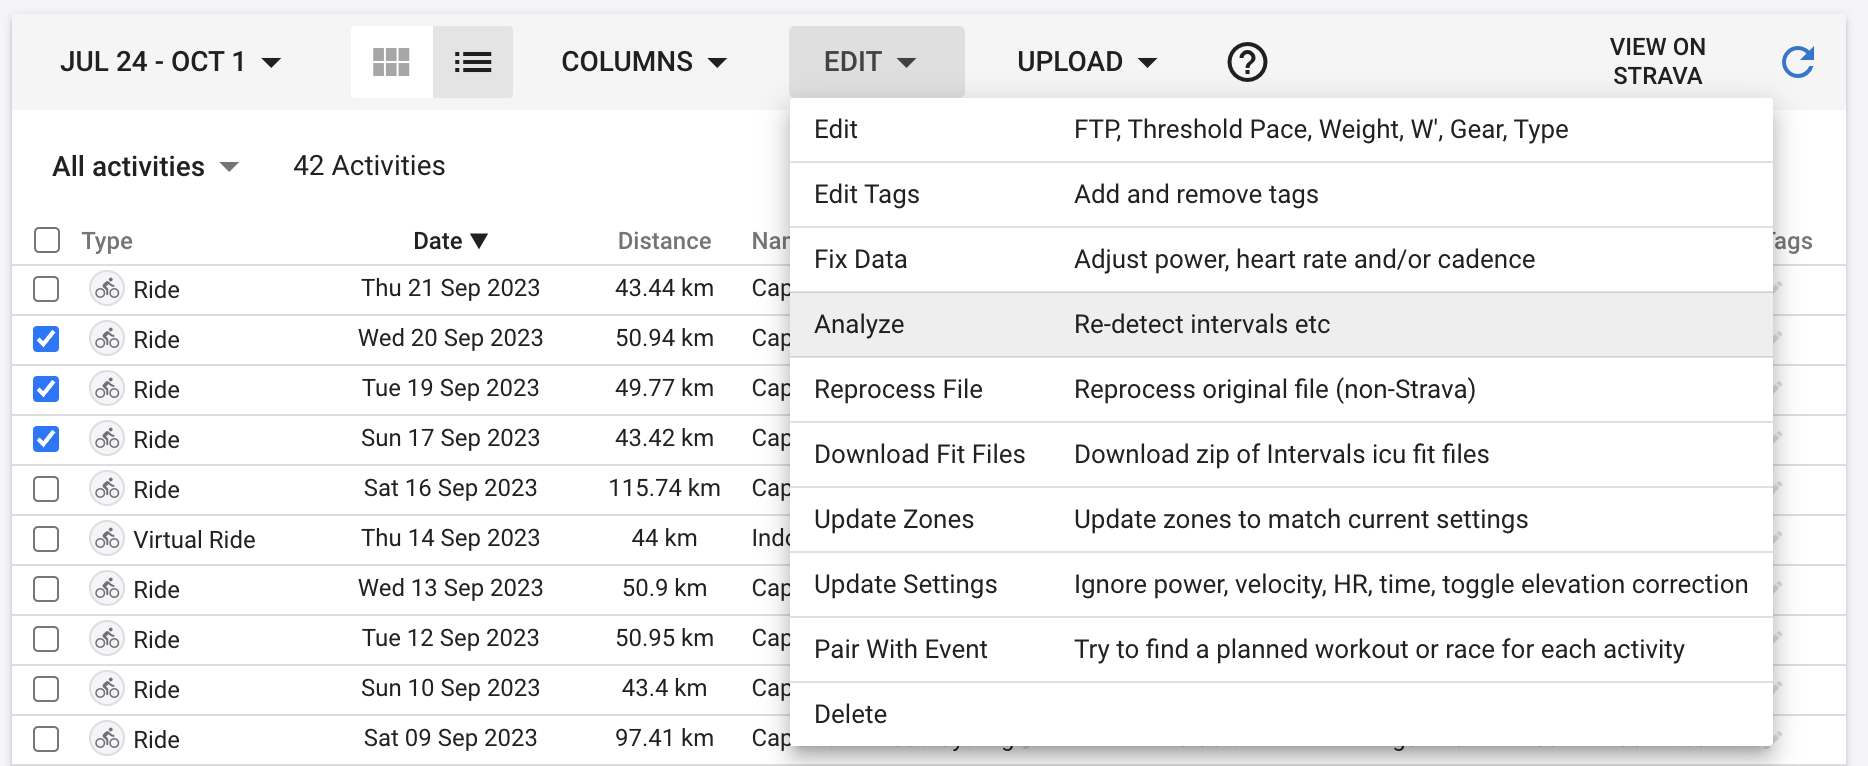
You can bulk re-analyze activities from the list view:
Great info and thanks for the bugfix!
Keep up the good work. ![]()
![]()
Hi David,
It seems that the bug is still not completely fixed: the units are good, but the scaling does not match the values: there is a big part on the underside of the plot that is empty.

I added @Matheus_Silva’s chart but the chart is blank. Any ideas why?
Indeed, mine too.
You need to add the “AvgPace at HRZ2” custom activity field and re-analyze existing activities to compute it. You can add that as a column on the activity list view to check. Then you should be able to see stuff on the chart.
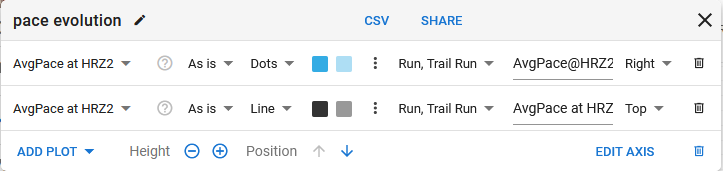
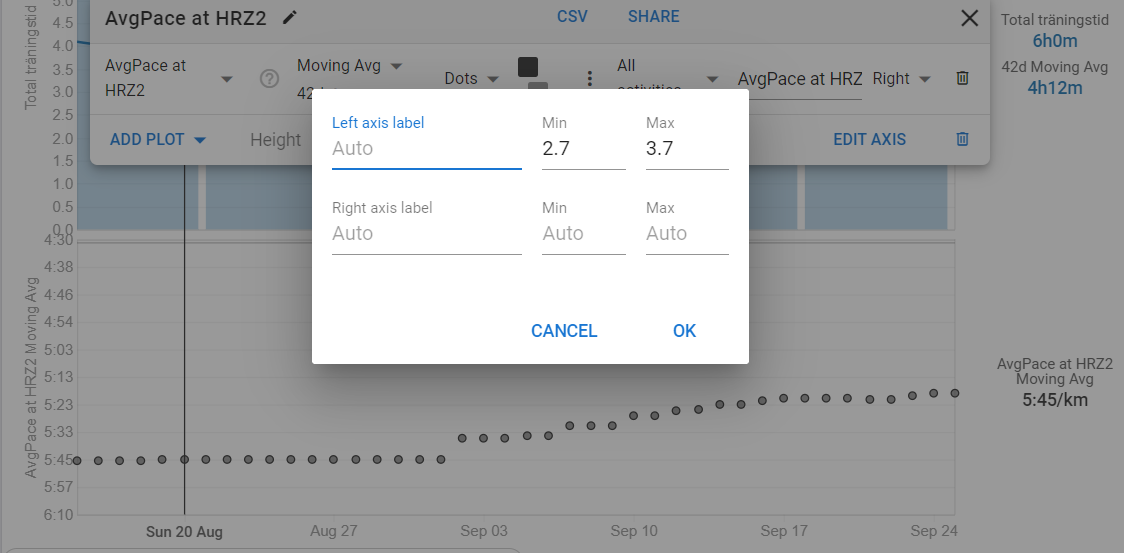
Do you mind adding that plot back to your fitness tabs so I can have a look? You can use the “Edit Axis” button to manually set the lower bound. You need to enter values for pace in meters/second currently.
I was looking at this problem and I noticed that your chart with avg HR has the right axis label overlapping the marker values. You can fix that by clicking “Edit Axis” and setting the right label to a space:
Sorry for being a bit slow, I’m lost. I can’t figure out how to add “AvgPace at HRZ2” custom activity field. I’ve looked all over. This is what I see for the chart settings.
I am lost as well.
You need to go to the activity screen and open “fields”
From there you can search for fields → AvgPace at HRZ2 by Matheus Silva
I have done that and i now see the field on all activities.
However, i cant add the column on the activity list as David suggests. Neither can i see any plots on the graph.
That worked great, thanks @david ![]()
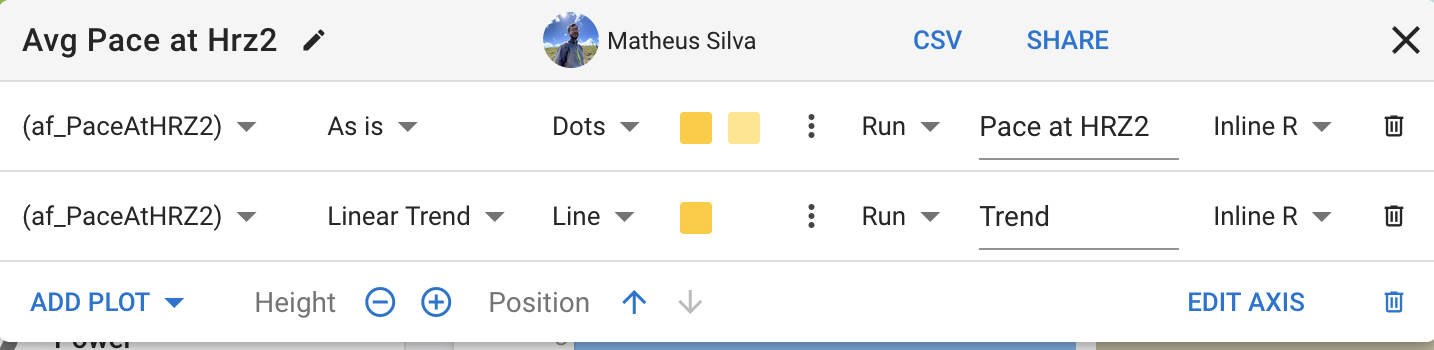
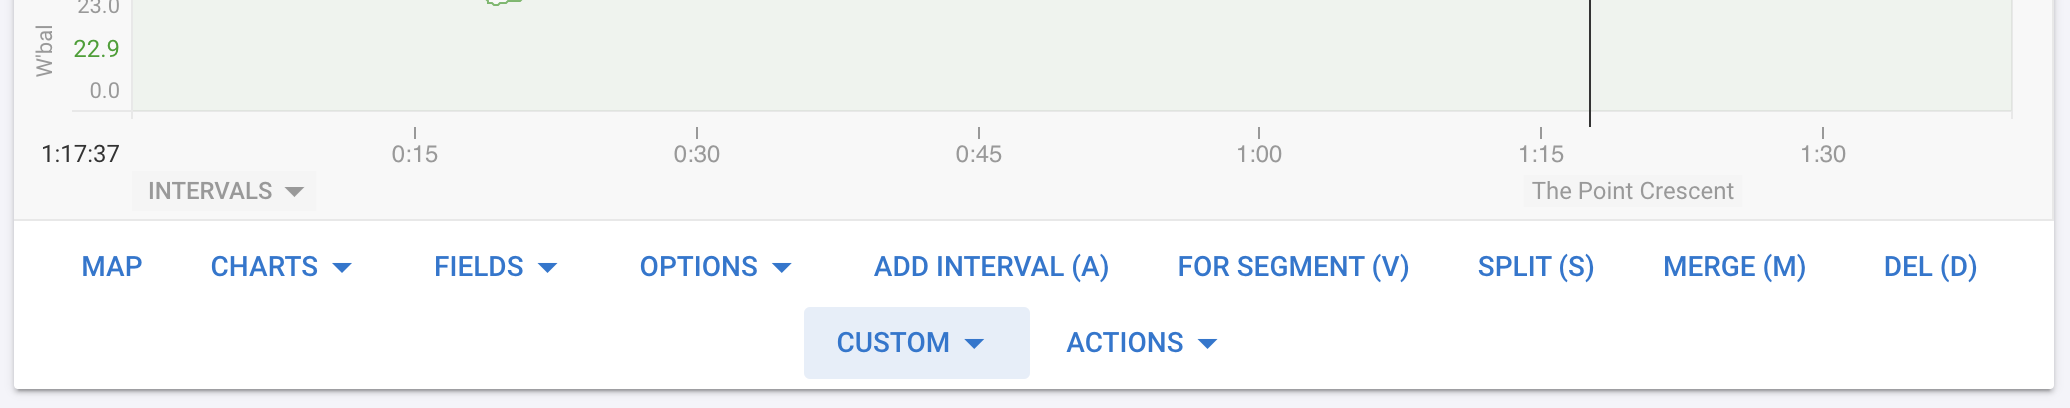
You need to add a “Custom” activity field:
The “Fields” button adds a custom interval field computed for each interval. There is an “AvgPace at HRZ2” custom interval field (for each interval) and custom activity field (for the whole activity).
Having “Fields” do interval fields and “Custom” do activity fields is unfortunate. I haven’t figured out better UX.
I don’t understand what the min/max values represent but this setting gave me a pace range of about 6:10-4:30/km on the left axis. I also chose to display the 42d moving average since i think the trend is more interesting than the value for indivdual workouts.
Ahh yeah that makes sense.
Perhaps you could have the “fields” menu contain
Interval fields
Activity fielsd
Just af suggestion.
Still it doesnt plot.
I have checked the list view and i now see several workouts with “AvgPace at HRZ2” so there is data.
The values you should enter in the Min and Max fields are the pace in m/s. So you would have to recalculate what you roughly know as to be your min and max pace from min/km to m/s. (x min/km = 1000 / (x * 60) m/s)