Hi, will it be possible to give an estimation of one’s LTHR?
The following two figures will be interesting:
Avg heart rate for best 20min power (Joe Friel’s Method)
* Not sure if you can add some requirements e.g. 10min before that should be above 65% of FTP so
that one can make sure that the cardiac system has been “warmed up”
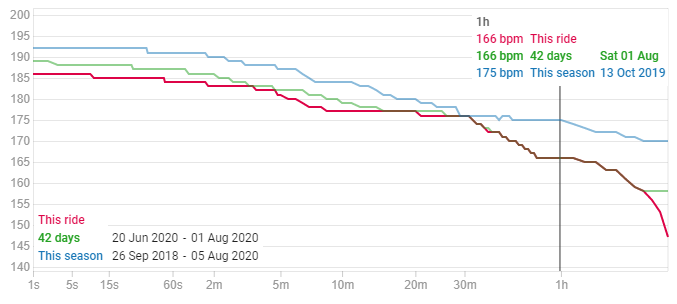
My graph was a little broken because my heart rate device went crazy one windy day and messed everything up, the graph did not make sense to me and but now I have updated that ride to ignore heart rate data and now I can make use of the graph. Very cool graph.
I have calculated my LTHR to be around 173 from race results in previous seasons but have not yet done such a hard one hour effort to see my LTHR for this season (or I do not have the muscular endurance yet), but I see a pretty high 30min heart rate of 176.
( I will now delete my current season start to see how my curve looks for previous season)
Edit, deleted season start and seems like my LTHR might be two beats higher than I thought at 175, but that day it was very hot so not sure it it counts.
I searched for forum for LTHR topics before I posted but did not see anything so not sure what is in your todo list.
There is many interesting things which can be done with LTHR. For instance it can be another tool to double check your FTP. Often I check where my heart rate exceeds LTHR and the power data before that to see what power demands have caused this. I can know for a fact that the average power demand before that must be above my FTP.
In my last hard ride where it detected an FTP increase, the power data page reports my HR at that FTP to be 168 first half and 172 second half. So my FTP is perhaps higher than expected or my LTHR have dropped somewhat. This could be another method of determining/tracking your LTHR.
I did a bit of Googling and found a few more ways to do it:
98% of your best 20m HR (from a Sufferfest post)
95% of your best 20m HR (TrainingPeaks uses this supposedly, post was from 2013)
100% of your best 1h HR
Friel’s is last 20m of best 30m HR. Thats a bit more work and I am not sure people go flat out for 30 mins all that often.
Any others or other ideas?
I don’t think it would be a good idea to automatically adjust HR zones and so on but to just report the number as being higher than what is currently set. Heat and dehydration really mess with this.
98% highest 20min heart rate seems the most accurate option looking at my own data.
I had my LTHR set too 173 and my 20min heart rate is 177 and 98% of that is 173. 5 and a very good estimate i.m.h.o
I have been wondering if my LTHR when on form could be 174 and when “fit” compared to now it might be around 172 and closer 97%. Since I started training again in June my best 20min is HR is again 177 like last season but my best long effort was 170bpm for 54min.
So I recommend alerting when the 97% of highest 20min heart is above the configured LTHR.
Yeah I agree that the zones shouldn’t automatically adjust.
I think I will go with what Training Peaks does i.e. 95% of 20m HR. If there is demand I can make that setting configurable at some point. Lots of people will compare whatever Intervals.icu does for this to TP.
I have done some more experiments and it certainly looks like 98% of 20m is much better than 95% (on my data!) so I have used that. I used 95% and nearly always my 60m HR was used. Changed to 98% and got very similar numbers but from a lot more activities (basically every race).
That sounds interesting but they say it requires HRV which I don’t get from Strava. Also they don’t give the details, just the general idea unfortunately.
hi @david I’ve found this LTHR estimation very useful (and indeed, anecdotally, 98% of best 20min HR is pretty much spot equal to my 100% 1h best HR, and it also coincides with my lab-tested LTHR).
I wonder, though - can the same be done for Lactate Threshold Pace? TrainingPeaks says, “We suggested a threshold if your Peak 45 Min Average Pace is faster than the currently set threshold.”. I guess a “Pace curve” similar to the “HR curve” could be added in the “Activity Pace” summary, and intervals.icu could pop a notification when a new Threshold Pace is detected according to this method?
Tx. Yes I have this on the list already. I am going to do a bunch of running stuff soon. Busy with some much needed refactoring of all the fitness and eFTP stuff and sorting out planning.
I agree that an automated replay of 20m sustained max HR after a good solid warm up and effort, could be really useful.
I appreciate you know this, but if it is of help to others, my understanding goes something like…
Although there are a great many definitions of threshold (MLSS, VT2, LTHR, OBLA, 4mmol/l…) you are spot on that our ability to sustain time there, is very trainable.
Finding it, without the aid of a lab, including people with stabby things and blood analysers, plus other (eg gas) exchange equipment etc. is the stuff of proxy measures that are generally right, although inevitably precisely wrong. Even lab based analysis will be a little off, but better informed by actual physiological measurement.
By using actual ride data taken from outside the lab, we tend to unearth highest recorded sustained HR* rather than our true LTHR, . We never know if highest recorded is the LTHR, but it is a blooming good value from which to work and from which to set training zones IMHO. We need to re-test on a regular basis.
Training helps us realise our potential. By this means though, LTHR will seemingly go up and down across our season, as what actually changes, is our body’s ability to handle the hydrogen ions and regenerate ATP from the ADP, plus bear increased blood acidosis while we work at the threshold of aerobic energy production and edge of anaerobic energy production.
rather like an ftp test, without proper ride intensity before the 20min segment is taken, we could skew our estimate-based value. Thinking on LTHR, we are more likely to under than over estimate it. That could be a problem for setting our training zones.
Pardon my ignorance here, and perhaps making a comment that is obvious to the more knowledgeable among you, but …
Isn’t 95% of a properly done 20-min test commonly taken as an estimate of FTP, which itself is understood as our maximum sustainably power? [Sustainable has varied definitions.] In other words, isn’t the 95% calculation that TrainingPeaks uses simply making the assumption/definition that LTHR = HR at FTP?
If that assumption/definition is true, then couldn’t we simply estimate LTHR from the power vs HR graph on the /compare page and using the fixed point of FZTP or eFTP? We wouldn’t need a separate test to find this number.
I am very new to this site but enjoying the information it is unlocking. How does one make a graph like this? Can’t figure out how to render this graph