On a PC taking us to the Ergzone Admin site would be useful in terms of getting some extra metrics such as Drag Factor, Stroke Power index etc for the individual intervals. So potentially fields that cannot be seen in intervals. to my knowledge
1 Like
Hi @greis,
Just completed my tests. We will be reporting HR data via a seperate part of the fit-file, next to the stroke data. Can’t publish it yet on our Git, as I have an upstream PR that has to fix a bug before this becomes functional. Will report here if it is cleared, so you can copy this if you want (this is a bit trickier one to implement).
This allows us to record HR data as it comes in (as our HR processing already is independent of rowing metrics processing), making this data much more accurate as we can record it as soon as it comes in with the correct timestamps. Garmin, Strava and Intervals all recognize this approach already, and in Garmin and Intervals Zone calculations are correct (haven’t checked Strava on that one).
We will make events of Exceeding set power/HR etc. targets in the events list.
Jaap
2 Likes
I’ve made some improvements on the FIT file to ignore speed and power when there’s no change in distance.
Here’s how your test workout is detected after reprocessing it:
I will it tomorrow with anothe short interval/static rest combo. Thanks
1 Like
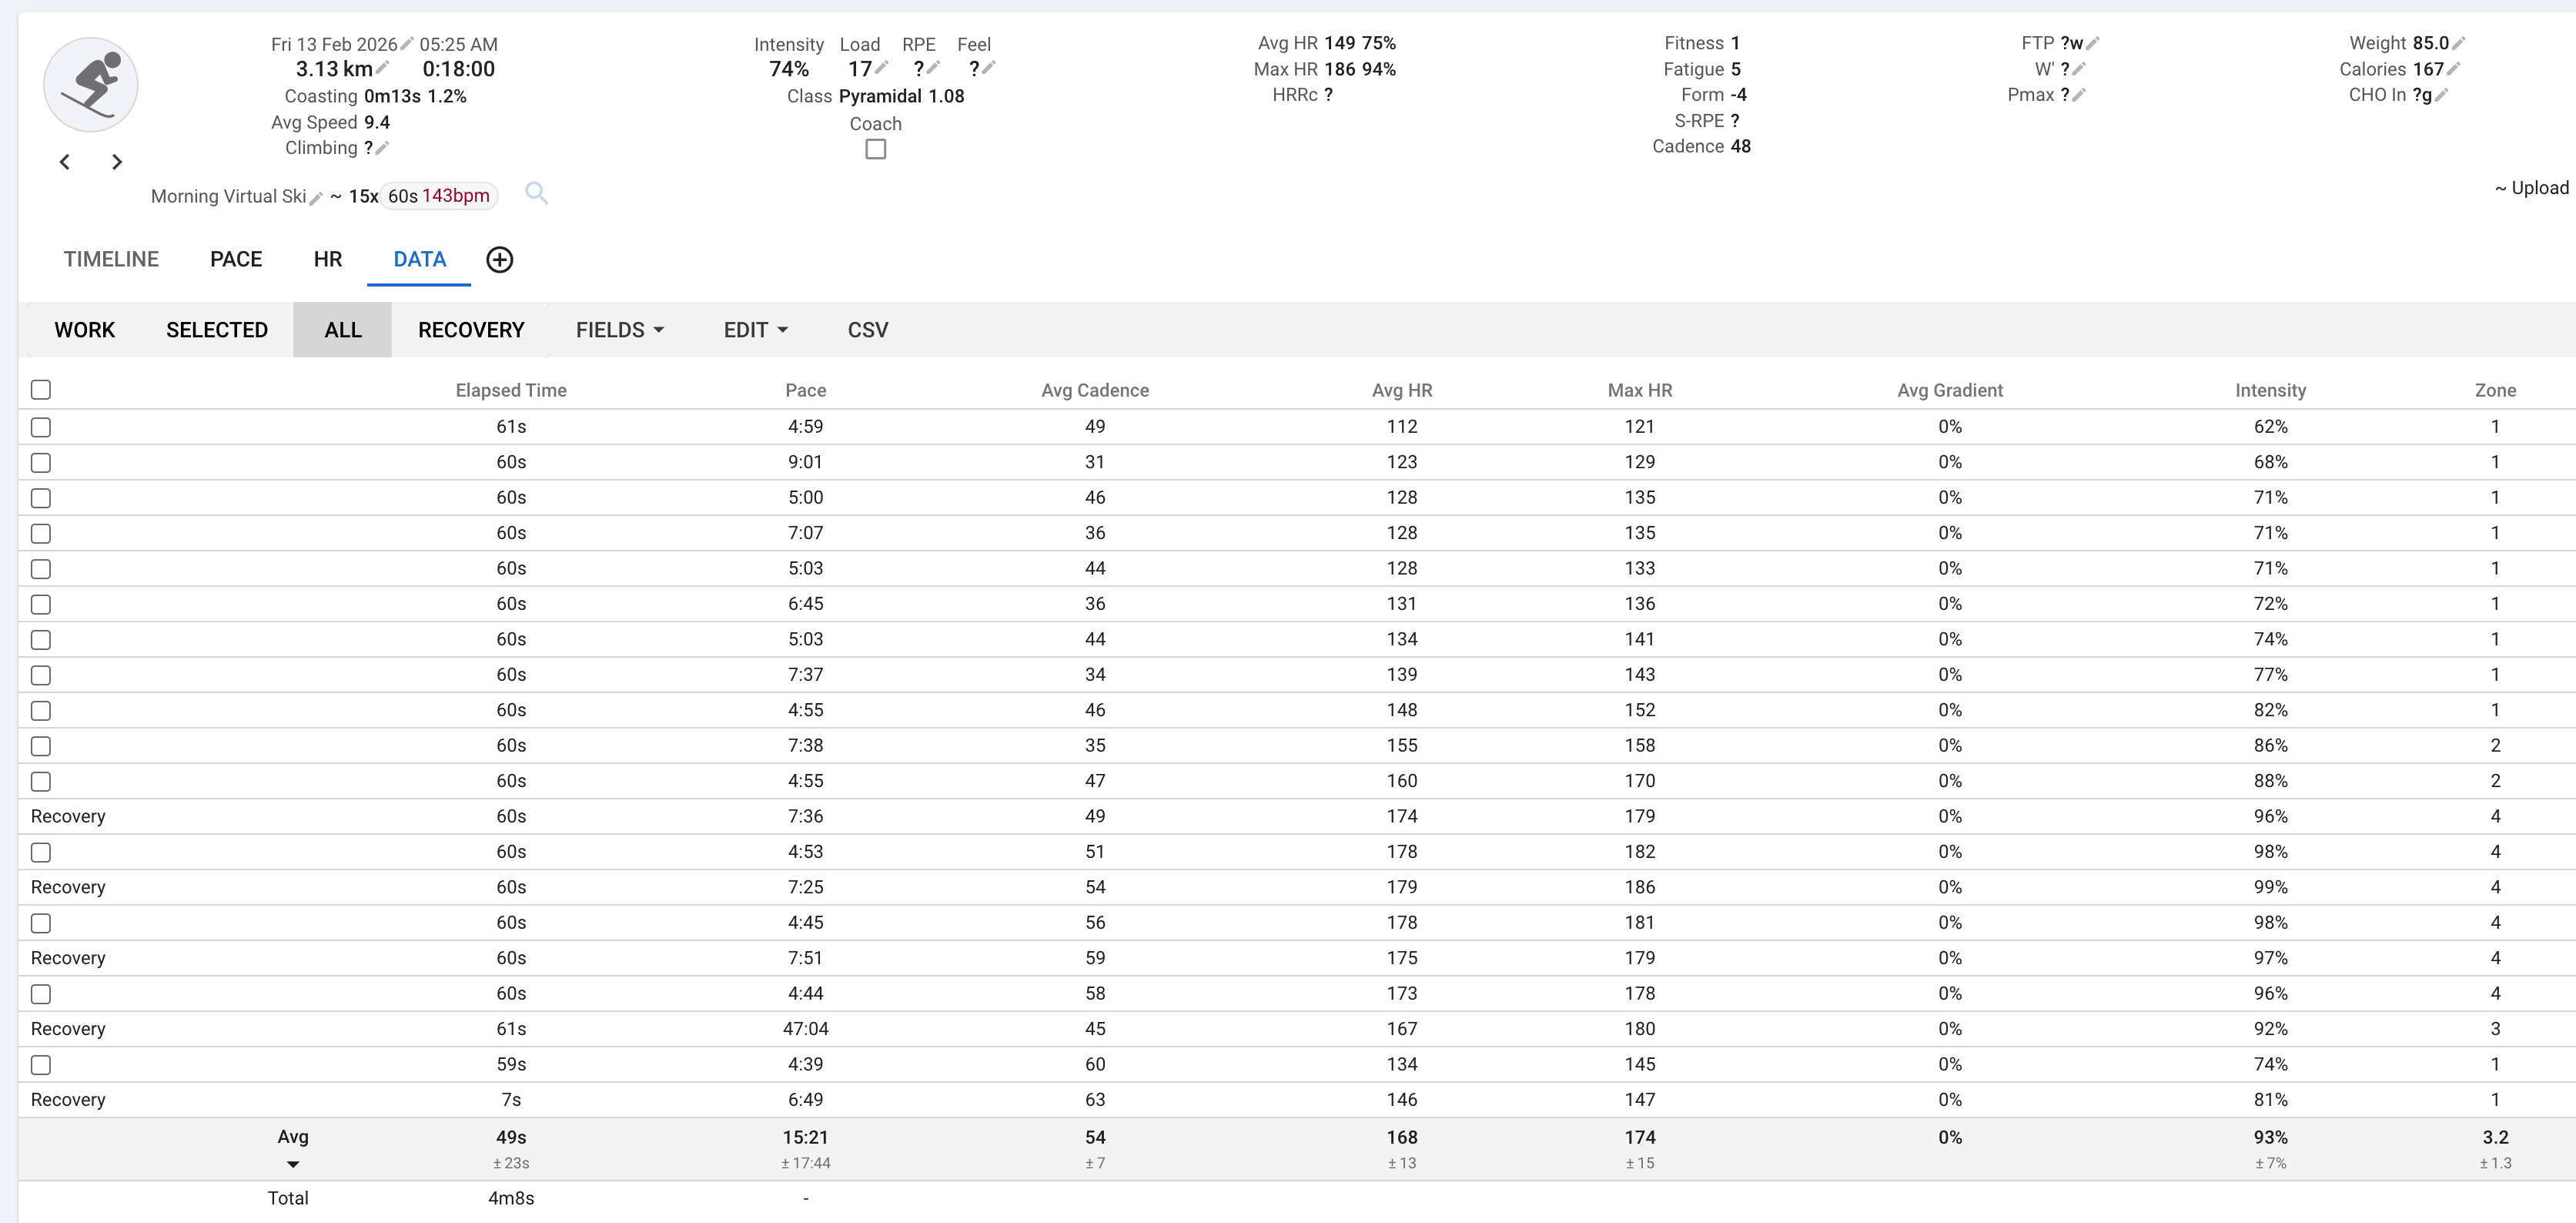
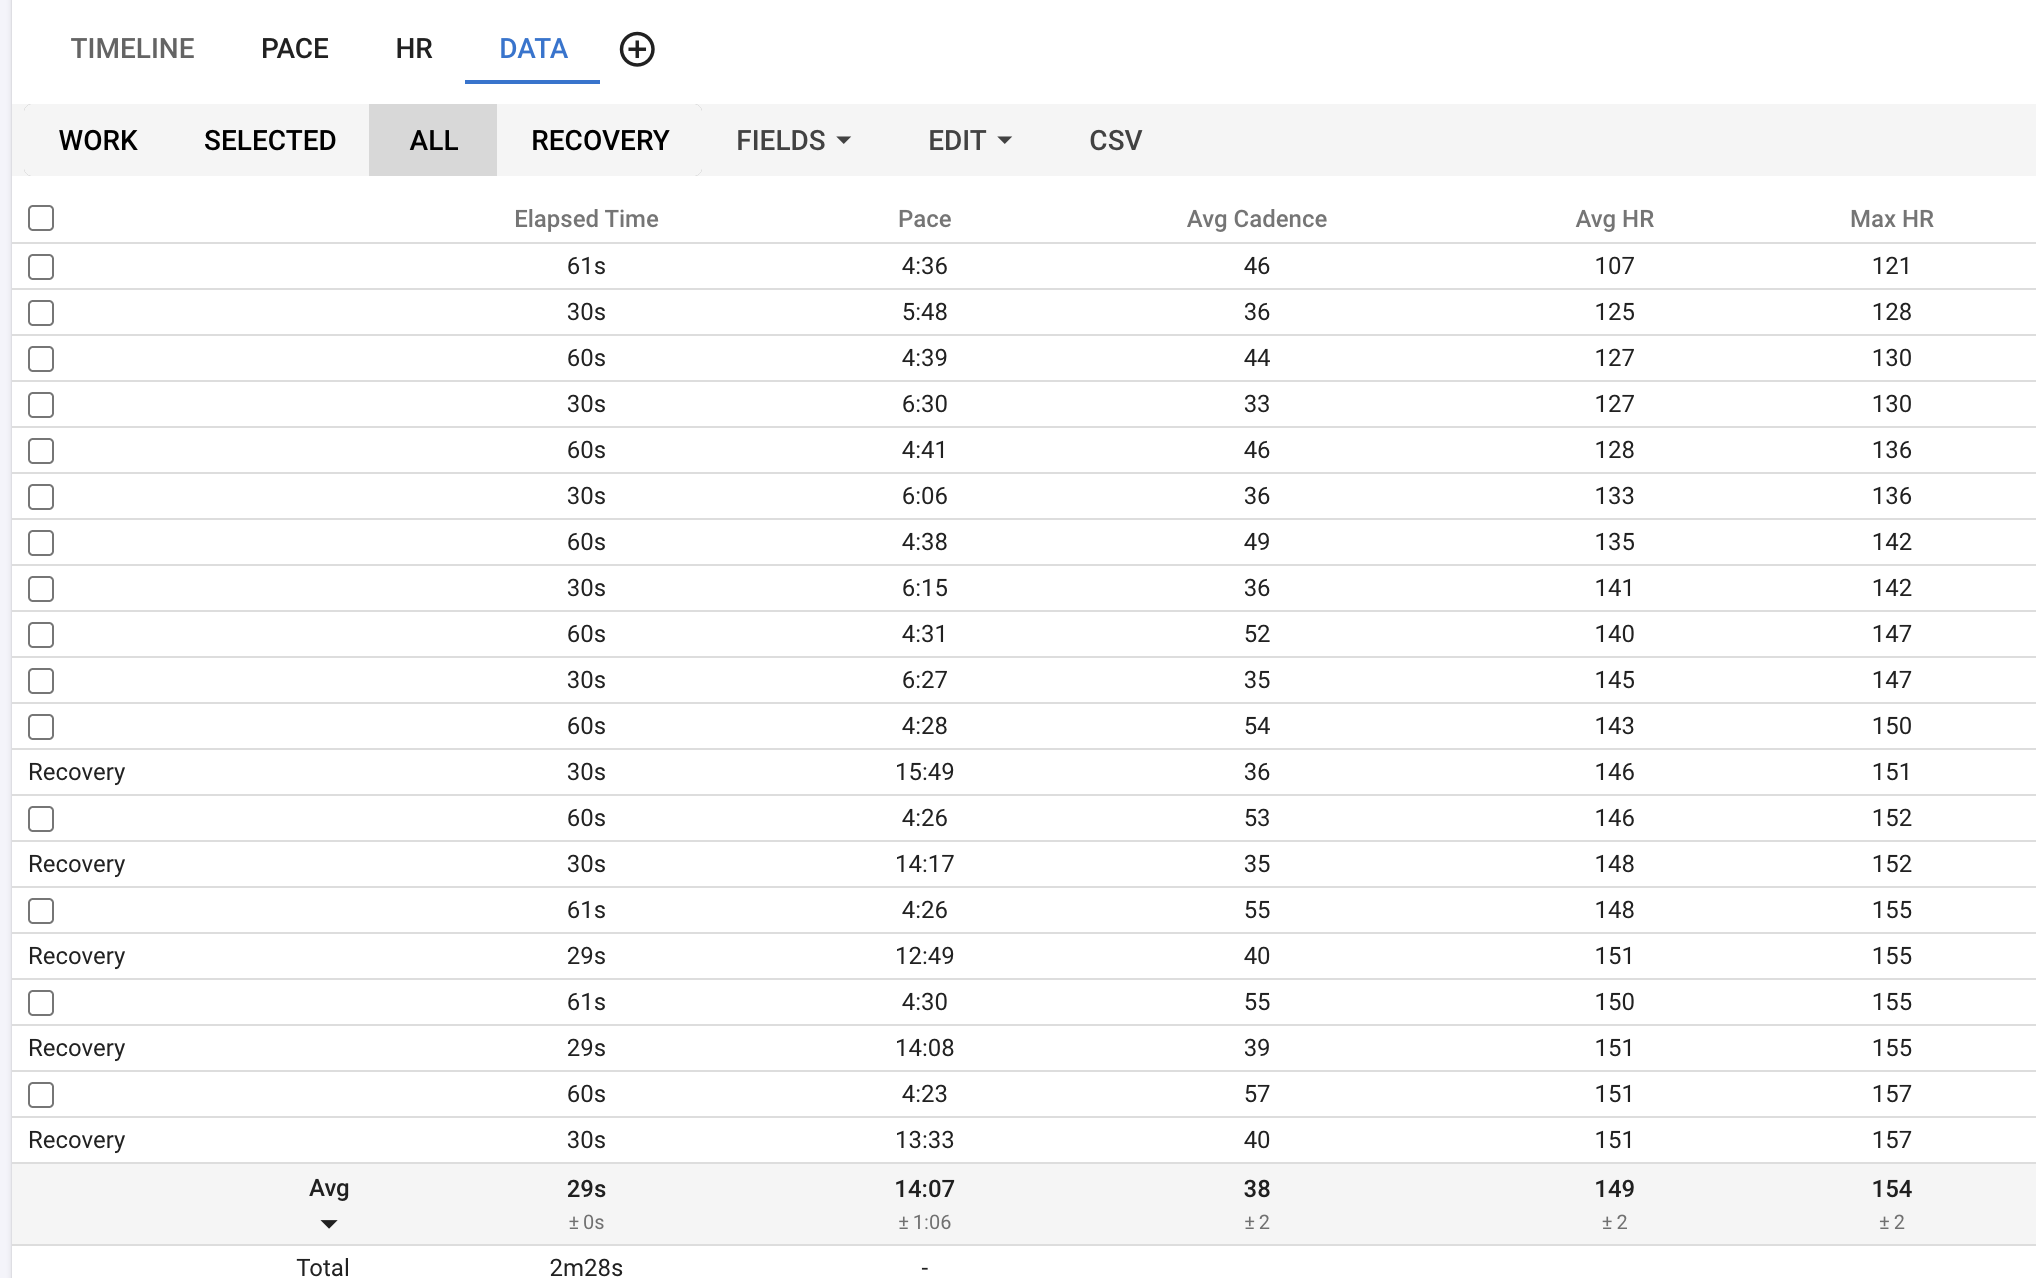
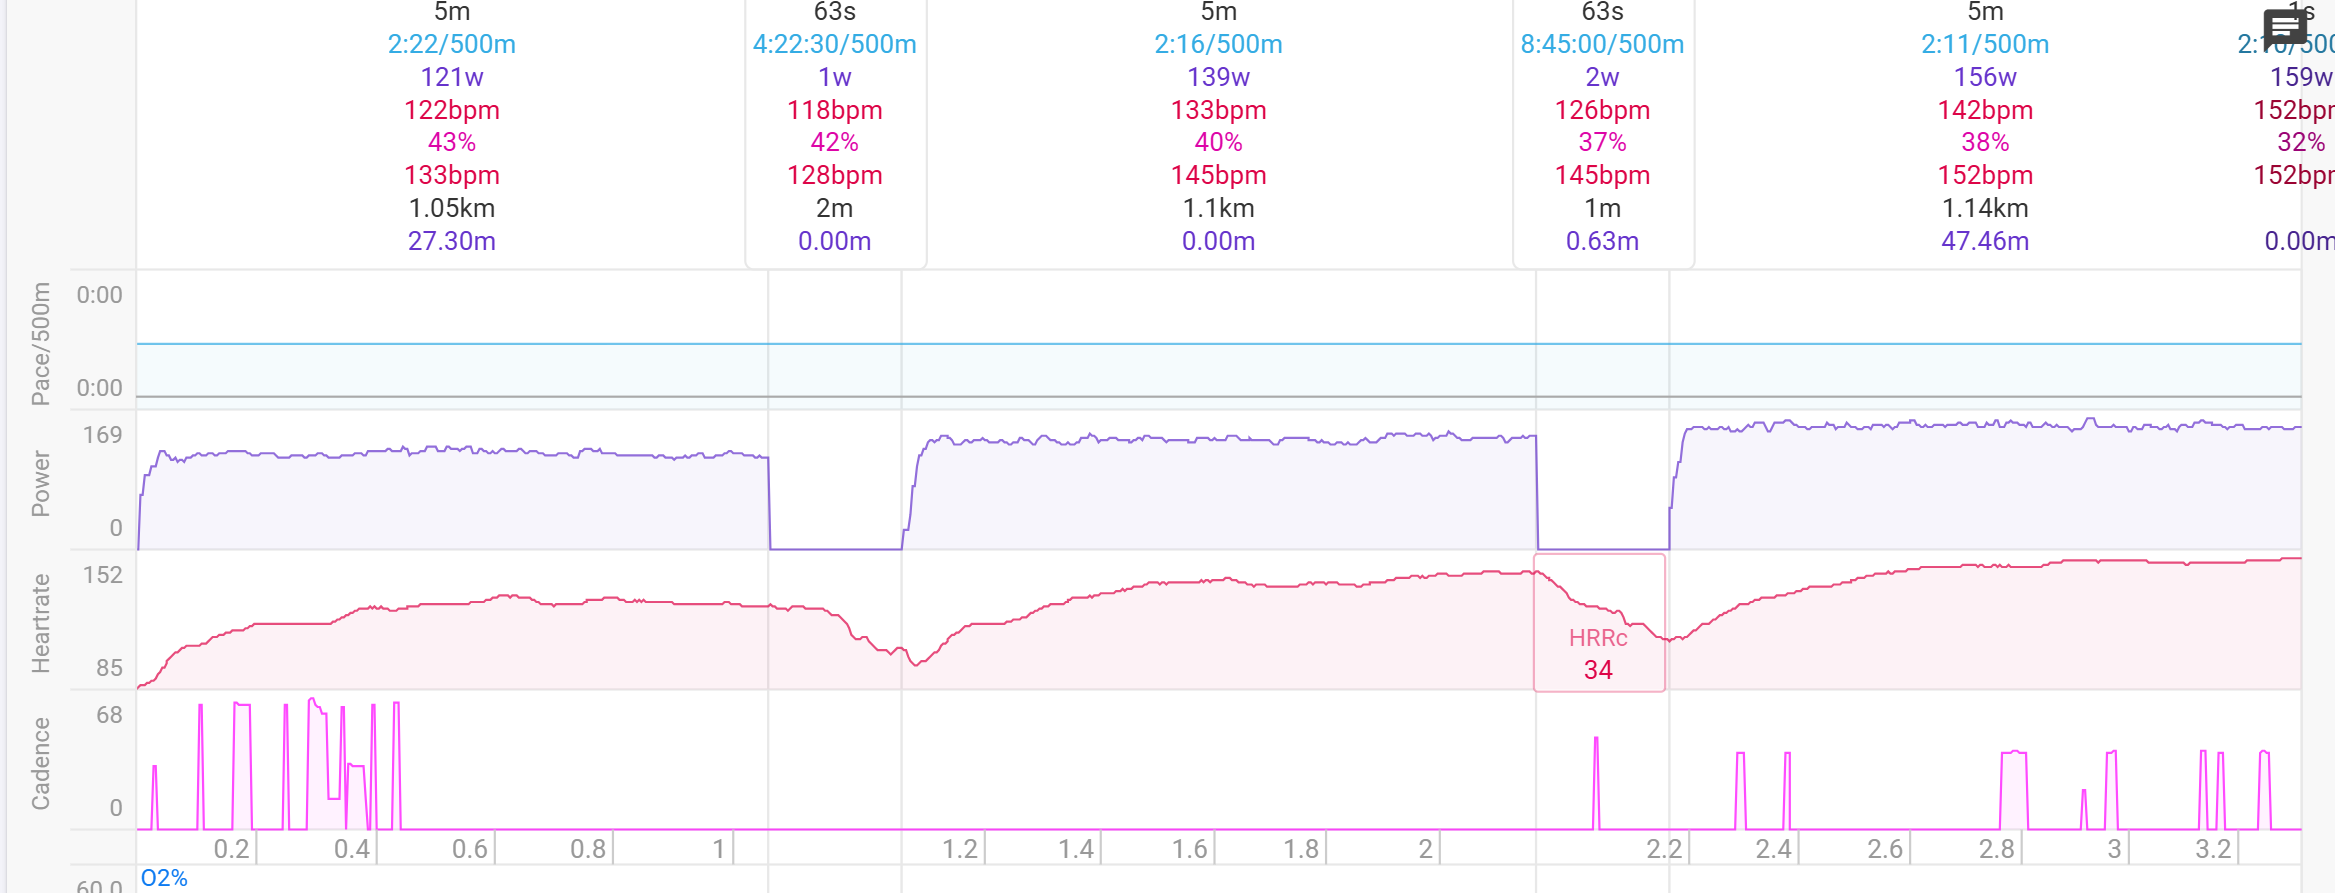
@greis. I did the intervals workout today with the first five rests as easy pulls & then the second five as static rest. The HR seems better in the easy pulls as you can make out some slight variation, whereas in the ones with static rest it seems like there was little/no recording of HR i.e. a straight line. Is that what you intended to happen?
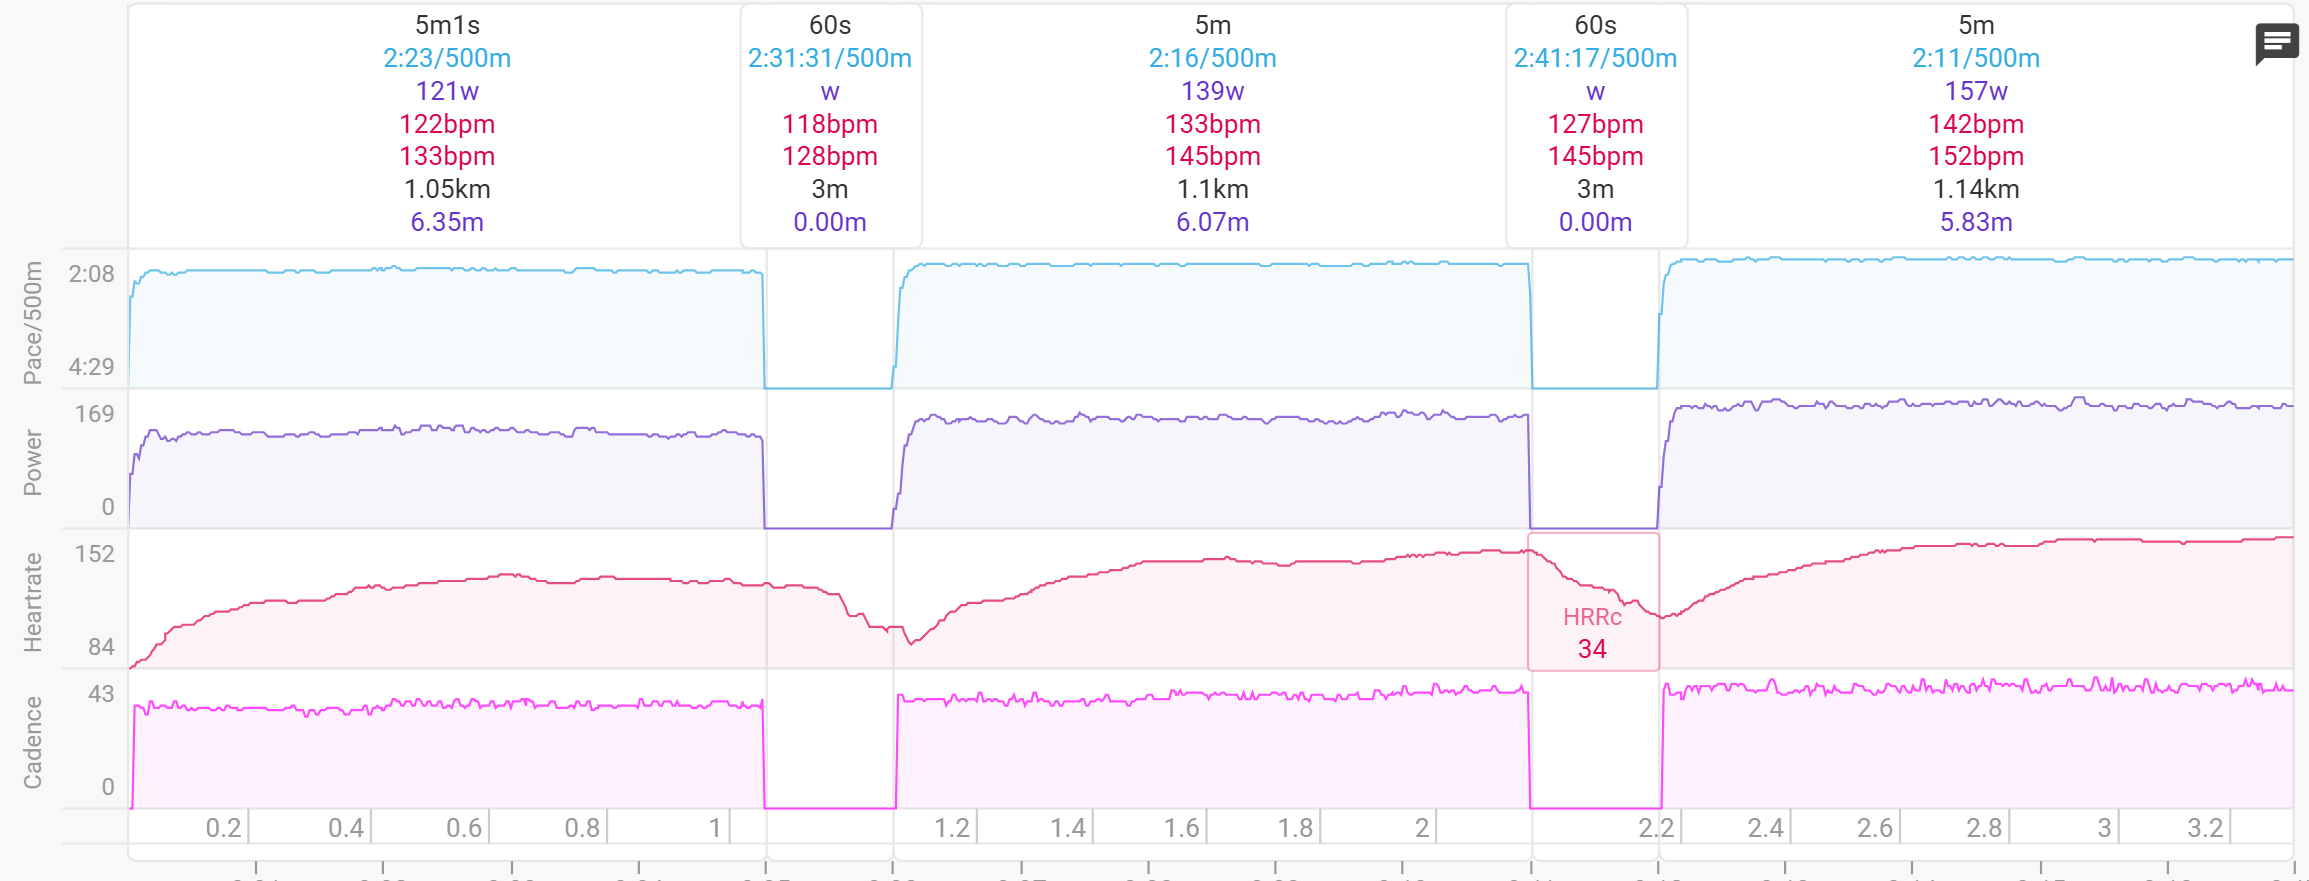
With the power it looks like with static rest it took up to 5s to realise that I had stopped. This could be the flywheel continuing but the drop off is perhaps a little slower than for the intervals with easy pulls in-between.
The power during the static rests is still higher than it should be as you will see from the data table.
Also the last rest interval has maintained an even higher power though was actually static rest as there was not a further interval to give the lower/resting power level presumably?
So a definite improvement that I am happy with & will make the metric more accurate than before but power average will still be higher than ideal.
Many thanks for your work. You should be able to view the activity at Intervals.icu
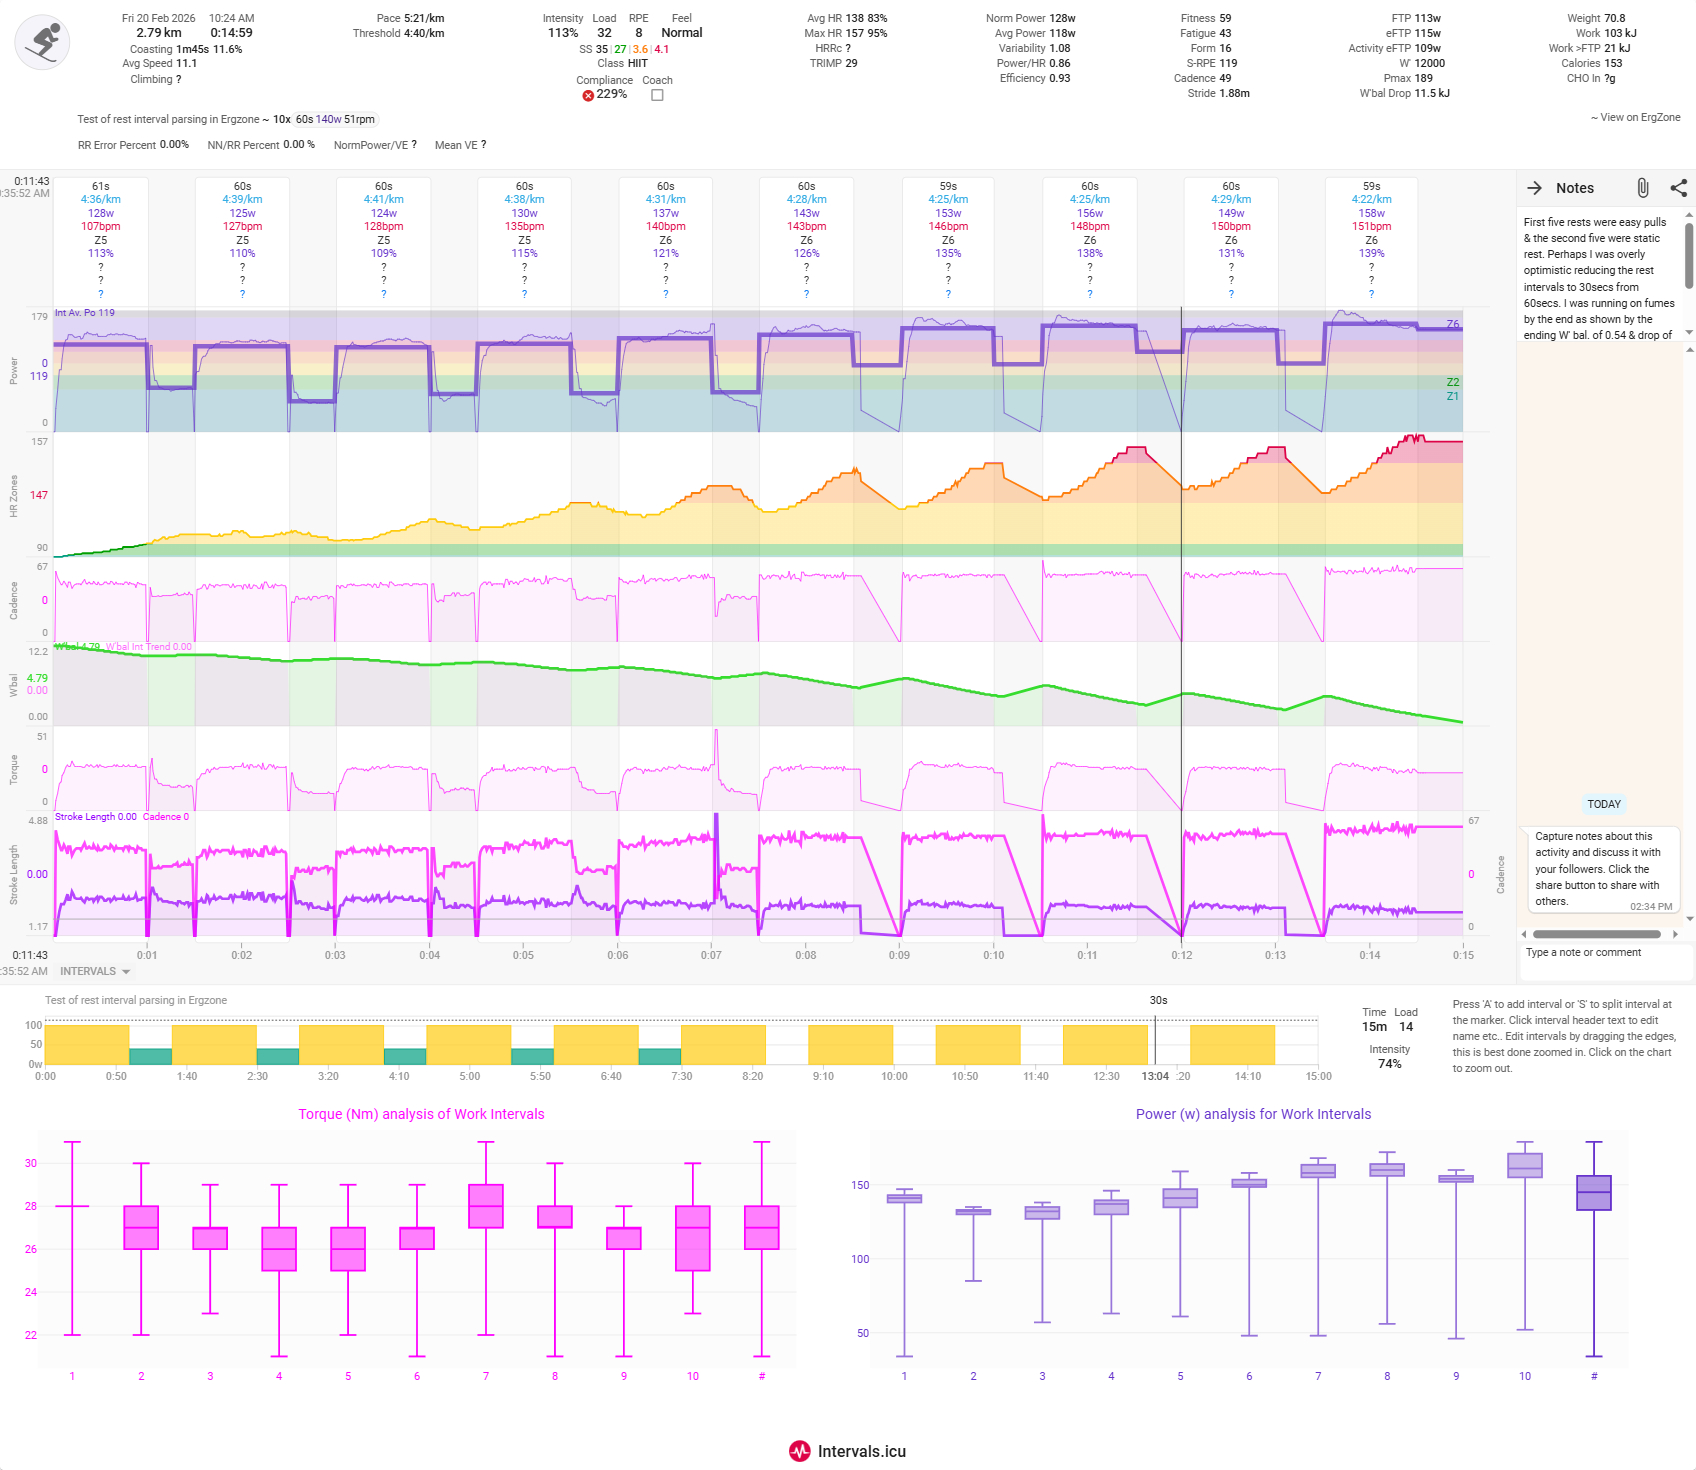
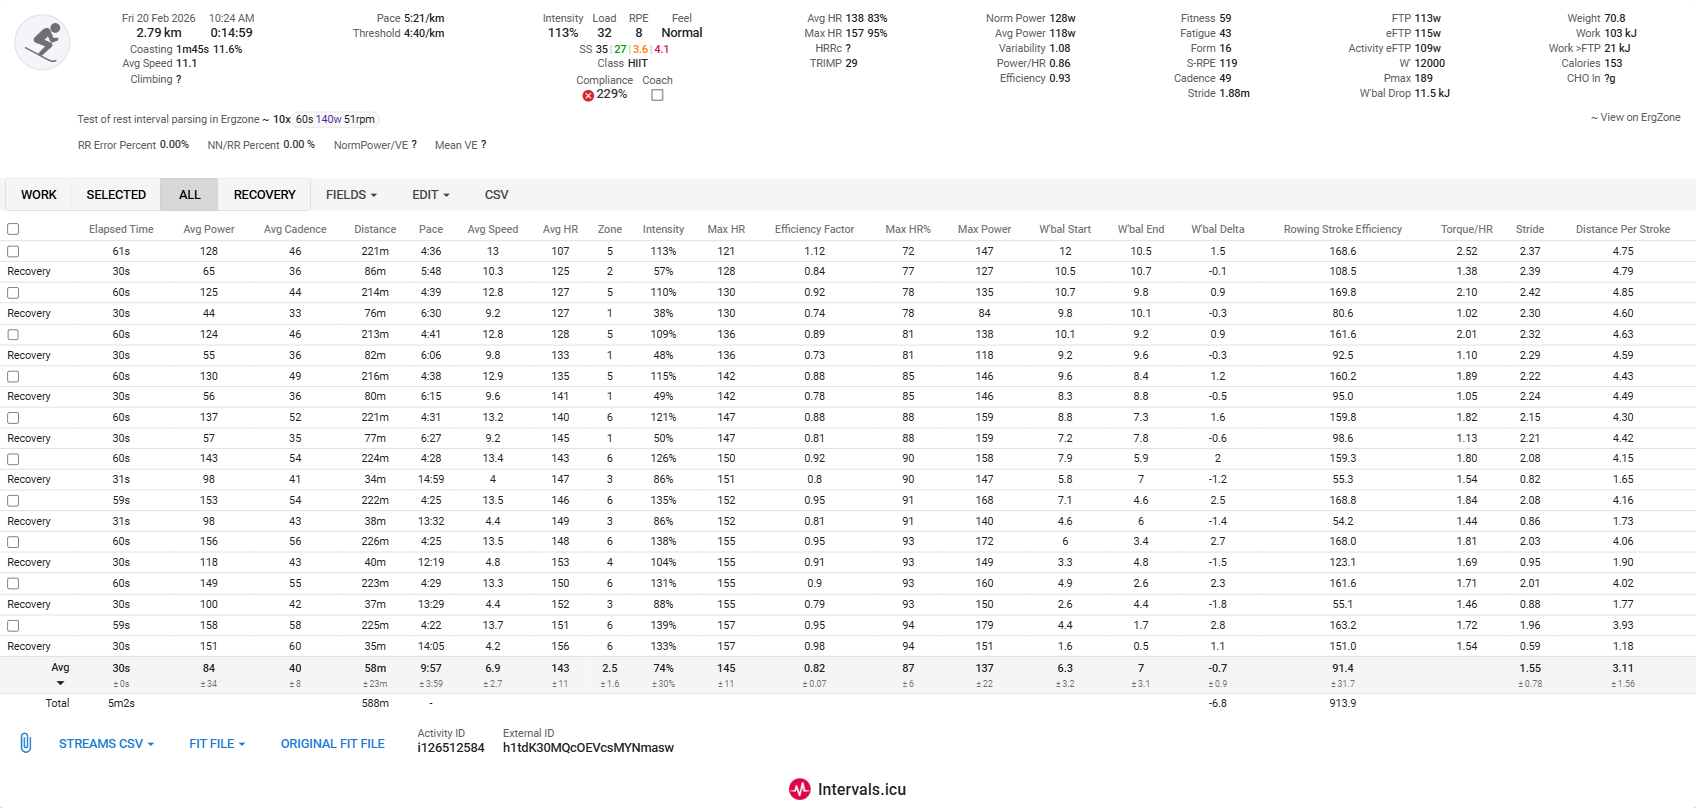
@greis I have adjusted the intervals based on cadence dropoff rather than power & so now have got the static rest intervals’ power down somewhat but at the expense of making the interval duration inaccurate. So ultimately the recorded power will not be accurate/over estimated as I was not actually pulling hard for 87s in intervals 6-9. I stuck rigidly to 60s for each hard interval.
Is this potential method of fixing the issue any more likely to work?
1 Like
I need to run more tests but I’m leaning towards programming rest as intervals, that way the PM5 can send the right power data. Maybe this is an option that the user can choose when enabling the integration on ErgZone.
The first five where the rest was programmed as separate intervals did seem to work better in my workout. The second five where the rest was a part of the same interval when played in Ergzone did not seem to for sure.
1 Like
The PM5 has a limit of 50 intervals. I’ll just need to be careful with the logic, so if programming rest as intervals exceeds 50 then it would fallback to being programmed as rest.
1 Like
I need to run more tests but I’m leaning towards programming rest as intervals
When a rest is planned, that is the best approach indeed. On OpenRowingMonitor we actually split intervals with a rest attached in two seperate intervals: one active, one rest. When reporting back to you via the PM5 interface, we put them back together again.
When a pause is unplanned, we create a rest split (we actually take care of recording the remainder etc.) and inject it between the other splits. We keep the interval as otherwise a sync between workout plan breaks. Our PM5 emulation actually is aware of this and merges the data. So recievers on the PM5 interface (ErgZone or EXR) will see this as normal behaviour. Our analysis of the BLE messages show that the PM5 does a very similar thing.
In our fit-file we also report them as such. So a planned rest becomes a rest interval, an unplanned rest remains part of the interval but gets its own rest split.
Our implementation of the fit-file is now on github: openrowingmonitor/app/recorders/fitRecorder.js at 0.9.7-(under-construction) · JaapvanEkris/openrowingmonitor · GitHub
Please realise that Garmin’s terminology is confusing: what we call intervals Garmin calls splits, and what we call splits are Garmin Laps. When we import our data into Garmin Connect, it is recognized correctly.
Here we handle HR as a seperate list (might include HRV later as well, if there is a need), which can continue even during pauses. This allows Garmins preferred approach of Smart recording to make use of data later on. This allows us to clearly mark pauses as well as we can zero all pace/power/strokerate indicators, etc.
2 Likes
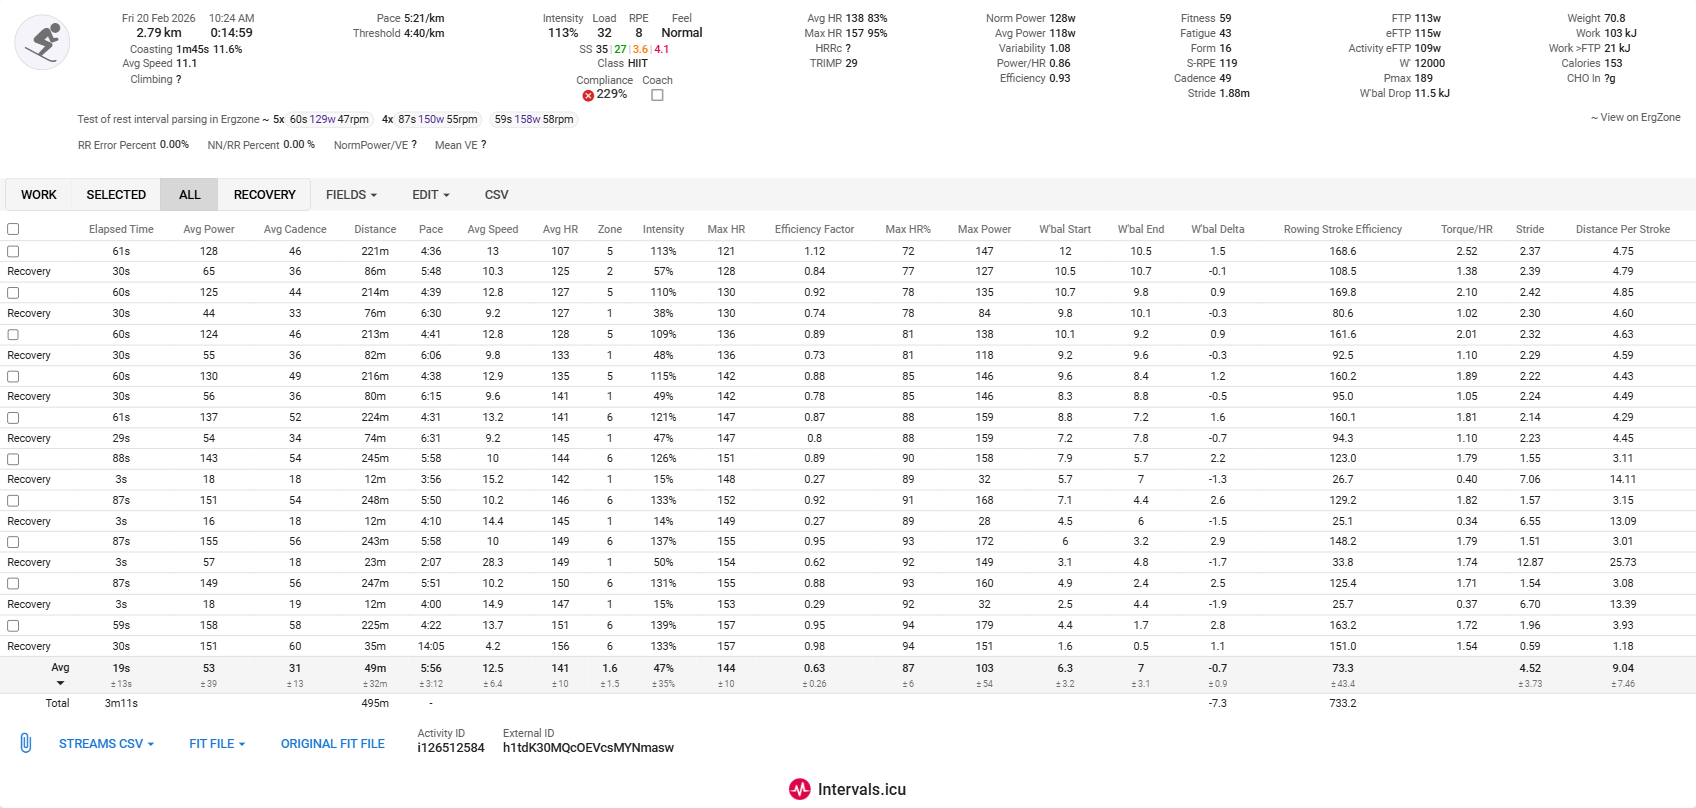
@David_Bannister I’ve improved the logic around rest. The PM5 does some weird things how time is computed during rest and I added some guards to the code that generates the fit files. Let me know how it goes.
So what type of workout do you want me to try the new logic on to best show how it works out? Is the one with the hard intervals & mixed rest/easy pull OK. I will be able to try it out on Monday.
Yes, the same you’ve been testing it
The PM5 does some weird things how time is computed during rest and I added some guards to the code that generates the fit files.
It does weird things indeed. When a rest is planned, for the PM5 it becomes an “attachment” to an active interval (from the Bluetooth spec it behaves as a parameter belonging to an active split). An unplanned rest is just time passing without moving, but nothing is done to mark it as rest time.
Looking at the fit-file they produce for a session via the logbook, they do smart recording (one row per stroke). Pauses are not accounted for, at all. When I look at sessions where planned pauses were present, nor the event log nor the laps (i.e. PM5 splits) contain a seperate entry for the pause or indicate a “total moving time”. And everything is a rest split…
One thing I noticed on the knock-off FTMS SkiErg: they produce records with 0 speed and 0 cadance (2 out of 3) and about 1 with valid data. Even distance travelled did not change. Perhaps filter these “empty” lines?
2 Likes
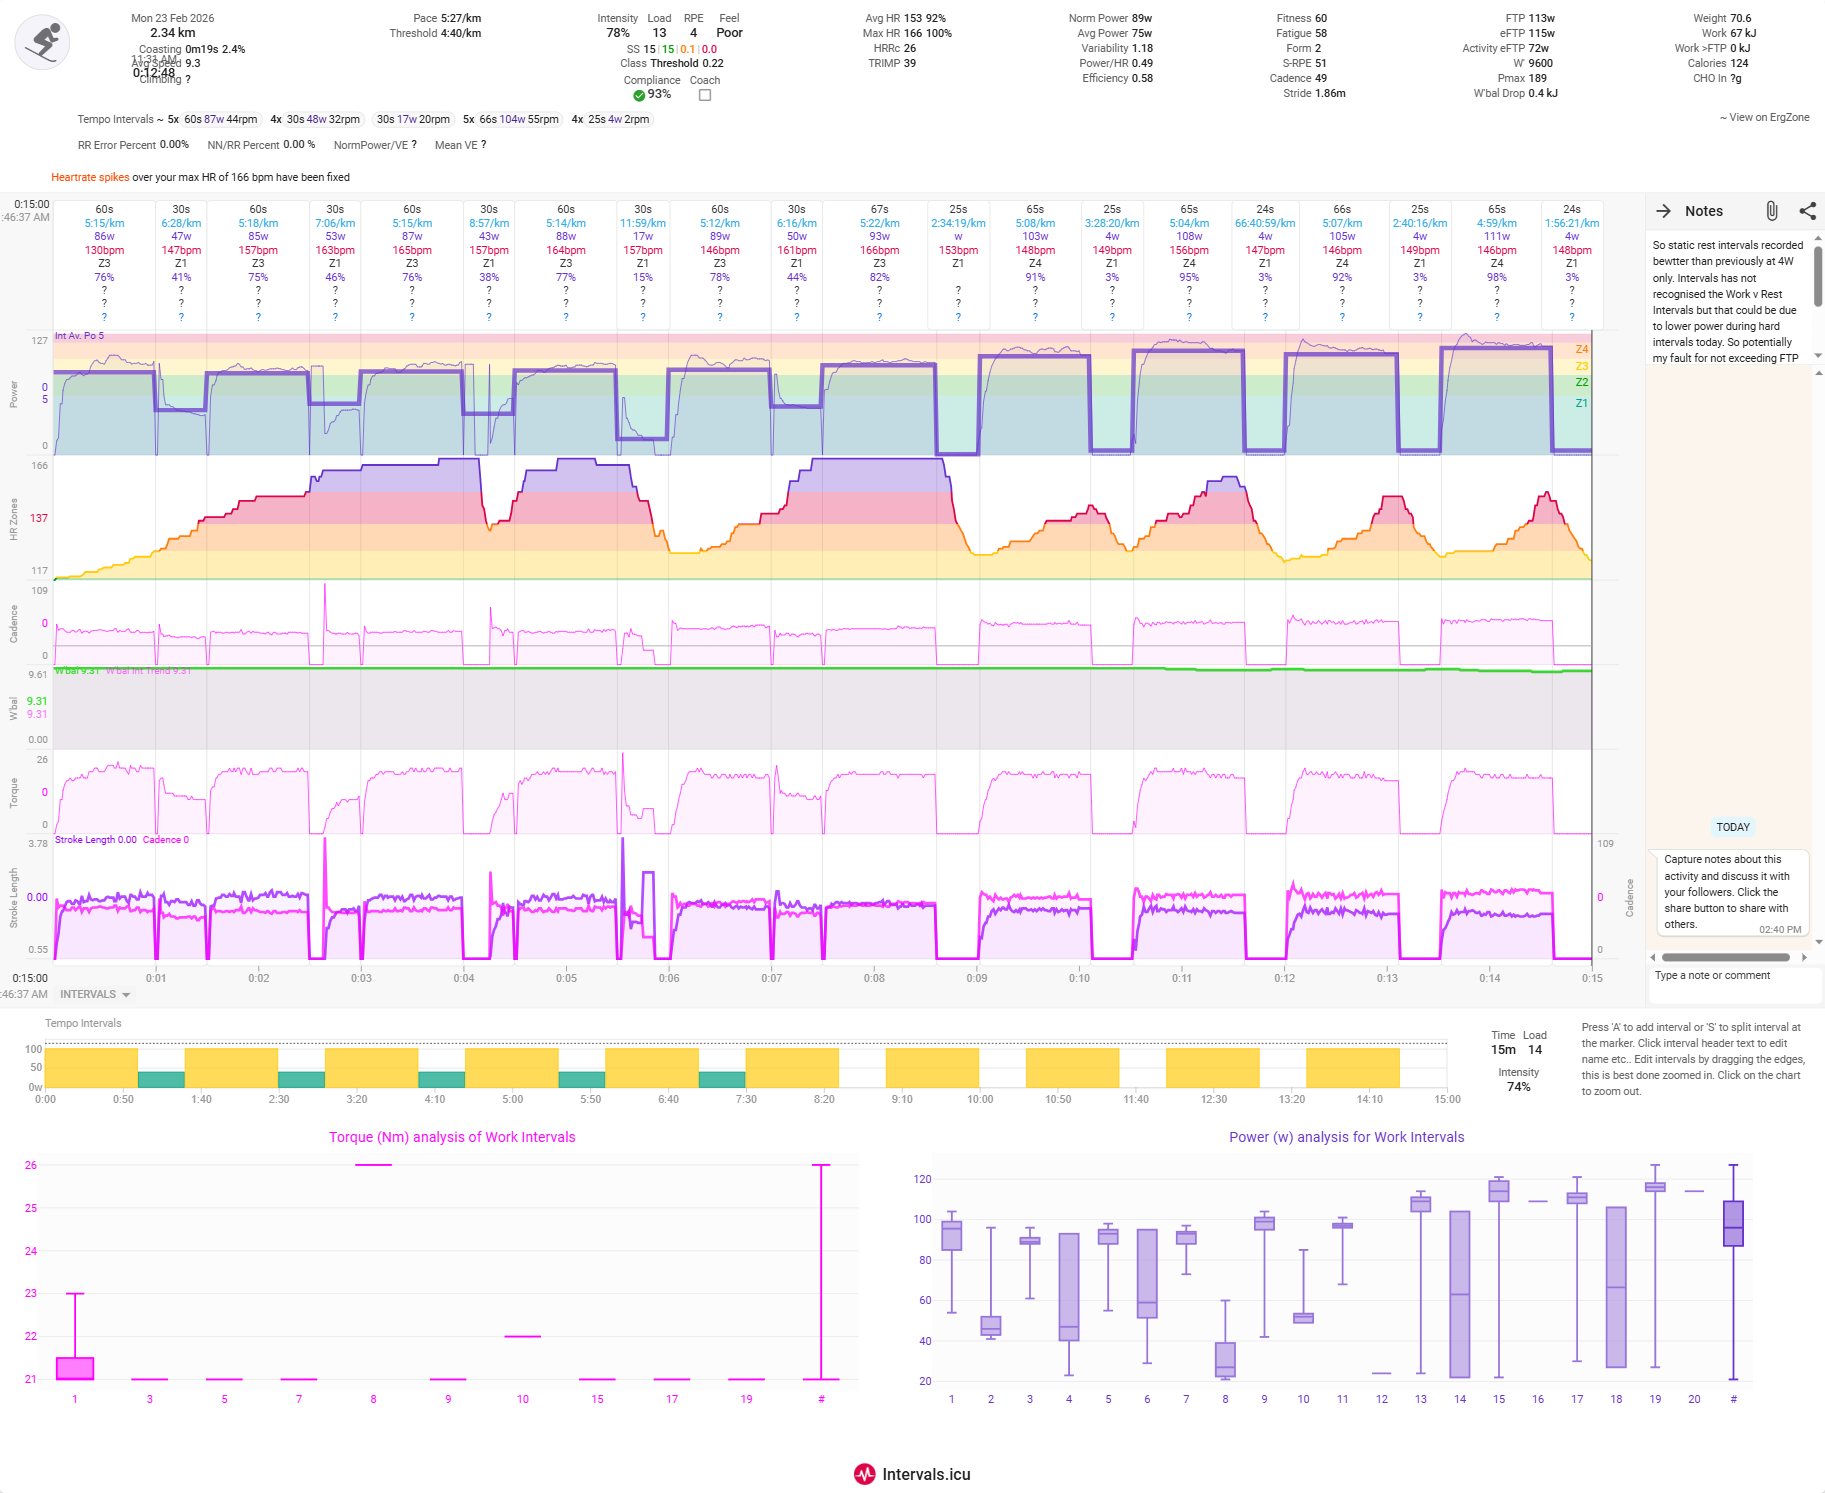
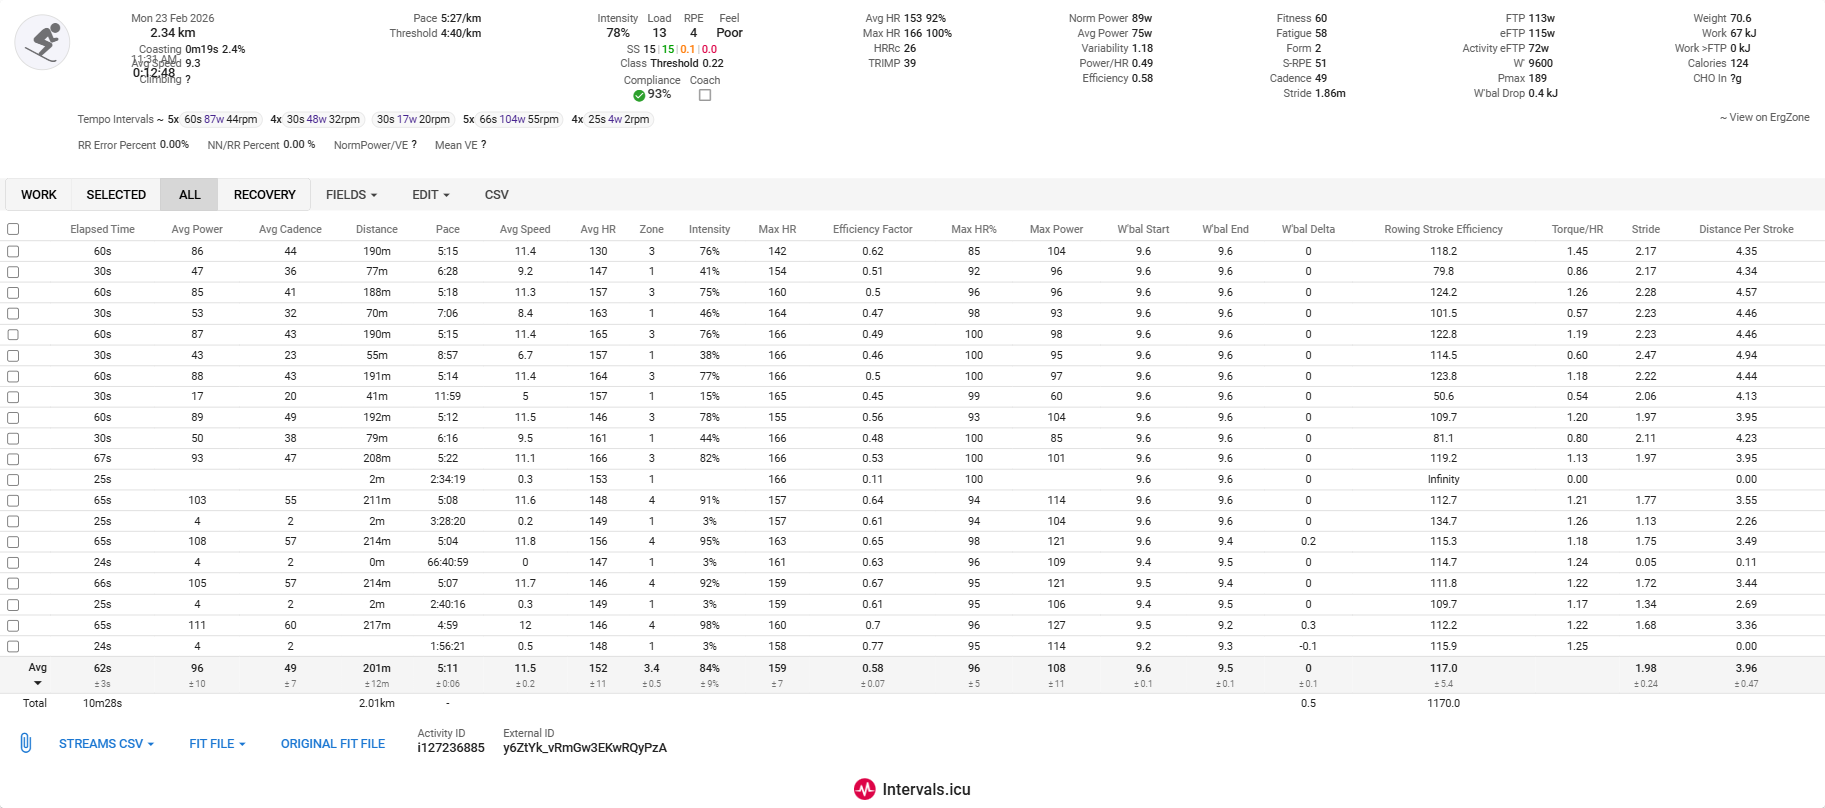
So static rest intervals recorded better than previously at 4W only. Intervals has not recognised the Work v Rest Intervals but that could be due to lower power during hard intervals today. So potentially my fault for not exceeding FTP perhaps or polarising the efforts sufficiently? Cadence irregularities was my fault as my phone slipped in its holder & it pressed power button. So I had to stop twice to reset it.
Torque chart is not auto zooming very well for some reason. It is not including the rest intervals hence the y-axis starts at the hard interval torque rather than 0. Same with Power which does not go down to 0 or 4W, which was the static rest power level. @greis Can you see if your changes have affected these please? I have copied the charts’ script below in case you can interpret them.
Heart rate wildly inaccurate again due to dodgy HRM. Took Tymewear one but didn’t fit on the strap (Garmin) that I took. So entirely my fault.
I did dual record with my Garmin but the Garmin did not connect to the PM5. I need to check that next time perhaps, as to whether it can connect to both BT (Ergzone) & ANT+ (Garmin watch) simultaneously. The FIT for the Garmin is in my calendar & so you should be able to download it hopefully.
Torque chart script
{
	grouping = true
	streams = icu.streams
        if(! (streams.get("torque") == null)){
	val = streams.get("torque").data				// Define the stream to analyse
	charttitle = 'Torque (Nm) analysis of Work Intervals'		// Set the title for the boxplot
	chartcolor = '#FF00FF'							// Set the color for the boxplot

	let activity = icu.activity
	let wi_nr = []
	let wi_lbl	= []
	let multi_label = []
	let sum_lbl = []
	let result = []
	let data = []
	let boxclrlow = '#FF00FF'

// get list of intervals
	let intervals = activity.icu_intervals || []

// check each interval. If it is a work interval, stock its nr and label in separate arrays.
	for (let i = 0, c = 0; i < intervals.length; i++) {
		let iv = intervals[i]
		if (iv.type !== 'WORK') continue
		wi_nr.push(i)
		++c
		wi_lbl.push(iv.label ? c + '-' + iv.label : c)
		multi_label.push('#' + (iv.label ? iv.label : ''))
		}
	for (let i = 0; i < multi_label.length; i++){
		if (multi_label.lastIndexOf(multi_label[i]) > i && multi_label.indexOf(multi_label[i]) >= i){
			wi_lbl.push(multi_label[i])
			sum_lbl.push(multi_label[i])
			}
		}

// iterate through each Work interval and stock the values (ignore power below 20w)
	for (let i = 0; i < wi_nr.length; i++) {
		let y = []
		let iv = intervals[wi_nr[i]]
		for (let t = iv.start_index; t <= iv.end_index; t++) {
			if(val[t] > 20) y.push(val[t])
			}
			result.push(y)
		}

// next part creates the summary plots
if(grouping){
	for (let j = 0; j < sum_lbl.length; j++) {
		let y = []
		for (let i = 0; i < wi_nr.length; i++) {
			let iv = intervals[wi_nr[i]]
			if ('#' + (iv.label ? iv.label : '') !== sum_lbl[j]) continue
				for (let t = iv.start_index; t <= iv.end_index; t++) {
				if(val[t] > 20) y.push(val[t])
			}
		}
		result.push(y)
	}
}

// create the data for the chart
		for ( let i = 0; i < wi_lbl.length; i ++ ) {
		let boxclr = []
			for (j = 0; j < multi_label.length; j++) boxclr.push(boxclrlow)
			for (j = multi_label.length; j < wi_lbl.length;j++) boxclr.push(chartcolor)
		let plots = {
		type: 'box',
		y: result[i],
		name: wi_lbl[i],
		boxpoints: false,
		//boxmean: true,
		marker:
			{color: boxclr[i],
		}
	}
	data.push(plots);
}

	layout = {
		showlegend: false,
		font: {
			color: chartcolor,
		},
		plot_bgcolor: '#EEEEEE33',
		title: {
			text: charttitle,
			font: {
				color: chartcolor,
				size: 16,
			}
		},
		xaxis: {
			type: 'category'
		},
		yaxis: {
			hoverformat: '.0f',
		},
		margin: {
			l: 20,
			r: 30,
			t: 25,
			b: 60,
		},
	},

	chart = { data, layout }
	}
}
Power chart script
{
	grouping = true
	streams = icu.streams
        if(! (streams.get("fixed_watts") == null)){
	val = streams.get("fixed_watts").data				// Define the stream to analyse
	charttitle = 'Power (w) analysis for Work Intervals'		// Set the title for the boxplot
	chartcolor = '#6633CC'							// Set the color for the boxplot

	let activity = icu.activity
	let wi_nr = []
	let wi_lbl	= []
	let multi_label = []
	let sum_lbl = []
	let result = []
	let data = []
	let boxclrlow = '#9875DB'

// get list of intervals
	let intervals = activity.icu_intervals || []

// check each interval. If it is a work interval, stock its nr and label in separate arrays.
	for (let i = 0, c = 0; i < intervals.length; i++) {
		let iv = intervals[i]
		if (iv.type !== 'WORK') continue
		wi_nr.push(i)
		++c
		wi_lbl.push(iv.label ? c + '-' + iv.label : c)
		multi_label.push('#' + (iv.label ? iv.label : ''))
		}
	for (let i = 0; i < multi_label.length; i++){
		if (multi_label.lastIndexOf(multi_label[i]) > i && multi_label.indexOf(multi_label[i]) >= i){
			wi_lbl.push(multi_label[i])
			sum_lbl.push(multi_label[i])
			}
		}

// iterate through each Work interval and stock the values (ignore power below 20w)
	for (let i = 0; i < wi_nr.length; i++) {
		let y = []
		let iv = intervals[wi_nr[i]]
		for (let t = iv.start_index; t <= iv.end_index; t++) {
			if(val[t] > 20) y.push(val[t])
			}
			result.push(y)
		}

// next part creates the summary plots
if(grouping){
	for (let j = 0; j < sum_lbl.length; j++) {
		let y = []
		for (let i = 0; i < wi_nr.length; i++) {
			let iv = intervals[wi_nr[i]]
			if ('#' + (iv.label ? iv.label : '') !== sum_lbl[j]) continue
				for (let t = iv.start_index; t <= iv.end_index; t++) {
				if(val[t] > 20) y.push(val[t])
			}
		}
		result.push(y)
	}
}

// create the data for the chart
		for ( let i = 0; i < wi_lbl.length; i ++ ) {
		let boxclr = []
			for (j = 0; j < multi_label.length; j++) boxclr.push(boxclrlow)
			for (j = multi_label.length; j < wi_lbl.length;j++) boxclr.push(chartcolor)
		let plots = {
		type: 'box',
		y: result[i],
		name: wi_lbl[i],
		boxpoints: false,
		//boxmean: true,
		marker:
			{color: boxclr[i],
		}
	}
	data.push(plots);
}

	layout = {
		showlegend: false,
		font: {
			color: chartcolor,
		},
		plot_bgcolor: '#EEEEEE33',
		title: {
			text: charttitle,
			font: {
				color: chartcolor,
				size: 16,
			}
		},
		xaxis: {
			type: 'category'
		},
		yaxis: {
			hoverformat: '.0f',
		},
		margin: {
			l: 20,
			r: 30,
			t: 25,
			b: 60,
		},
	},

	chart = { data, layout }
	}
}
1 Like
Hi David, suggestion, please use “```” without the ", in the line before and in the line after your scripts for full forum script readability.
2 Likes
Apologies. I do not really undersrand how tgese things work. I think that i have done you suggested. Has it made the necessary difference.
Use the grave accent symbol, not the acute, copy what I posted.
Apologies. My eyesight didn’t pick up the difference as i am on my phone now. I think that i have changed it correctly?
1 Like
Ergzone - 3.33km, 16:59min
202.0Joules per Stroke
Garmin with ErgIQ app - Forerunner
17:05min - No km Data
161.8Joules per Stroke
I need to test with ROw, so i can use direct garmin app ; anything i can help for testing?
One thing I noticed: I did a 10 km session. In the .FIT file from ErgZone, Intervals.icu shows it as my best 10 km of the season.
To get the Moxy data, I merged the Garmin and ErgZone files in GOTOES. This merged file shows the data exactly the same, but it does not save or appear as my best 10 km of the season.
For both files, I have “Ignore velocity data” enabled (I’m not sure if that makes a difference). Both files have the same settings.
Do you think this could be something related to Intervals.icu, @David?