Let me give a suggestion, i was having an issue with my laptop screen after the second custom chart i cannot see the values i was hovering in the bars.
This is my suggestion, for that container to be sticky at the top when you scroll.
Yes I guess if you get take the kcal per week total number and divide it by the weight you get the METs-hour figure.
Sometimes publications use METs-hour sometimes they use METs-minute to classify people accoding to their physical activity.
Anyway, I guess people using intervals.icu are a majority of sports passionate who do > 1000 METs-min per week of physical activity, well above the american guidelines
We can also see METs as a rough/easy way to estimate training load
When displaying bar charts on a day by day basis today’s bar (or the last one) is always missing as they are offset to the right in comparison to the points.
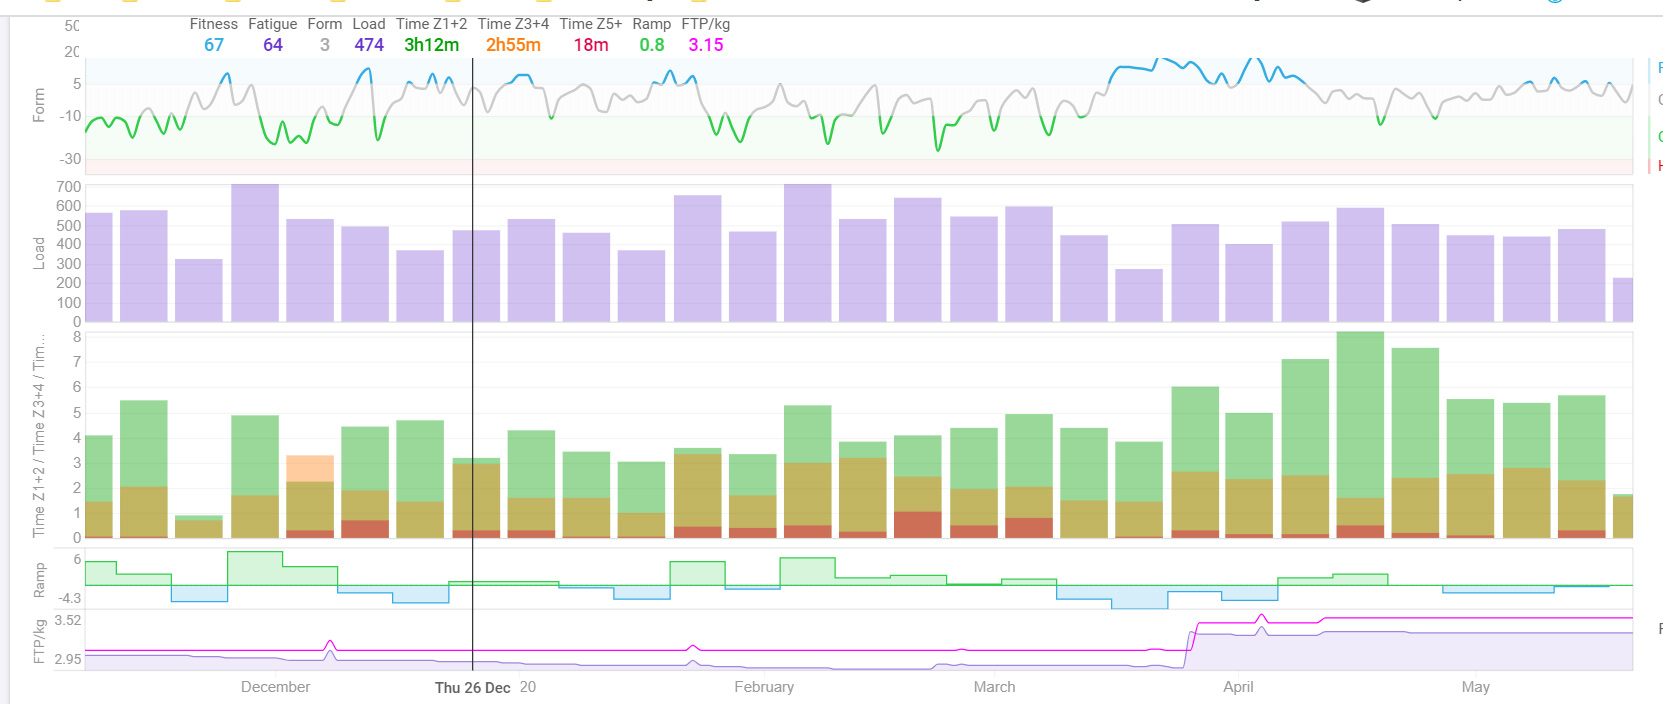
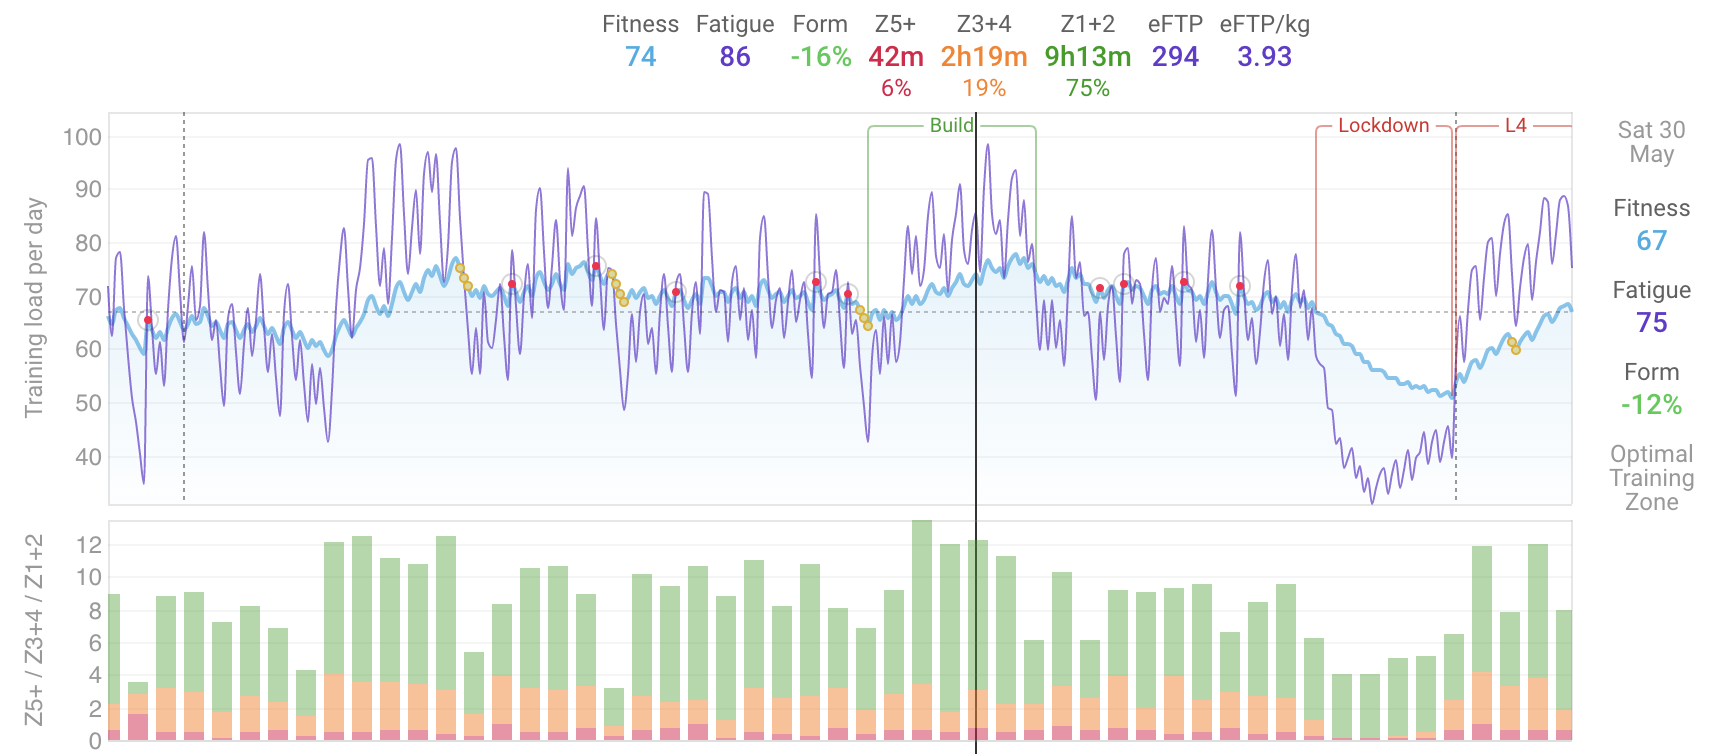
I have added a ramp rate plot which is fitness today - fitness 7 days ago. Also added a 7 day moving average (default for ramp rate) and 42 day moving average.
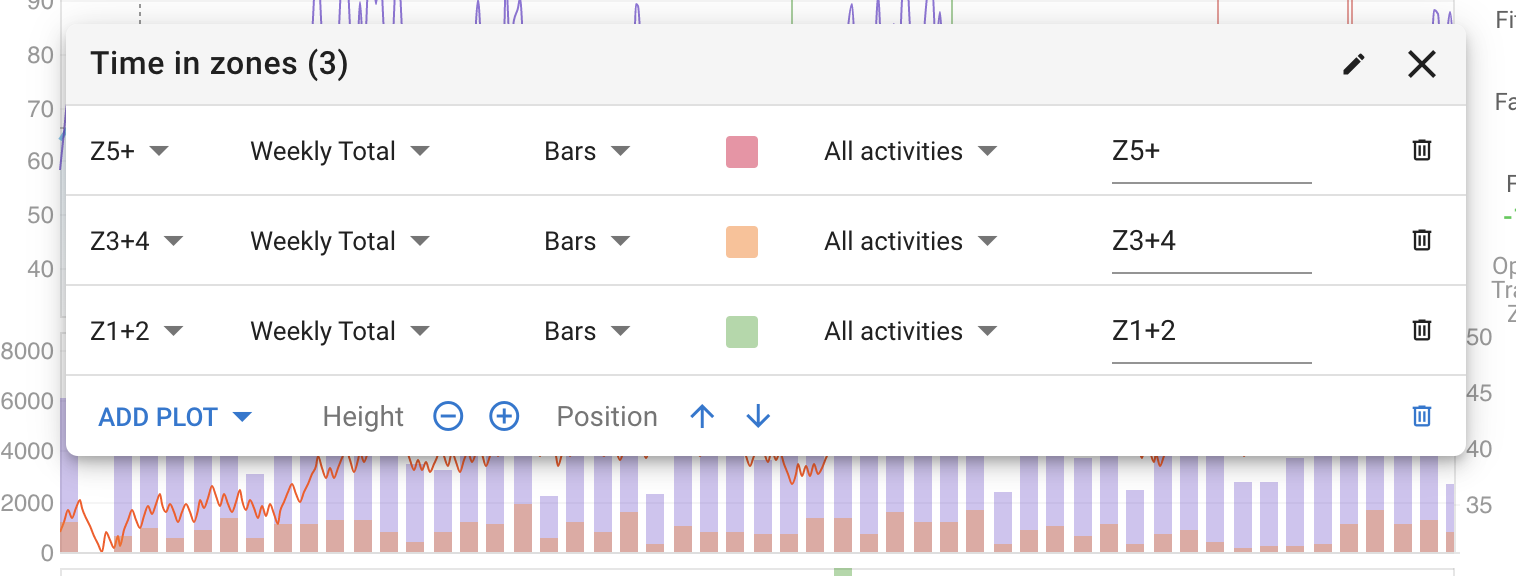
Compatible bars now stack. Currently this only happens for the “Sieler” zone plots (Z1+2 etc.). If you already have a chart with these on you need to remove and re-add them to see the stacking.
Could there be the possibility to add a horizontal line to these custom plots. As an example: I have goal of reaching 250 km per week, and it would be great to see a horizontal line in the custom distance graph, to see which weeks I’ve reached this goal.
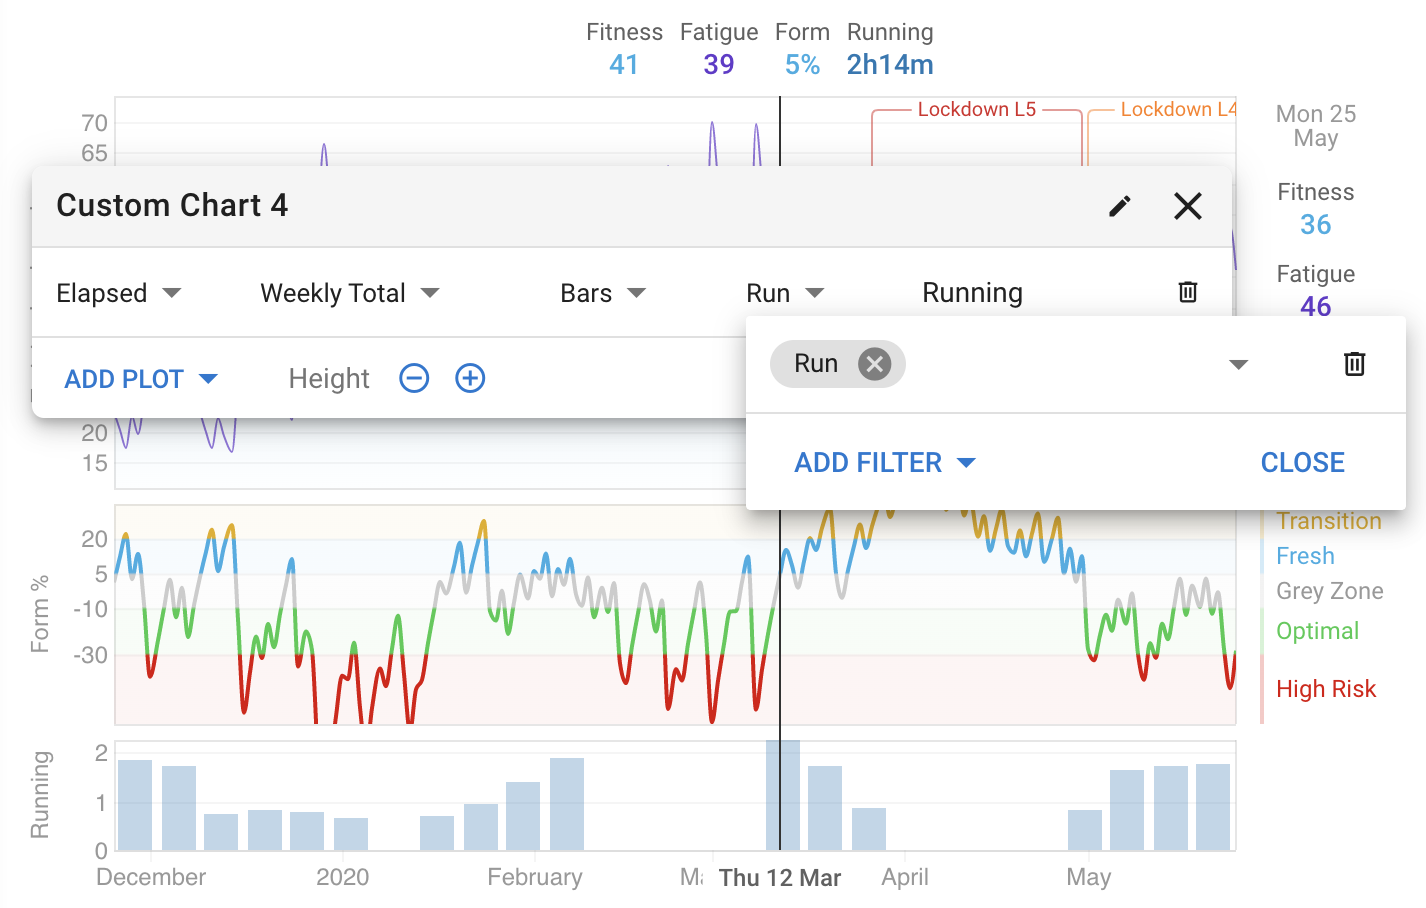
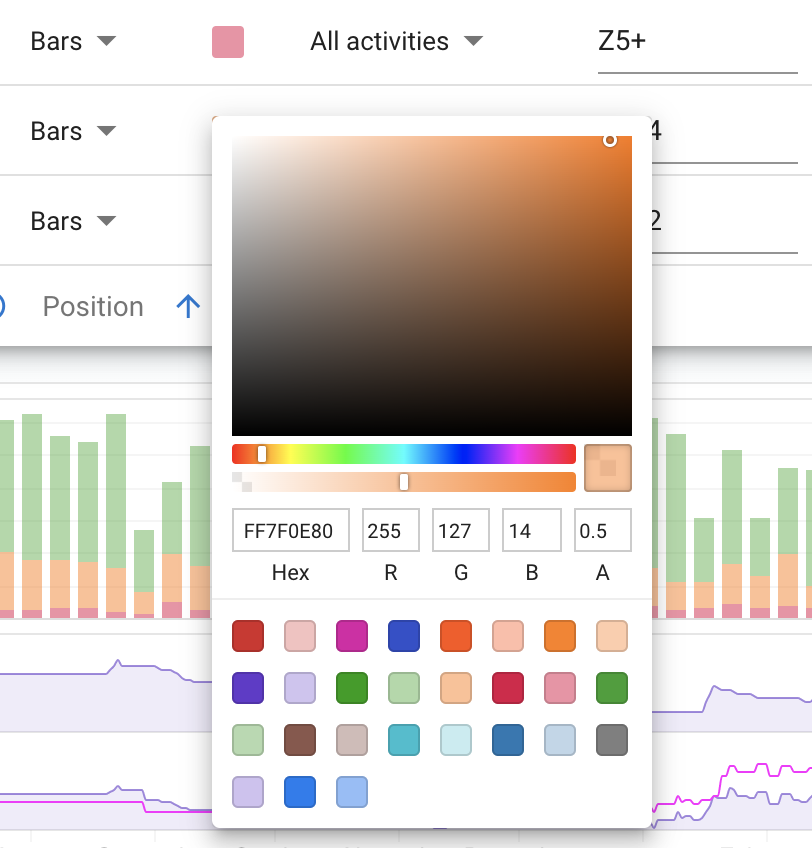
You can now filter the activities used for a plot and change the axis label. This one is showing time spent running. Going to do plot colours and so on tonight.
Nice work, this website is better and better.
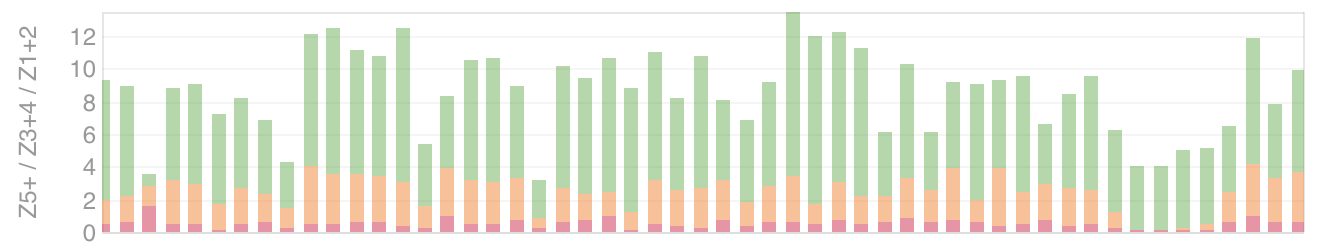
Can we sort the zones the other way, so we can have Z1+2 at the bottom, Z3-4, and then Z5+ like in 30s power graph, i think it is more logical
Thank you.