I have finally managed to make some progress with custom charts for the fitness page. Still lots to do but will go quickly now. Need to add totals, moving averages, filtering all sorts of stuff. And lots more fields.

27 Likes
I am quite excited about the capabilities this adds to Intervals.icu. Took a day off work yesterday to make progress and of course I got sick. Don’t think its COVID-19 and getting better already. Its amazing with all the social distancing and all I still managed to catch something 
8 Likes
In H. G. Wells War of the worlds, it takes but the smallest constellation of molecules, a structure in between next to nothing and the simplest form of life; a Virus, to bring down our planet’s biggest dismantlers.
The one in circulation these days, seems to hit indiscriminate between the weakest, the oldest, the most unfit, where we could have wished for the one Wells made up, to go and hit today’s biggest destroyers.
But, like everything else appearing in our path in life, we will have to learn to live with it, learn to take our precautions, learn how to fight it.
It seems, with Covid19, that having a healthy and fit body, works like an amour. All other more normal diseases are still around, and will hit like normally.
Take your day off, stay healthy, stay fit, and keep your program growing like with these latest additions, for more humans to raise interest and awareness in how far we can go, how fit we can be, how strong we can become.
3 Likes
It’s not for lack of trying that our greatest destroyers haven’t been stricken yet - on the contrary, thei foolish actions are only costing more people their health and - worst case scenario - their lives…
This is looking great!

4 Likes
Hey @david - hope you’re feeling better.
These charts look great! I’m struggling to fully understand what some of them are showing me. E.g. what exactly is “Intensity %”?
Tx, yep recovered. I still need to add the help in various places. What you can do is click the numbers at the top of the charts to get a help popup:
The intensity of a ride is a measure of how hard it was compared to your FTP. It is calculated by dividing the normalized watts or weighted average power for the ride by your FTP. If you are able to complete a ride of 1 hour or longer at more than 100% intensity then your FTP is too low. For activities without power intensity is derived from the training load and duration.
I am going to me adding a lot more things to plot and ways of aggregating + filtering for which activities to include. This should make it easier for everyone here to figure out what the interesting things are and what the mean.
7 Likes
@david hope you are feeling better.
This looks amazing, your work is really great!
About the charts, would like to request if when we add a custom chart, to be able to pick the color we want it with.
thank you
Got you, great.
Certainly there’s lots of interesting things to play around with. Plotting weekly load as bars against weekly Kj>FTP in lines creates a quick snapshot of relative amounts of intensity and volume.
Still searching for that perfect pot-of-gold-at-the-end-of-the-rainbow metric, but if it’s anywhere, it must be in here! So many options…
1 Like
Tx. Yes I am going to make all that customisable.

7 Likes
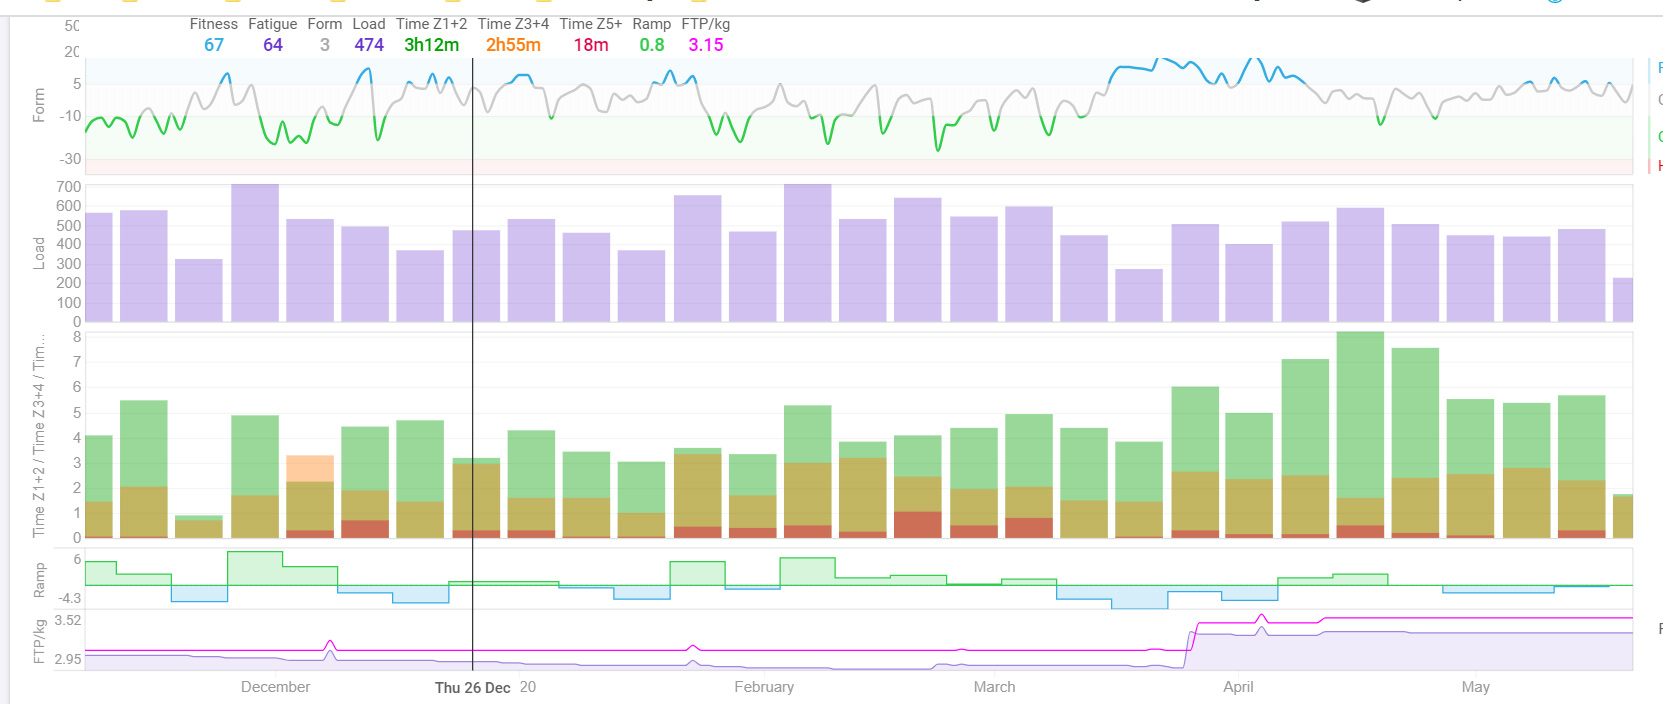
I added plots for time in Z1+Z2, Z3+Z4 and Z5+.

Note that these bars are overlapping not stacked! I am going to add a “stack bars” option but overlapping is actually quite nice for this case (comparing time in Sieler style zones).
7 Likes
Incredible and amazing job congrats and thanks a lot. Just one question regarding the kcal, instead of taking them from Strava I think you could make a more accurate calculation by doing Work = integral(power*dt), dunno if this is what Strava is supplying though, I speak from memory but I read somewhere they use some correlations with heart rate to calculate the kcal.
Strava says they get kcal from their data sources providers. So in my case its what my Garmin spits out and I have no idea how that is calculated. For rides with power I could just use the kJ of work and assume an efficiency of 21 - 23%. You can more or less just look at the work number and use that as kcal since 1 kcal = 4.184 kJ.
Related thread:
https://forum.intervals.icu/t/weekly-mets-min-or-mets-hour/765
1 Like
Garmin uses Firstbeat for this and if I remember correctly, the quality of the estimate depends largely on HRV accuracy…
Yeah, that is what I was referring to, absolutely amazing job and kudos again!
Let me give a suggestion, i was having an issue with my laptop screen after the second custom chart i cannot see the values i was hovering in the bars.
This is my suggestion, for that container to be sticky at the top when you scroll.
IN CSS:
Add .fitness-chart {
position: relative;
}
Add also this
.fitness-chart .stats-row {
position: sticky;
top: 0;
background: #FFF;
z-index: 1;
}
2 Likes
Yes I guess if you get take the kcal per week total number and divide it by the weight you get the METs-hour figure.
Sometimes publications use METs-hour sometimes they use METs-minute to classify people accoding to their physical activity.
Anyway, I guess people using intervals.icu are a majority of sports passionate who do > 1000 METs-min per week of physical activity, well above the american guidelines 
We can also see METs as a rough/easy way to estimate training load
Thanks! Done!
Bug report:
When displaying bar charts on a day by day basis today’s bar (or the last one) is always missing as they are offset to the right in comparison to the points.
Mike