Not directly (yet). However you can display the value from any /fitness page plot on the calendar. And you can plot custom activity fields on the /fitness page.
I am using a custom field on the whole activity by taking power (for cycling) via:
streams.get(“fixed_watts”).data
This works but it would be very nice to have the value calculated for a chosen part of the ride as well (when I mark part of the activity). This works for a default field “Average power” for example.
It’s probably very basic question, I could answer it myself if there was a way to see the code used to calculate default fields. Is that possible? It would make tinkering with things easier as one could just copy-paste the code and then edit it for their needs.
The default fields are all calculated in Java (very fast) whereas the custom ones are done in Javascript running in a sandbox (much slower but safe to run untrusted code). I can post Java fragments of specific things.
You can create custom interval fields to compute things for parts of an activity. These are also computed when you zoom on the timeline chart and displayed top left. So that might handle your “part of the activity” requirement.
1 Like
Could it be a feature request to add a field for lacate? Most runners I know take a lactate measurement during each workout, which for many translates to 3-6 workouts a week besides long/easy running. Having the lacate displayed on the calendar view like pace, GAP, etc. would be a great enhancement for runners. It could be something as simple as the feel parameter, where you just input “x.xx”, and at which interval you measured it.
Lactate: 2.0mmol
Measured at: 4th interval
sounds like this can be a custom wellness field capture?
It should be related to the activity imo. You can also take multiple readings in one workout. Would also be great in compare view for the same workouts. For many runners lactate is a much more important measurement compared to for example HR. The norwegian model for example soley base itself on lactate readings. Most of the runners I know/follow take a picture of the lactate reading and post it on strava to log the measurements. If intervals.icu would support logging and displaying it, that would be extremely useful.
2 Likes
I have “editable sparse custom activity streams” on the todo list. Like the current custom streams but supporting sparse streams (only a few points) with UI to edit for manual capture (+ CSV upload and so on).
1 Like
Sounds great. Considering how wildy used it is I would consider adding it as a “standard” field for all users, but as long as I can record it I am happy ![]()
Hello!
I created 6 custom fields to calculate the work done in each zones; but in the custom chart the “100% stacked bar chart” isn’t displayed. for sure i’m missing something.
Here the code for Z1:
pData = streams.get(“fixed_watts”).data;
ftp=activity.icu_ftp
pZones = activity.icu_power_zones;
z1min = 0
z1max = ftp*(pZones[0]/100);
joules = 0;
for (let w of pData) {
if (w >= z1min && w < z1max) {
joules += w;
}
}
joules / 1000;
Thank you for help
1 Like
How can we create a custom bar chart with 100% stacked bar displayed? no displays this option un custom values within custom % values.
I have finally got this done. Click the dot dot dot button next to the plot:
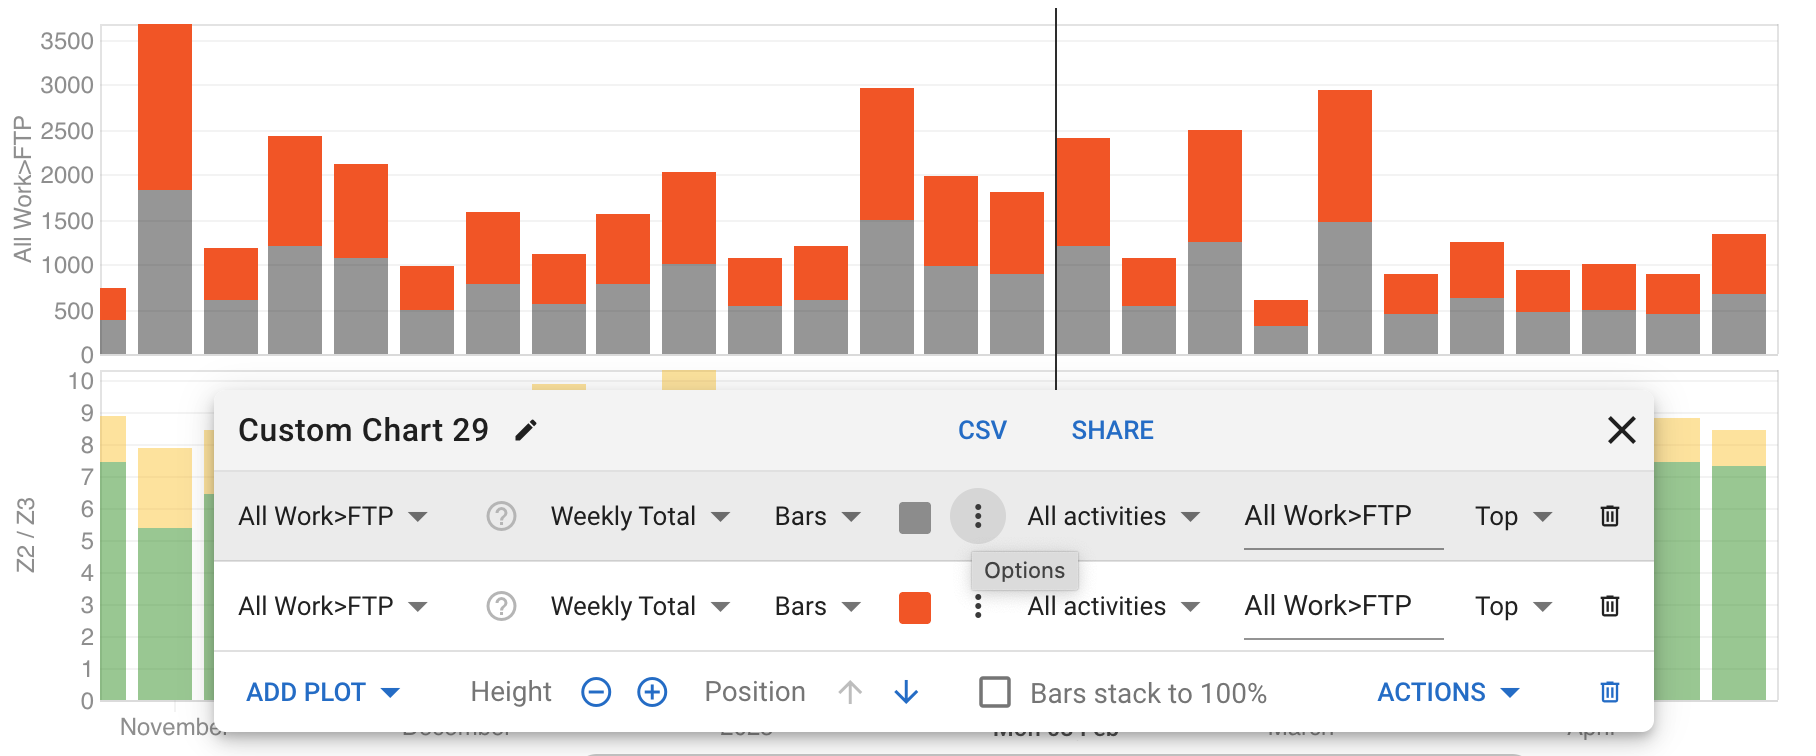
Then change the stack field from blank to whatever you like to make the bars stack. You can edit the field and do not have to pick from the drop down.
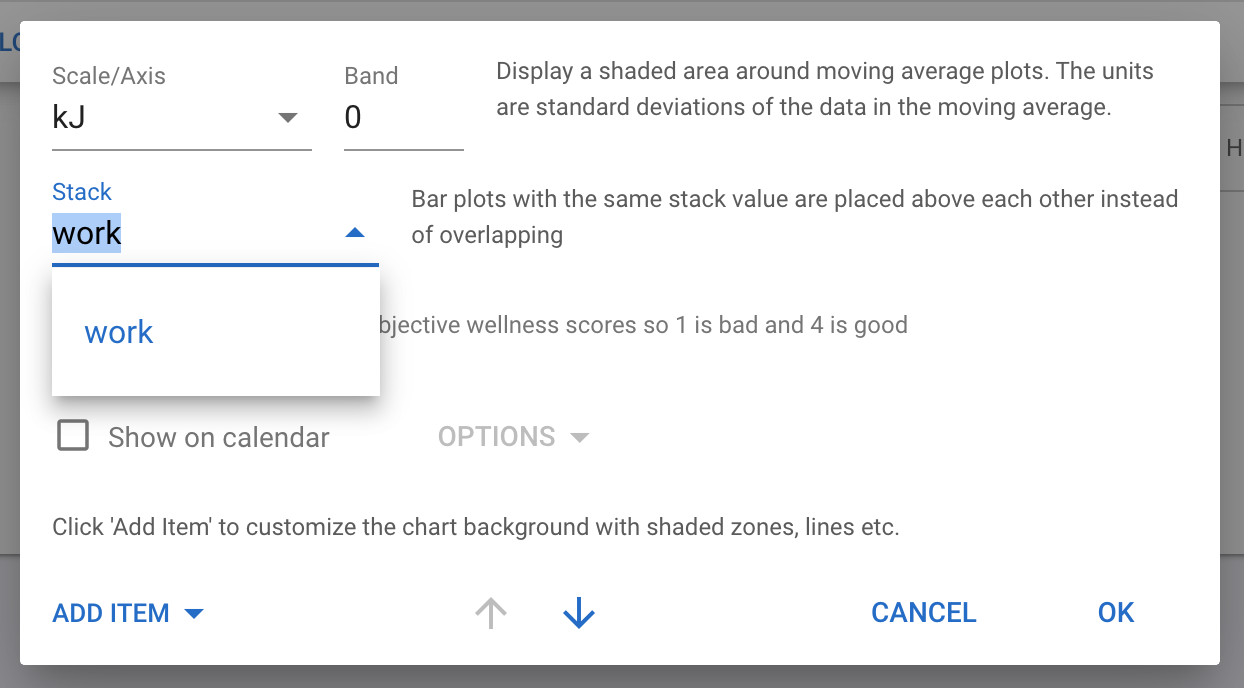
This works for custom and build in fields.
1 Like
Absolutely love the custom activity fields, maybe the most powerful tool ever developed in this space. Potentially a stupid question but is there a library or glossary of all the variables and streams available? Searched for it and could not find any reference, and guessing the name of variables only got me so far…
1 Like
check tat
2 Likes
You can now add these to sports:
I am sure this was asked before, but I can’t find it. I like the VO2max custom fields, but I have a few activities that are shorter than 5min that have totally unrealistic numbers for vo2max.
I would like to filter those activities in the script by only compute a value if the whole activity is longer than 5 minutes.
Any suggestions?
Many thanks.
Just put an if statement around your script:
if(icu.activity.elapsed_time >= (5 * 60))
{
// script here
}
1 Like
Thanks!
Edit: but if I understand the functionality of this if clause right, then it computes only a value for the VO2max, after 5min in the activity.
Say I have a 20min long run, does it only compute the last 15minutes?
Maybe I am wrong, but If I only want to exclude the short workouts, would it not be better to check the whole duration of the activity and break the script when it is shorter than 5 minutes.
Maybe your suggestion does exactly this. Than sorry for questioning…
The statement simply checks if the total elapsed time is more then 5 min. If this is not the case, the script will not run.
2 Likes
This is awesome, although I can’t seem to have it backfill for all my previous activities, I am trying to look at xEFF for running GAP/HR essentailly, and when I got to previous activities, I can’t see the new metric I made?
You have to reanalyse old activities.
From inside an activity try Actions > Analyse
For Bulk Action Goto the Activity List, then select all old activities and do it from Edit > Analyse
1 Like