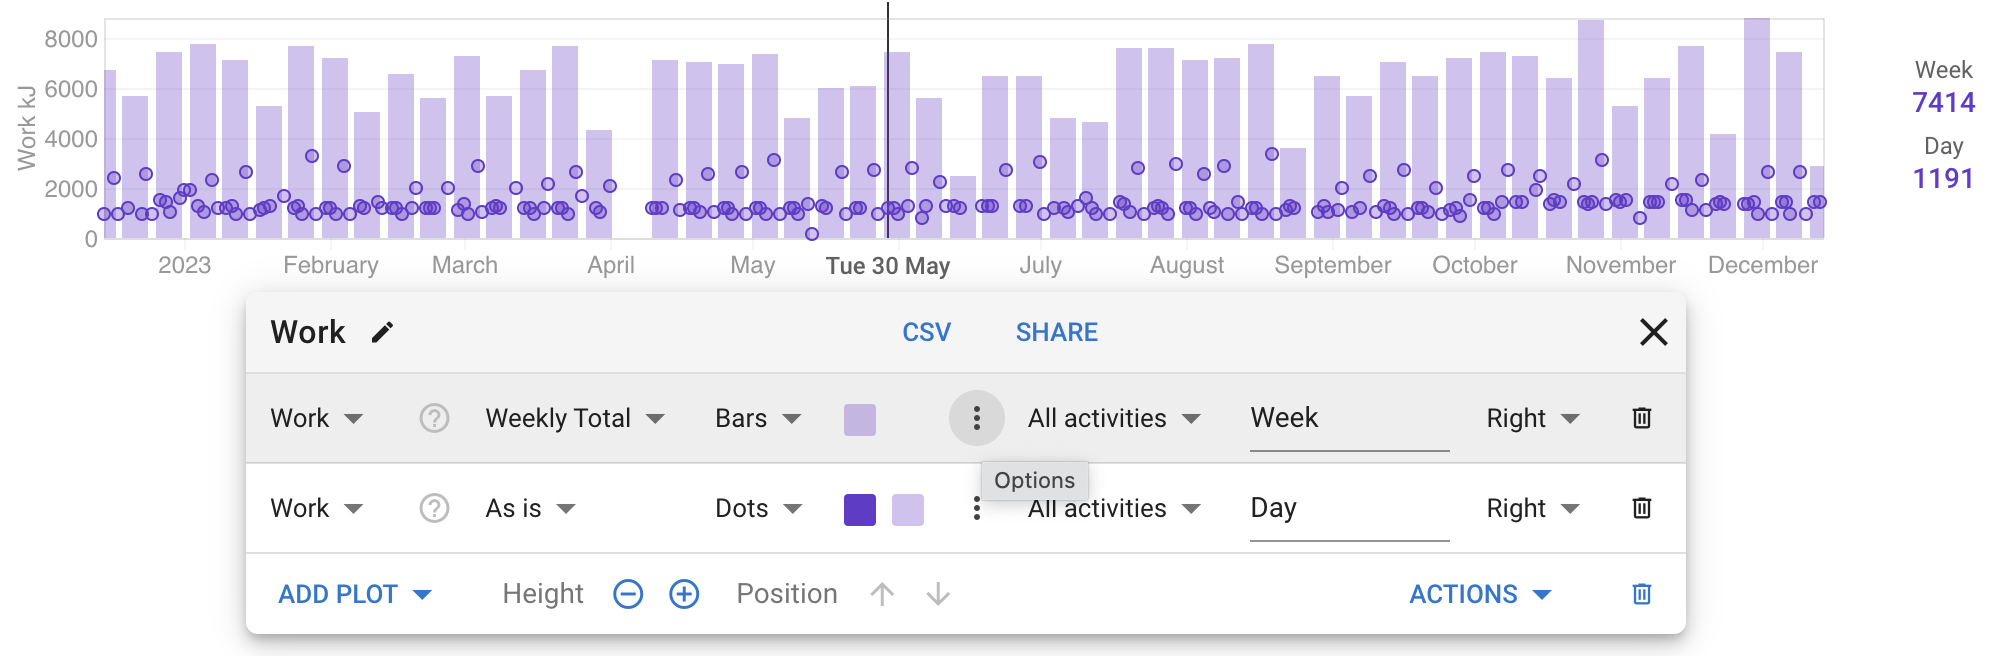
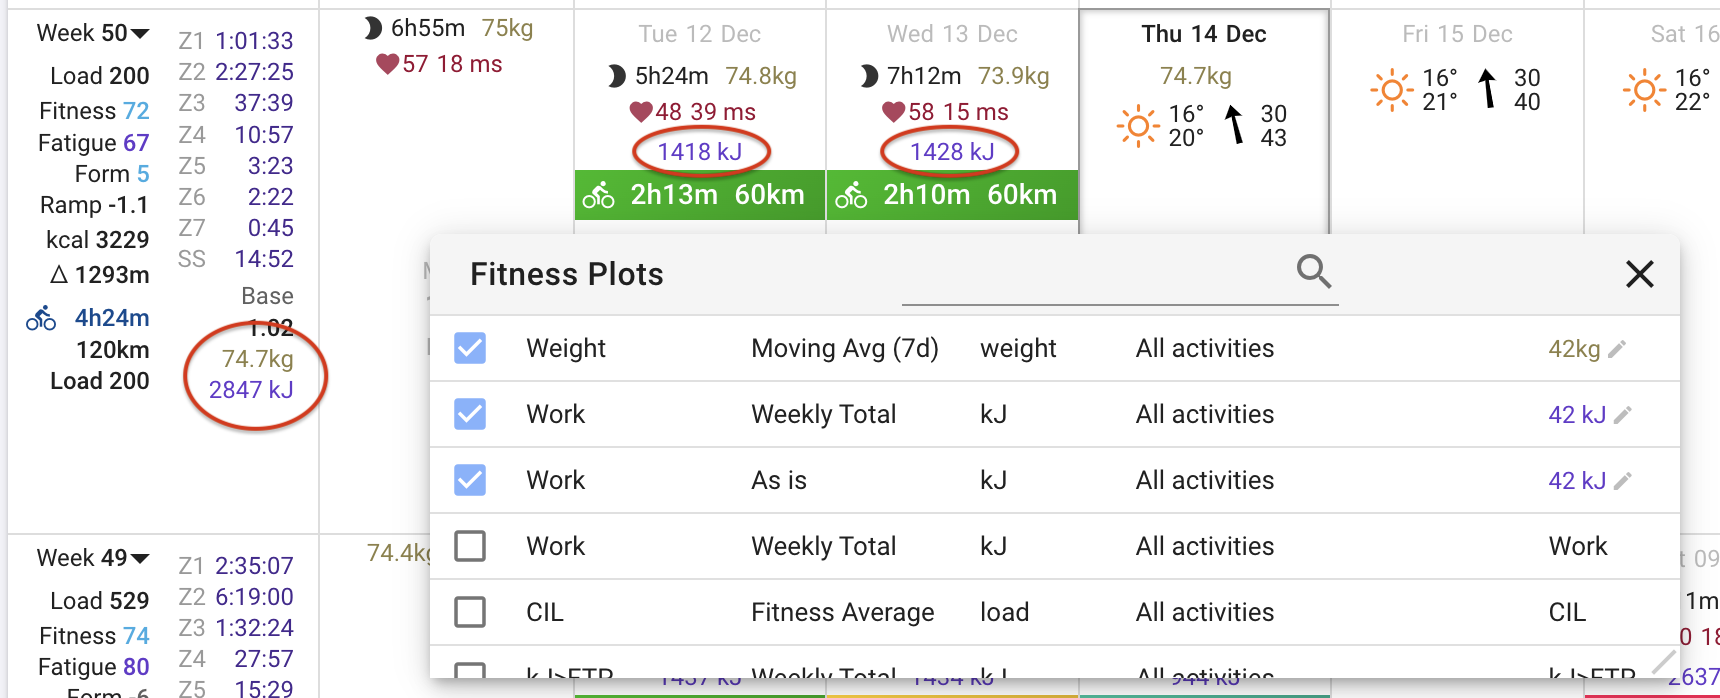
Values from plots on custom charts on the /fitness page can now be added to the calendar. In this example I have added a custom chart showing work done per day (kJ) and the total for each week:
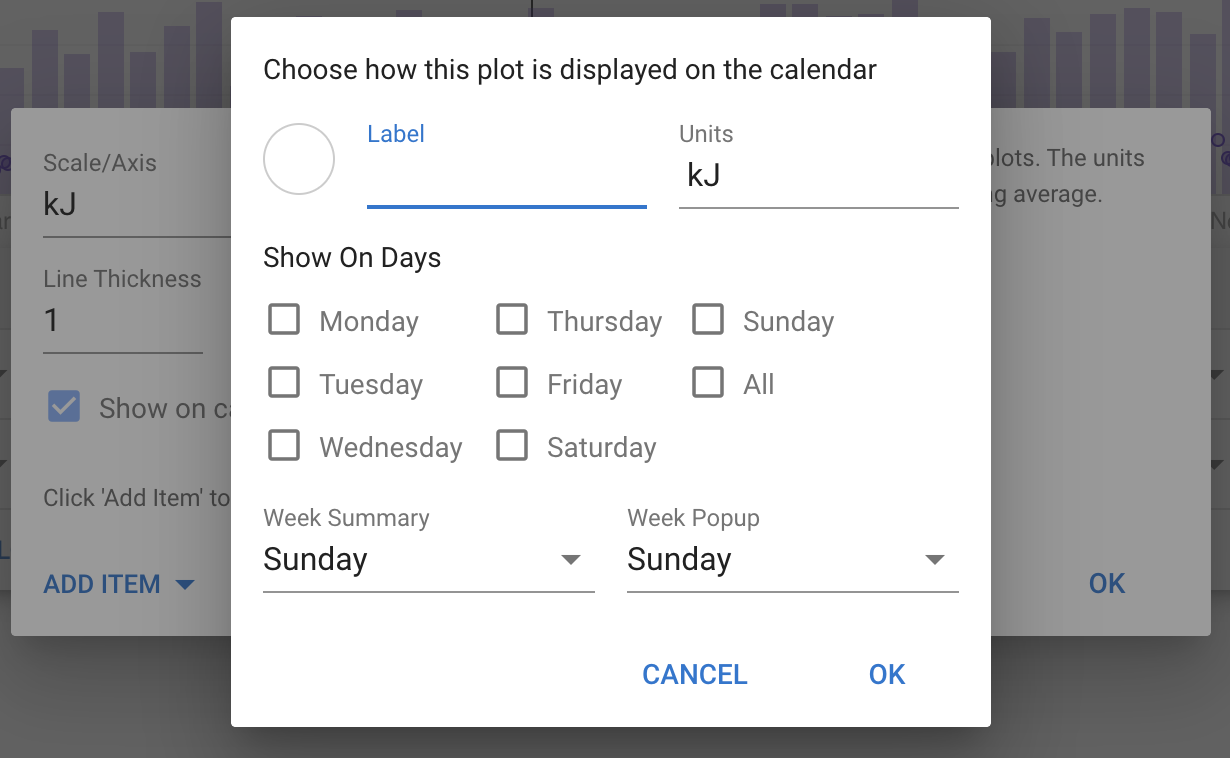
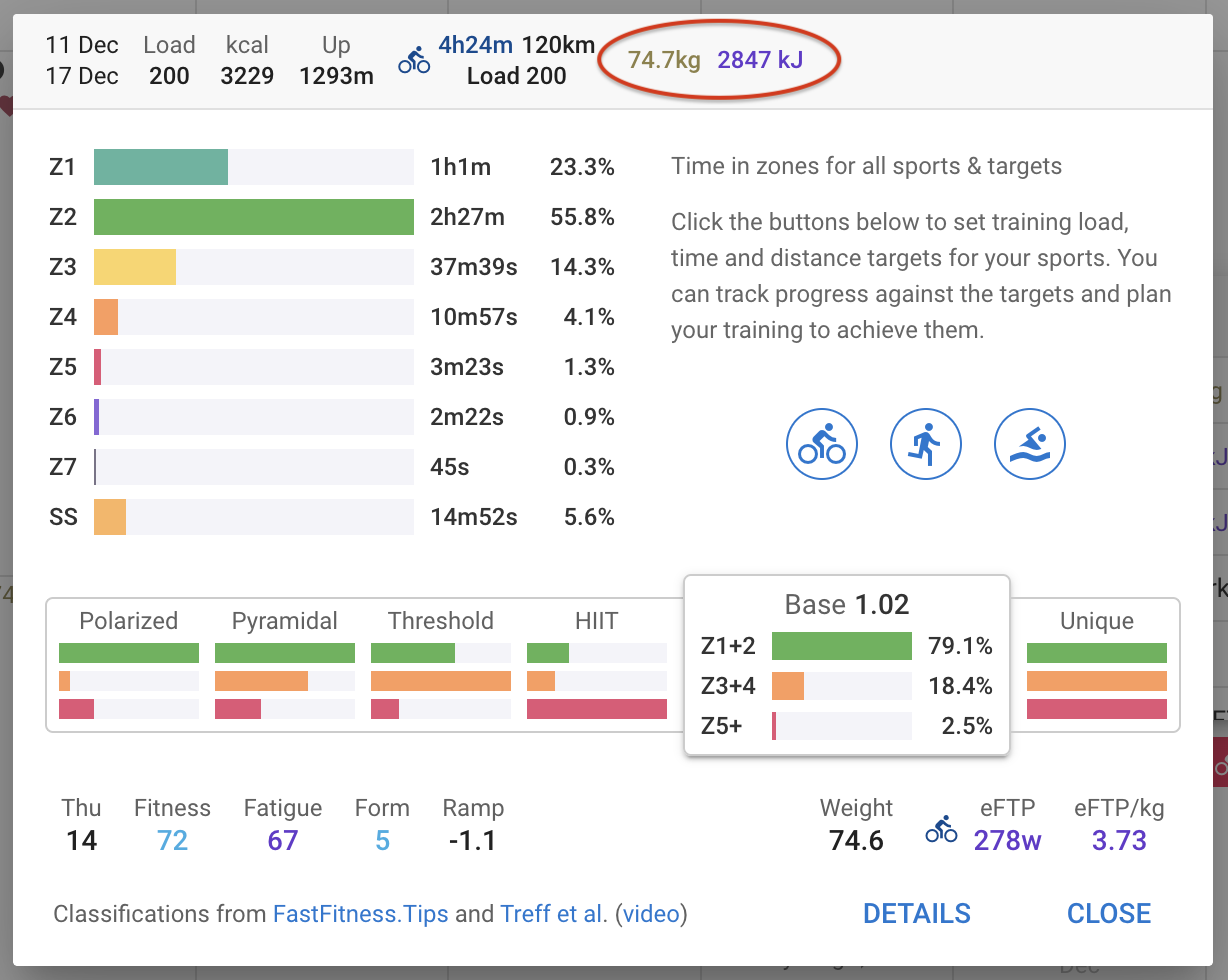
To display this data on the calendar click the dot dot dot menu and tick the “Show on calendar” box. Then choose where and how it should be displayed. In this case the Sunday value is displayed in the weekly summary area and in the week popup.
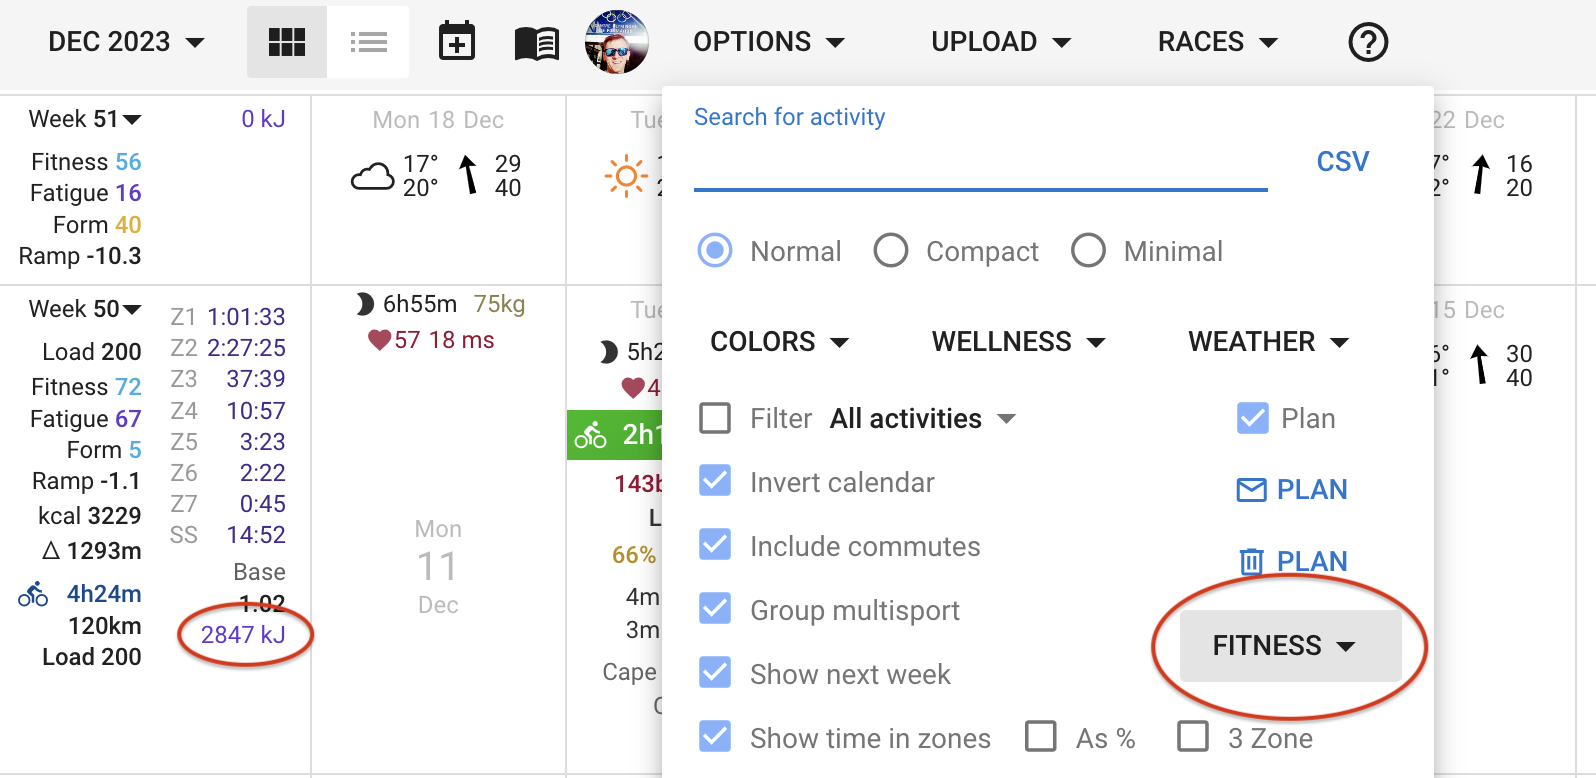
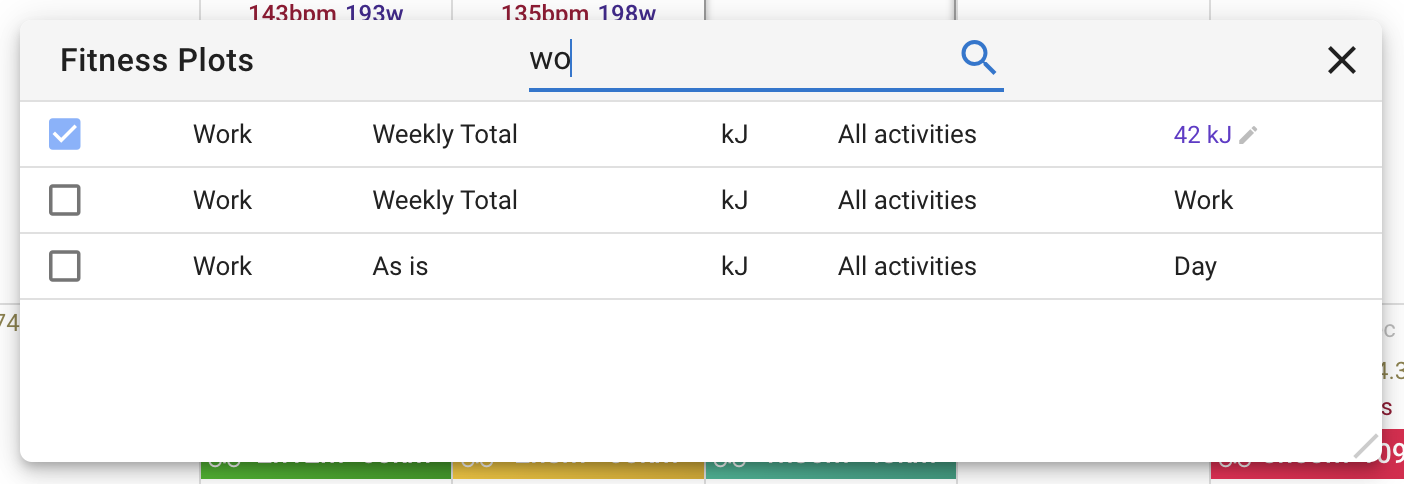
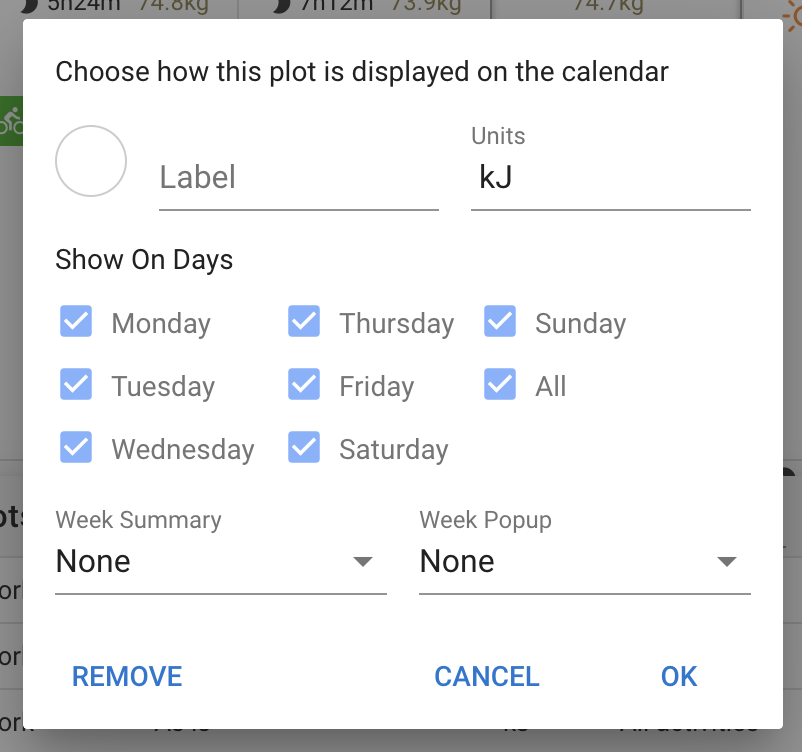
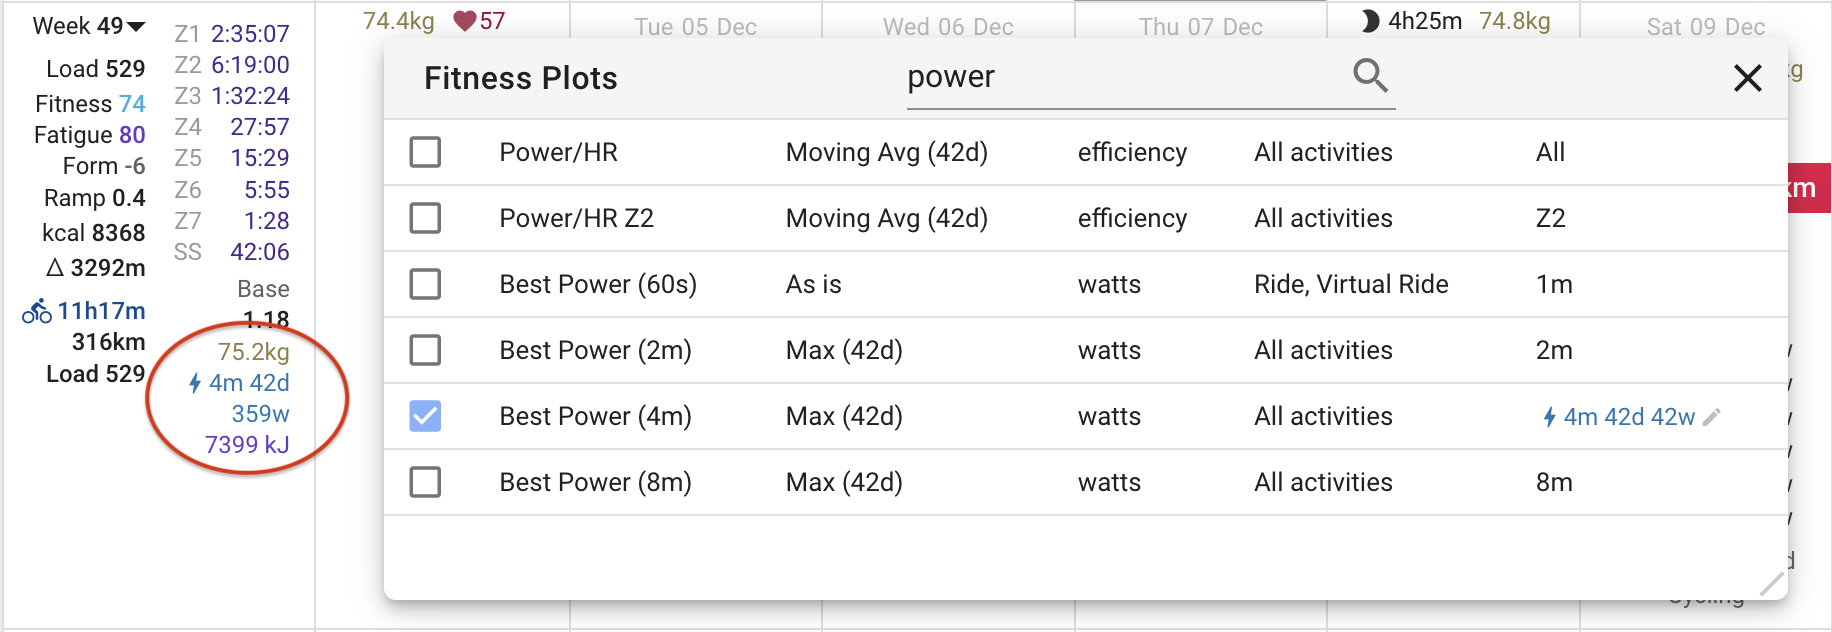
Click the checkboxes to add/remove items from the calendar. To show total work in kJ for each day tick the “Work As is” box and tick all the days and change the week options to “None”:
Does this function only read from the completed workouts, or would it function to ascribe TSS values, say, to specific days — or would that action still need to be performed in the workouts page?
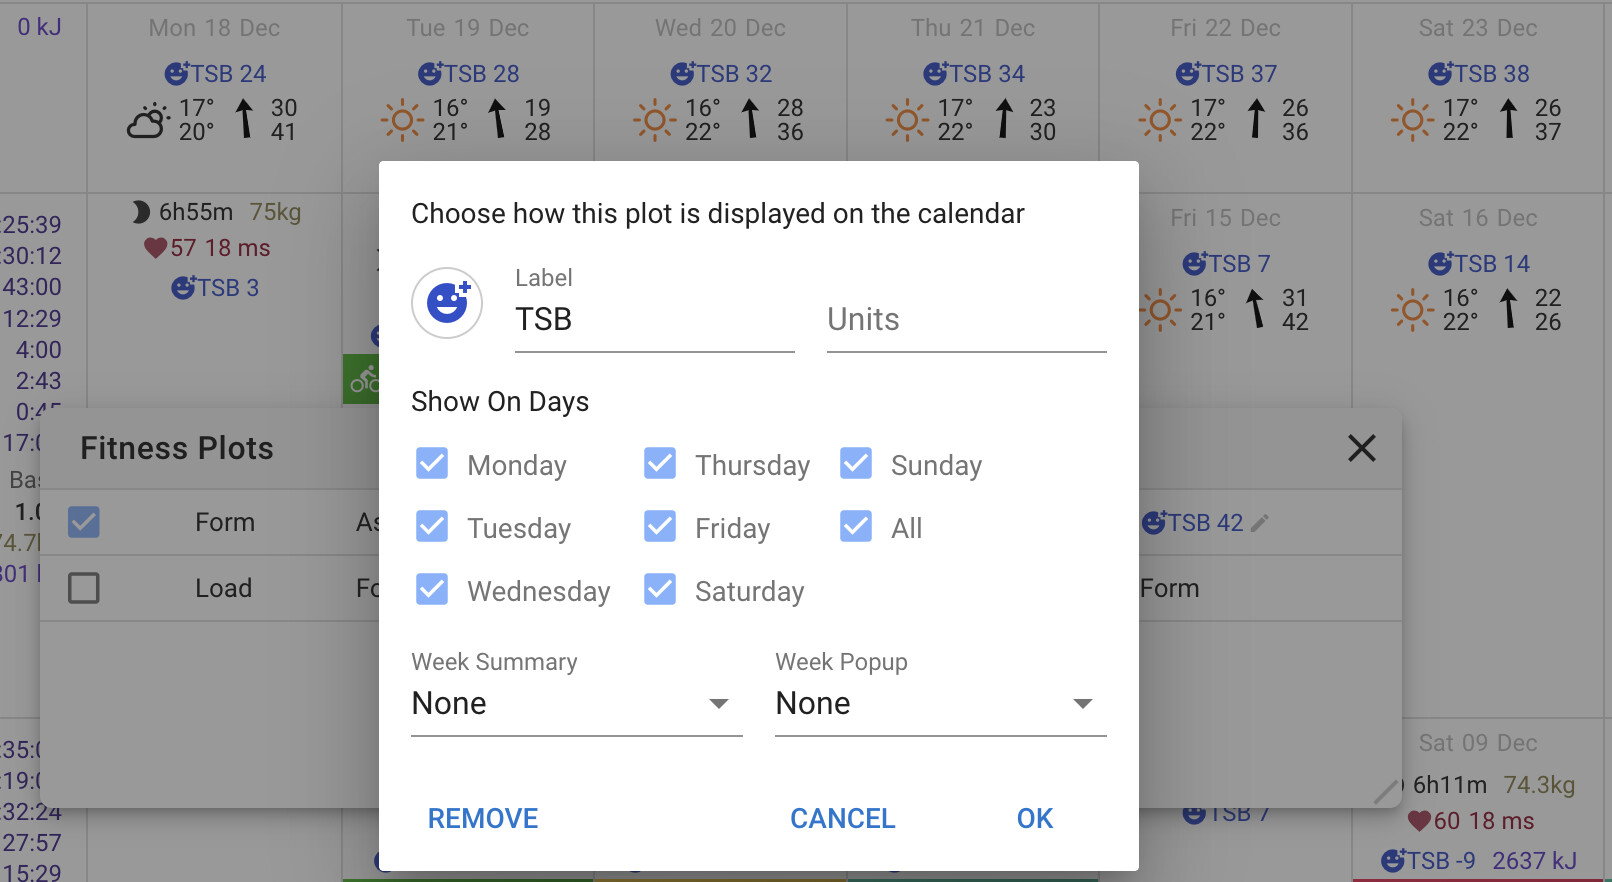
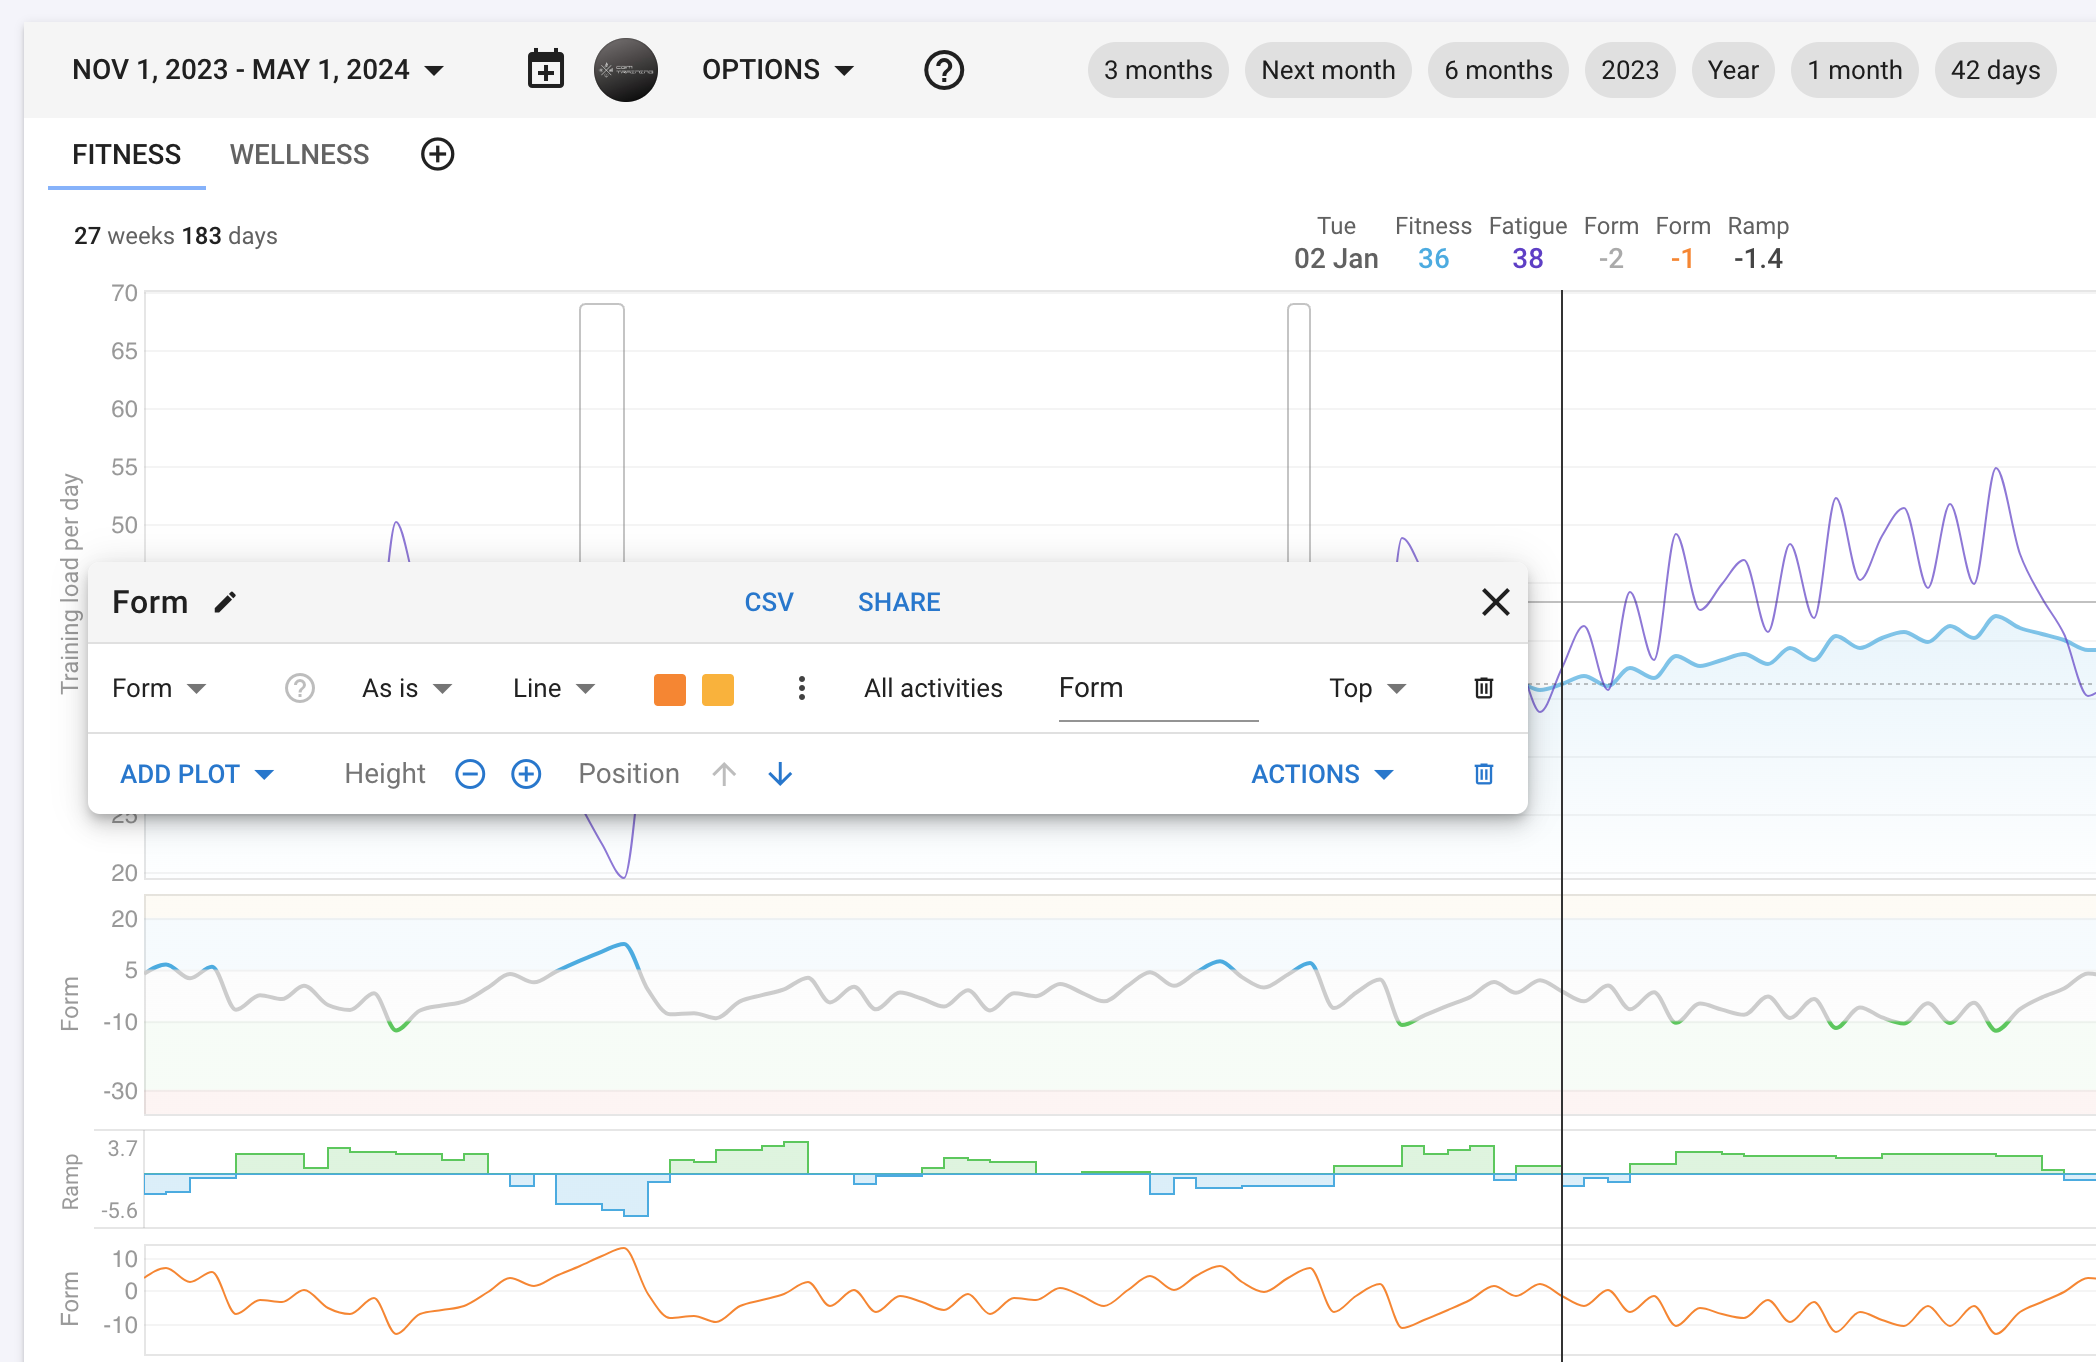
I added custom plots for fitness, fatigue, and form, and I noticed that form sometimes differs by 1 in the calendar vs the fitness chart. Am I doing something wrong or is it a known issue? See screenshot attached.
No that is normal. These use an exponentially weighted moving average so to be perfectly accurate you need to consider all history. The pre-computed “built in” ones do this but it would be slow to have to load all prior activities for the fitness charts. They go back 184 days which is a reasonable compromise.
I’m trying to clarify how the display order of custom fitness plot metrics is determined in the weekly calendar view when multiple charts and metrics are involved.
When using a single chart, the logic is clear: the top value in the chart appears first in the calendar. But what happens beyond that? How is the sequence handled across multiple charts and different tabs?
To solve the layout problem, is it a common workaround to create a “hidden” master chart at the very top of the first fitness tab containing all required values to force a specific order?
Does the system simply follow the tab index (left to right) and then the chart creation date? Or is there a better way to manage this?