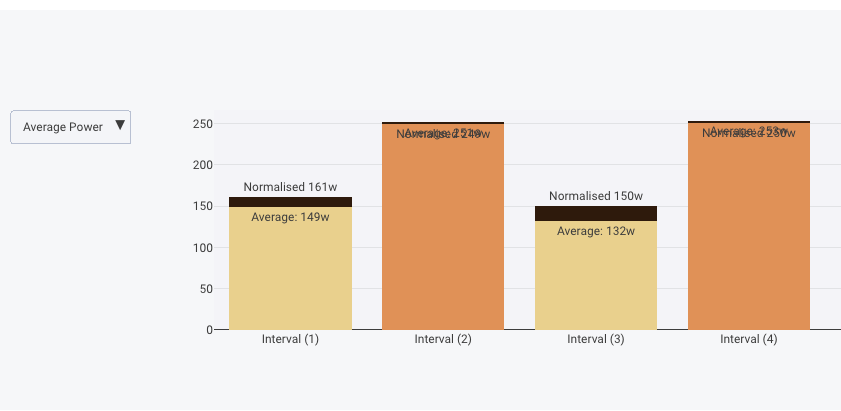
You can reduce the size of the margins using the layout object:
layout = {
title: {
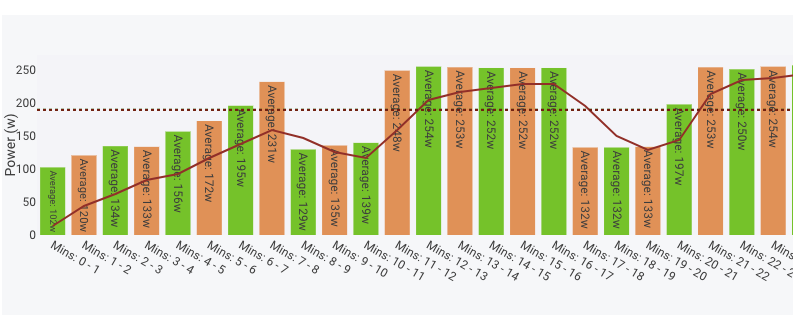
text: "Average power for work intervals"
},
margin: {
l: 20,
r: 20,
t: 20,
b: 20
}
}
I need to provide some more info and add a few more settings for mobile. If you set the width of your chart to say “40%” then it will be tiny on mobile. The width and height are css and I am going to add support for some others (e.g. flex for growing when there is space).
I am going to be looking into how to support records and other things with lots of values soon. But at the moment you can’t do much.
I am sharing linFit function that estimates best linear regression for data (x, y)
Arguments for this function are as follows:
x: array of x values
y: array of y values
The function returns an array of 2 elements [m, b], where
m: slope of the linear regression
b: intercept of the linear regression
To use it in your custom charts, just copy the function at the end of the script and call it from your code as below:
p = linFit(x, y);
Then you can calculate estimated y (ye) for a given x (xk) as:
ye = p[1] * xk + p[2];
Chart RRa1 shows one implementation of this function (with some modification for that specific purpose).
I hope it is useful for developing more and more awesome charts.
Code for the linFit function:
function linFit(x, y) {
	let SXi2 = 0;
	let SXi = 0;
	let SXiYi = 0;
	let SYi = 0;
	let n = x.length;
	for (let i = 0; i < n; i++) {
		SXi = SXi + x[i];
		SXi2 = SXi2 + x[i] * x[i];
		SYi = SYi + y[i];
		SXiYi = SXiYi + x[i] * y[i];
	}
	let det_A = SXi2 * n - SXi * SXi;
	let m = 0;
	let b = y[0];
	if (det_A != 0) {
		m = (SXiYi * n - SXi * SYi) / det_A;
		b = (SXi2 * SYi - SXiYi * SXi) / det_A;
	}
	return [m, b];
}
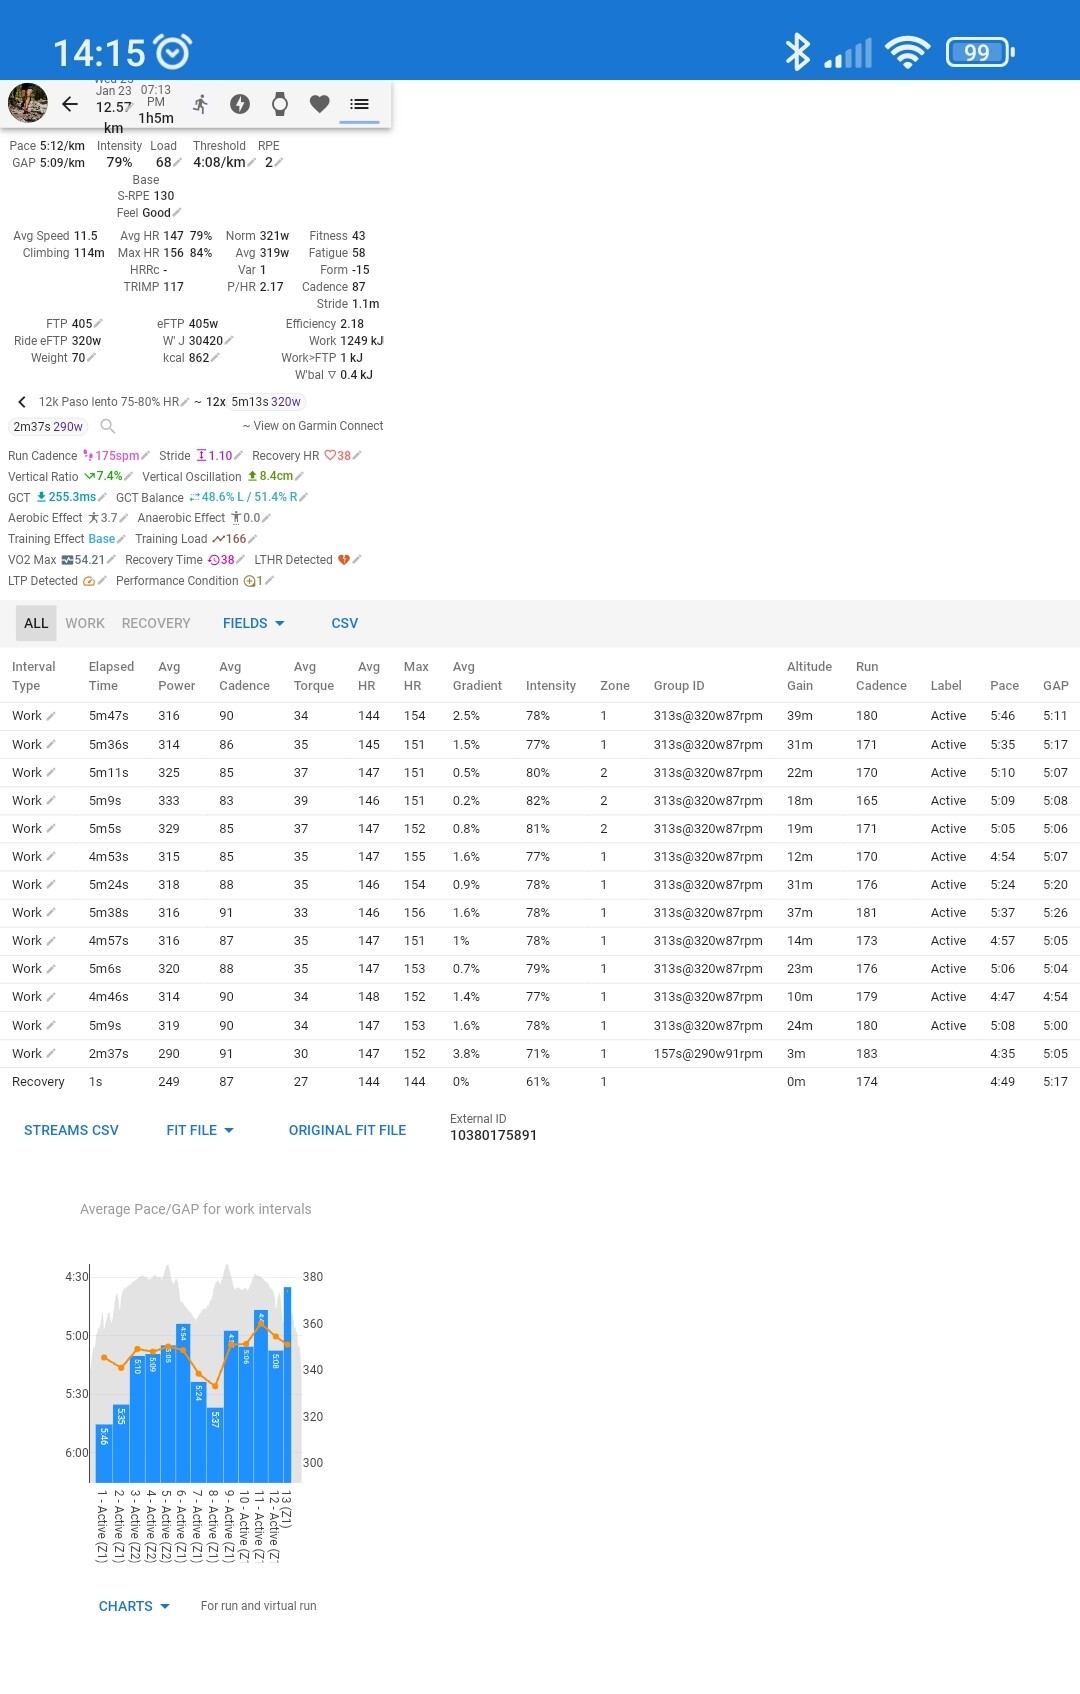
You can break it down by 1 minute using the ‘Power & HR by every 30mins’ chart and changing the top line of the script to be 1 instead of 30
I’ll have a think about how to colour the bars by zone but this might be tricky as everyone’s zones are different in terms of ranges, names and even quantity.
Thanks figure that out and how to change the colours. I assume at the moment the columns just alternate. I’d like to get them to be a colour based on a wattage range or percent of FTP
Thanks, these aren’t actual interviews they are sudo intervals created in the script to break it down by every x mins.
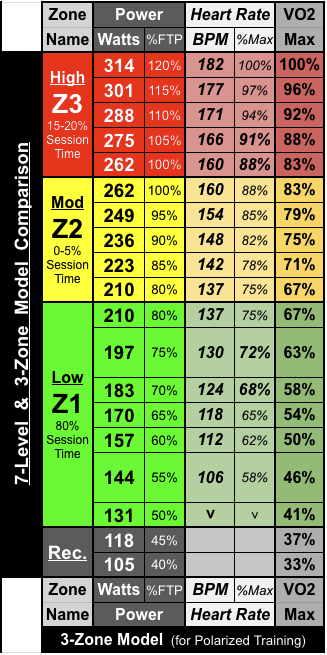
Theres an athlete settings table with zones in so could get them there (presumably, not actually looked yet) but worried how to code it if some people have 4 zones and some have 6 say.
Might just go for the sub 80% of FTP and over FTP for now.
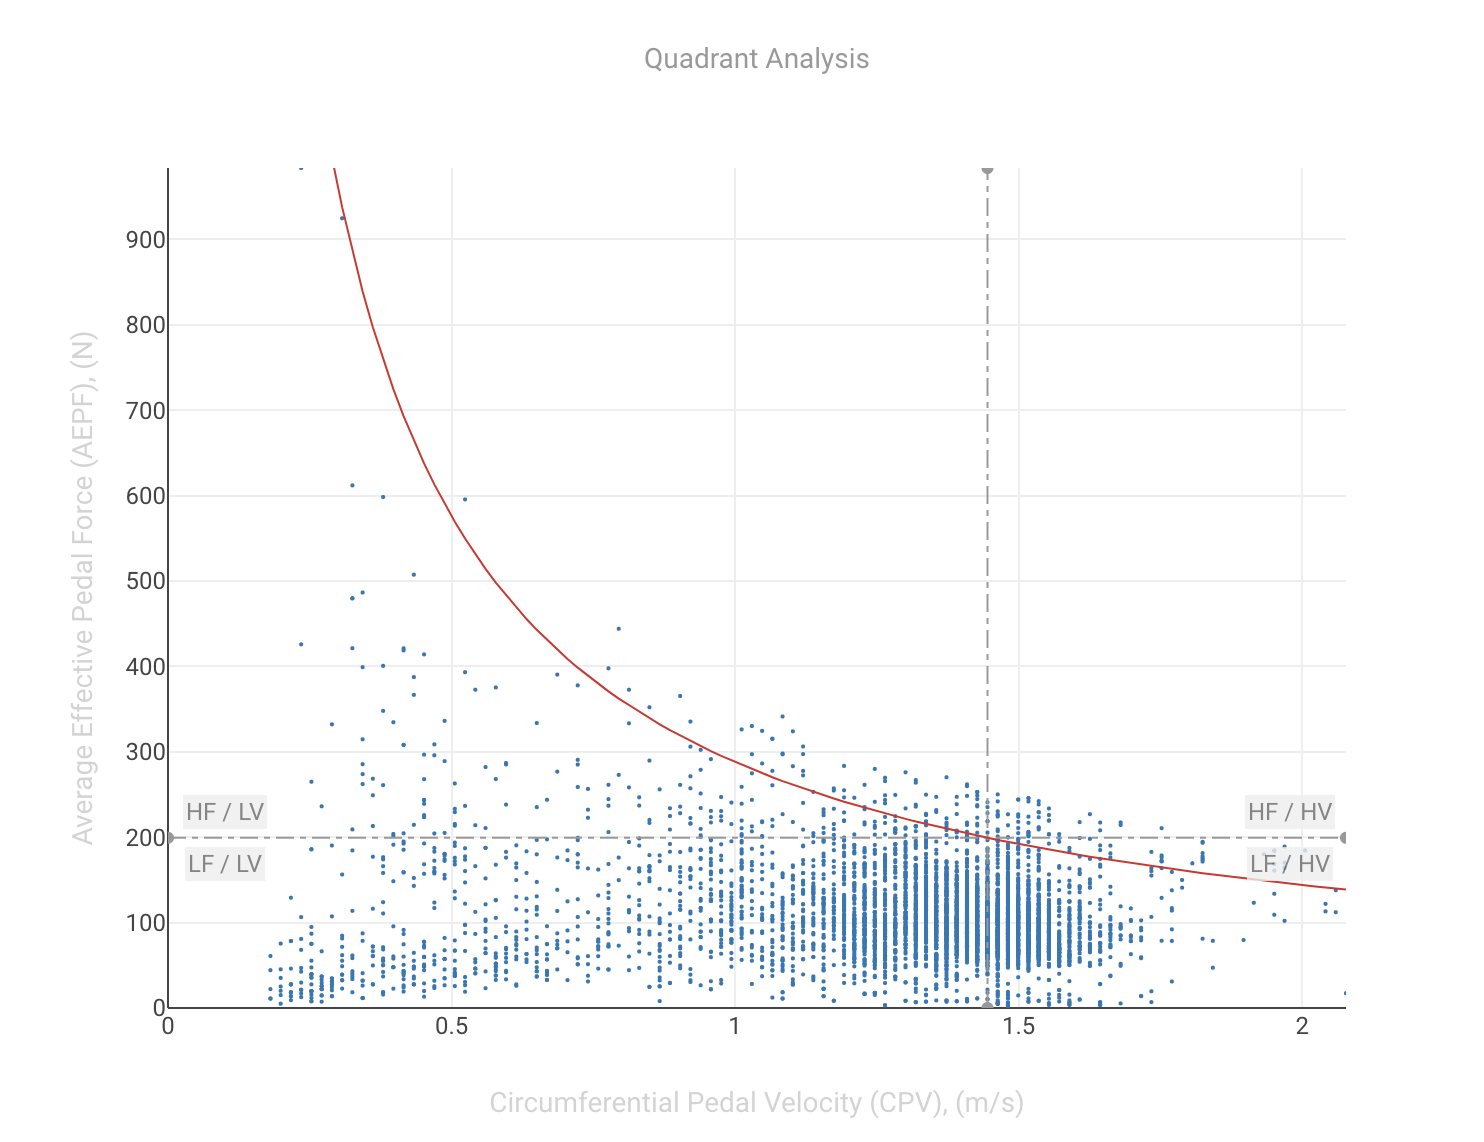
Very nice, @Mike_Schaefer! However, your plot requires crank_length field that my activity lacked. I had to go through the code an put various vars in the plot title to debug.
@david it seems we can’t just console.log with these plots? How can we debug them and maybe declare requirements/show errors?
@Andrii_Magalich I threw this script up on github if you (or anyone else) want to enhance. I made the chart public so i can take enhancements and update source.
Latest update added default crank length of 172.5 if no crank length is in activity, and it adds percentage of data points in each quadrant.
I have added the power, pace and hr curves to the icu object. These are also available to custom activity field scripts.
powerCurve (power duration curve)
powerCurveFatigued0 (power curve after some KJ of work done)
powerCurveFatigued1 (power curve after more KJ of work done)
hrCurve (heart rate duration curve)
paceCurve (distance vs time curve)
gapCurve (distance vs time using gradient adjusted pace)
PDC chart:
{
  let pc = icu.powerCurve

  let trace1 = {
    x: pc.secs,
    y: pc.watts,
    type: 'scatter'
  }

  let data = [trace1]

  let layout = {
    title: {
      text: "Power curve"
    },
    xaxis: {
      type: 'log',
      autorange: true
    }
  }

  chart = {data, layout}
}
Data model:
JsHRCurve
A heart rate duration curve.
secs int[] ~ Time points. Note that not all seconds are included. The curve gets sparse as time goes out.
bpm int[] ~ HR for corresponding entry in secs.
start_index int[] ~ Where corresponding point starts in the activity
end_index int[] ~ Where corresponding point ends in the activity (exclusive)
indexOf(int seconds) int ~ What is the index of the point on the curve that has a duration of at least seconds? Returns -1 if the curve
is not that long.
getBpm(int seconds) Integer
JsPaceCurve
A pace duration curve.
isGap boolean ~ Is this gradient adjusted pace?
distance float[] ~ Distance points. Note that not all distances are included. The curve gets sparse as time goes out.
secs int[] ~ Time to cover the matching distance.
start_index int[] ~ Where corresponding point starts in the activity
end_index int[] ~ Where corresponding point ends in the activity (exclusive)
indexOf(float distance) int ~ What is the index of the point on the curve that has a distance of at least distance? Returns -1 if the curve
is not that long.
getSpeed(float distance) Float ~ Returns speed in meters/second or null if curve not that long. Note that the distance might be more than the
distance parameter.
JsPowerCurve
A power duration curve.
secs int[] ~ Time points. Note that not all seconds are included. The curve gets sparse as time goes out.
watts int[] ~ Power for corresponding entry in secs.
watts_per_kg float[] ~ Power/weight for corresponding entry in secs.
start_index int[] ~ Where corresponding point starts in the activity
end_index int[] ~ Where corresponding point ends in the activity (exclusive)
after_kj int ~ If the curve is fatigued then this is the amount of work done before the curve.
indexOf(int seconds) int ~ What is the index of the point on the curve that has a duration of at least seconds? Returns -1 if the curve
is not that long.
 Wasn’ there last time I looked.
 ).
).