Would you consider adding skin and core body temperature graphs and related metrics to the site? I believe the fit file relating to this activity should have examples of these fields: Intervals.icu
Thanks
Would you consider adding skin and core body temperature graphs and related metrics to the site? I believe the fit file relating to this activity should have examples of these fields: Intervals.icu
Thanks
I will have a look. Tx for the link.
+1
All my recent activities have the Skin and Core body temperatures.
Thanks!
Me too, using the core body temp sensor from greenTEG.
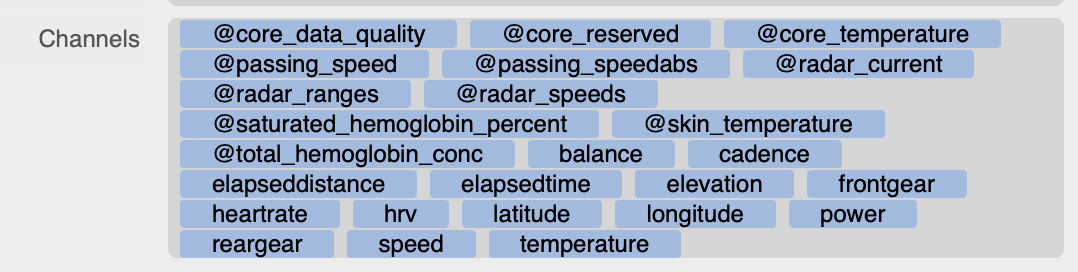
Using @core_ channels from my Garmin and @hemoglobin channels with my Wahoo head unit
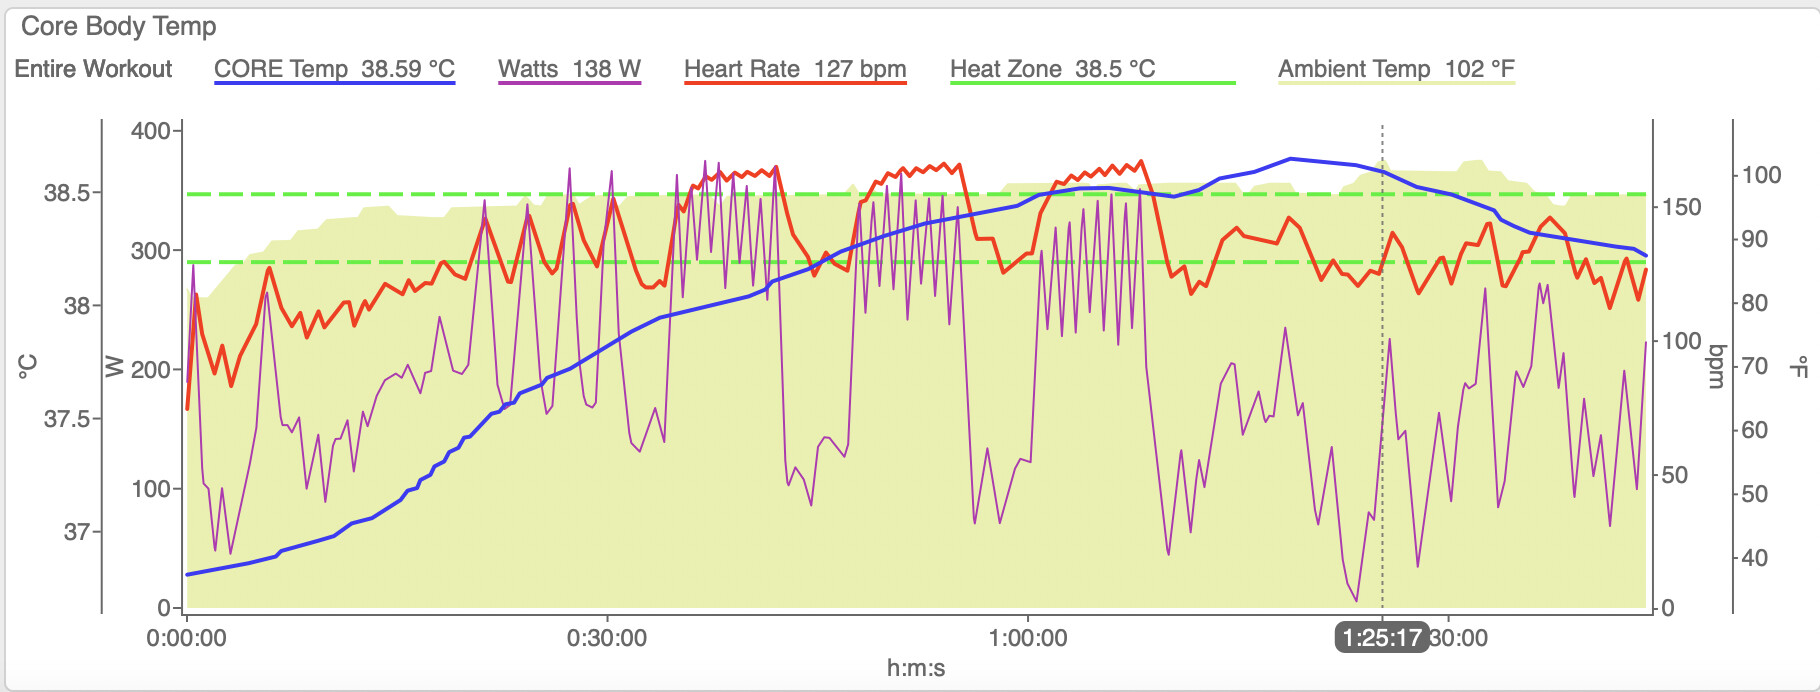
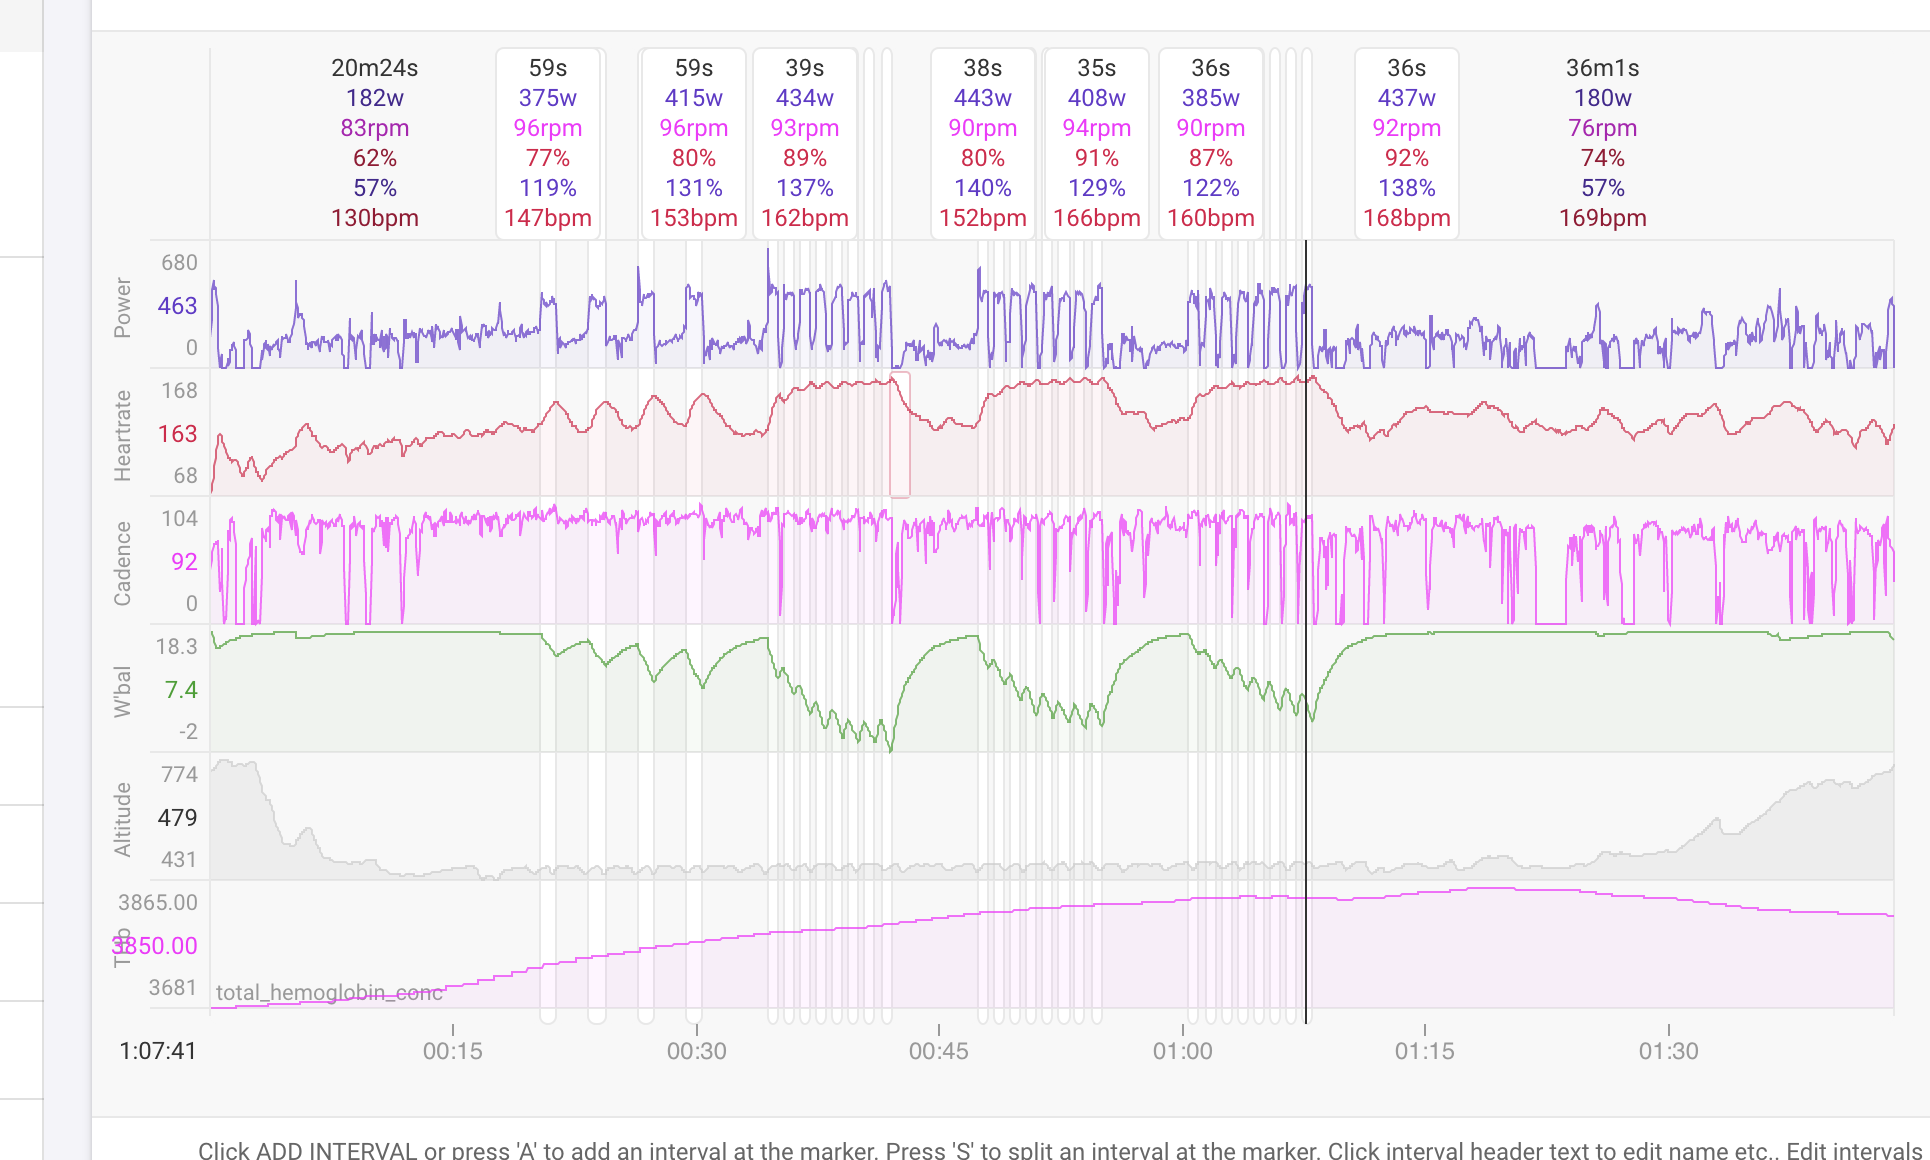
Oh, I just found you already have @total_hemoglobin_conc which a field that CORE Body Temp is pirating for non-Garmin head units. You just need to mentally push the decimal two places to the left, e.g. 3850.00 percent shown in image below is actually 38.50°C.
I only just came across intervals.icu by the recommendation of another local cyclist and I am blown away by how much you have to offer. I just added my dollars to the support bucket. Thank you so much!
I recently started using the CORE body temperature monitor and I see that you now have support for it in your charts, which I added to my display. However, it would be very helpful to be able to see more digits in the overlay when scrolling, e.g. I can see “99.8º” but when the temp goes over 100º, I cannot see 100.1º or 100.2º, just 100º, 101º, etc. To be able to see (for example) 99.89º and 100.67º would be most helpful, but even if I could just see 99.9º and 100.7º, that would be awesome. Thank you so much!
Thanks. It’s fixed now. Tx for the report!
G’Day David - wondered if there was any way of making a chart for the core temperature metric that displays time accumulated at or above a specified temperature (similar to the HR chart that already exists).
Would be useful to assess heat acclimatization protocols that depend on time above certain core temperature thresholds.
Great product by the way - love your work!
Tx. Hmm I need to try figure out a general way to do that sort of thing and where to put the chart. It doesn’t fit on the HR or power pages.
@david @DaveQB I have a core body temperature and I have activated the TBh graph in charts but no data is visualized. Weirdly the same data its displayed just fine in Training peaks. What am I doing wrong?
I am using a wahoo Bolt v2 GPS and my intervals ICU data is taken from strava.
Unfortunately Strava doesn’t pass on any extra things like that, only the basic power etc… If you manually upload a fit file it should work. You can also use Dropbox to get files into Intervals.icu.
Is there any guide on how to do that? Do you have a link?
Thanks anyway for the clarification
I am going to do direct Wahoo download soon I hope.
There is this post:
I am not looking to download from Intervals ICU to wahoo, since all my trainers in the past and current one seem to use TP, but to upload my data to it since in my honest opinion, intervals ICU offers a much better analysis than TP.
Sadly for me the Strava route won’t work as it’s parsing my Core data. So I will try to set up a Dropbox folder next.
I’ll let you know how it goes but let me know if there is a guide for that.
Thanks so much for all the help! You guys are amazing
@david Is it possible to add the Core Temperature as a parameter to use in the custom charts in the Comparison or the Fitness tab?
I can only use it in custom charts on an ‘activity’ level. I’ve just started using the Core sensor and I want to be able to plot max core temp / average core temp / avg power / avg HR / Max HR … to see some trends / adaptations in the data when doing a dedicated heat prep block.
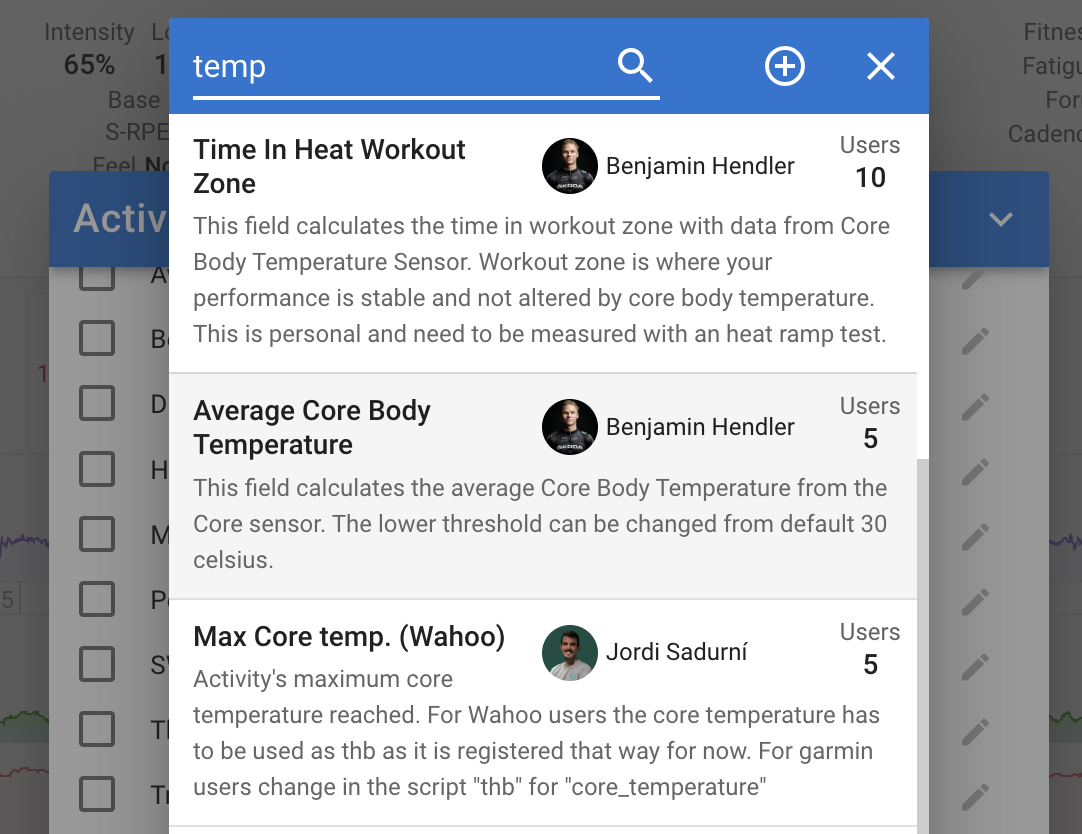
You can do this using custom activity fields. I see that people have added quite a few using Core Temp data. Click “Custom” under the activity timeline chart and then search:
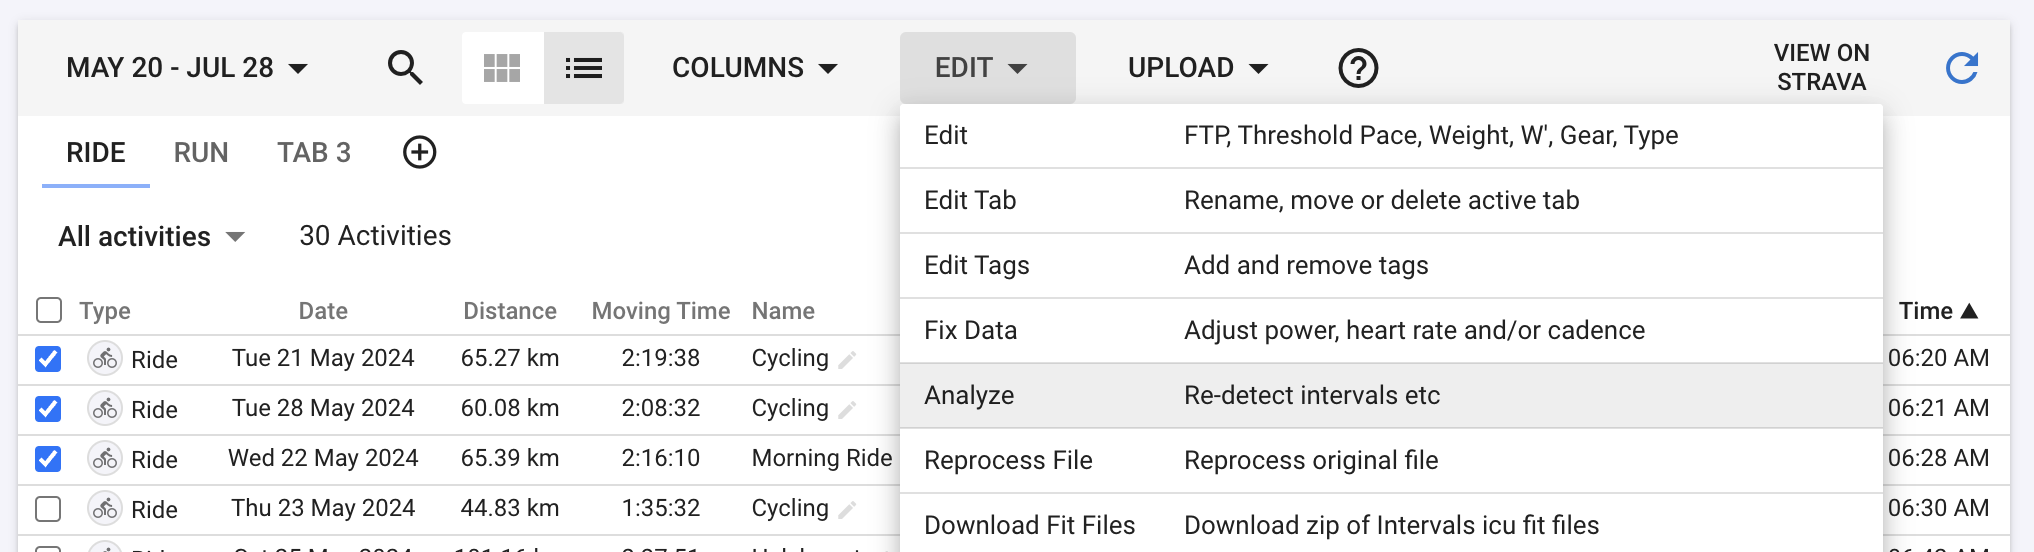
Once you have the data you want in a custom activity field you can plot it on the fitness and compare pages. You need to re-analyse existing activities to compute new custom activity fields. Do this in bulk using the activity list view:
It worked, thanks!
I wasn’t aware yet of the difference between the ‘Interval fields’ and the ‘Activity fields’ and the way they interact with the other tab sheets… I should go through to the entire forum to find other secret gems like these… !
Great to have that one sorted, will be useful in the future!