Is it also possible to compare data of the current week or month with the previous one?
I would like to see how much more or less I ran compared to the previous period.
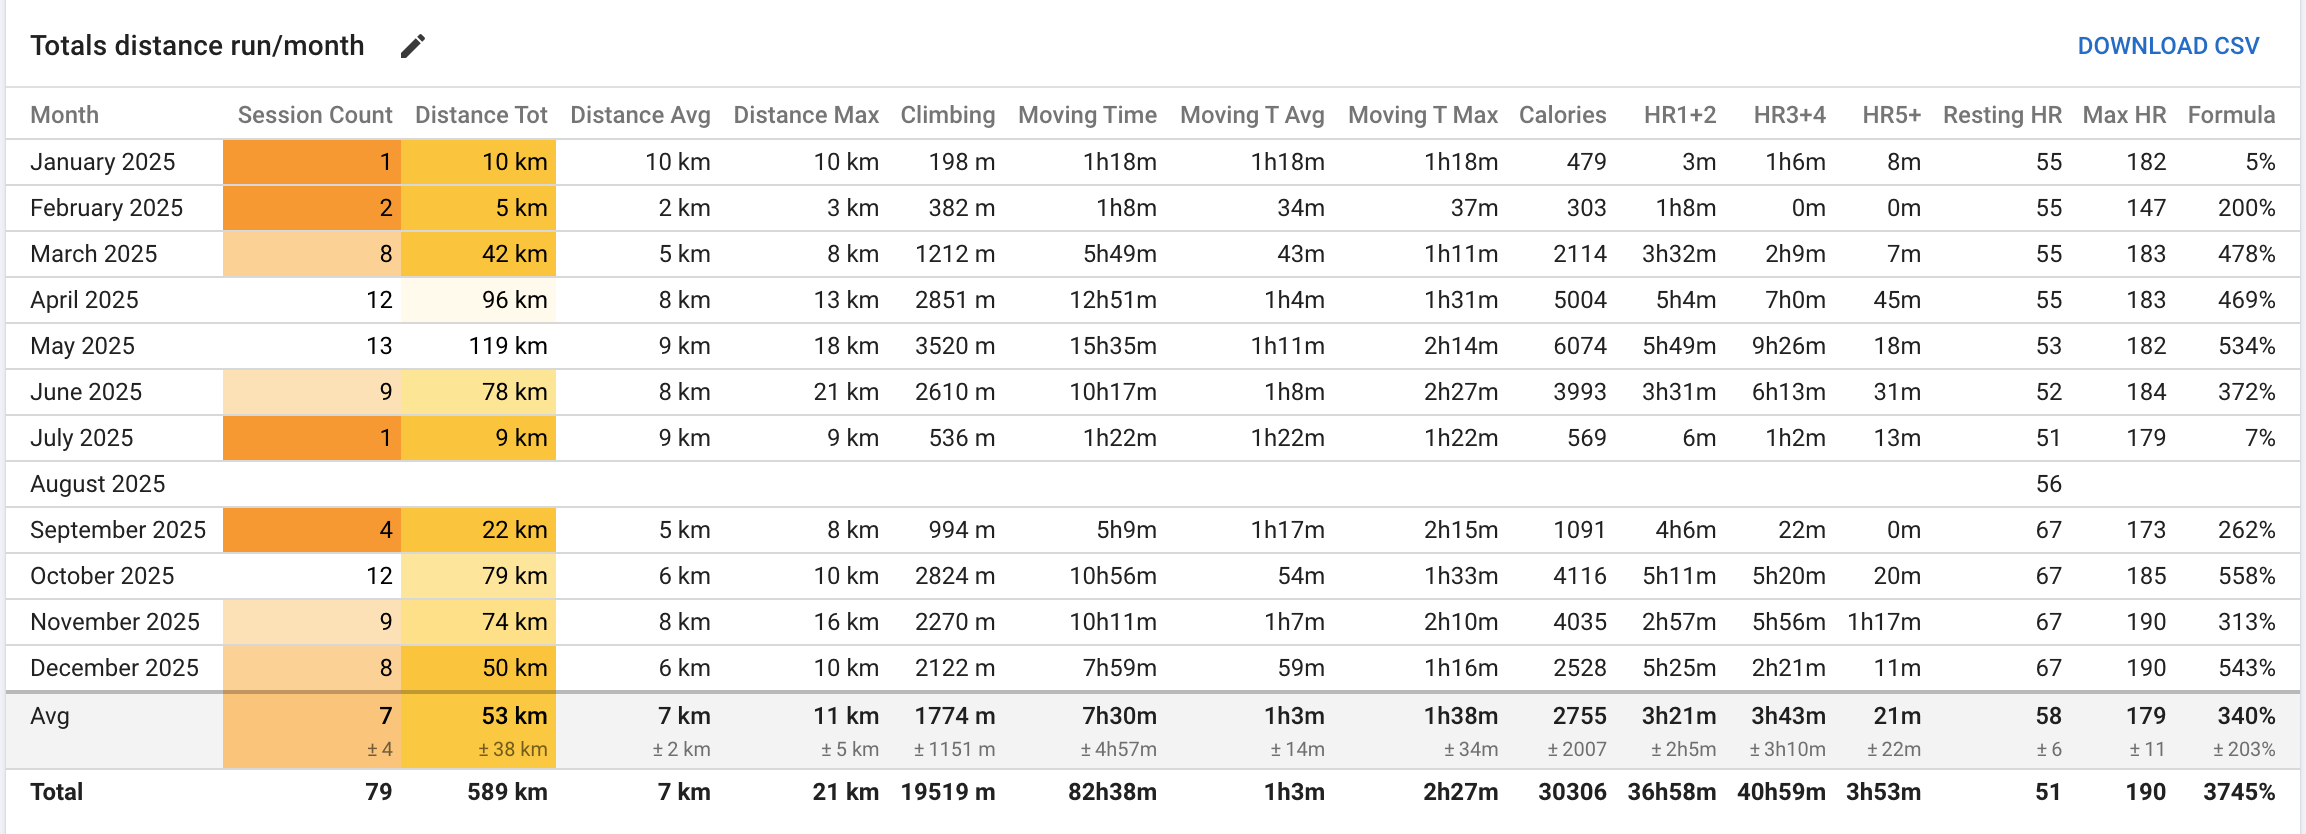
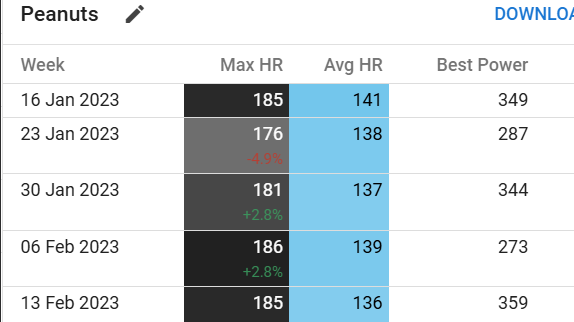
Runalyze has this feature where you can see how much your mileage increased from week to week (see the percentage behind the total distance):
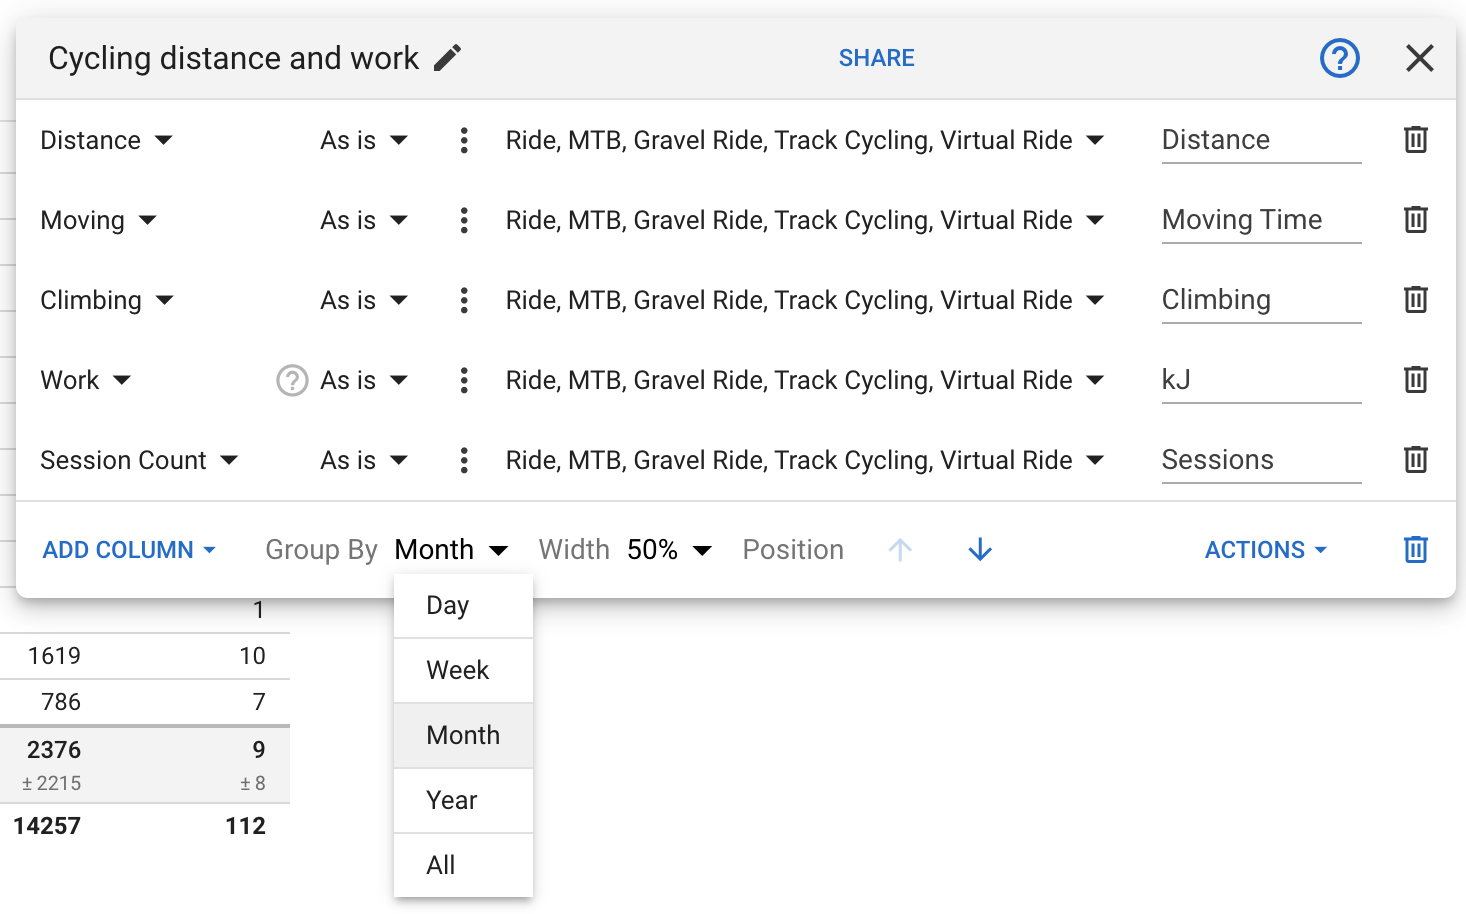
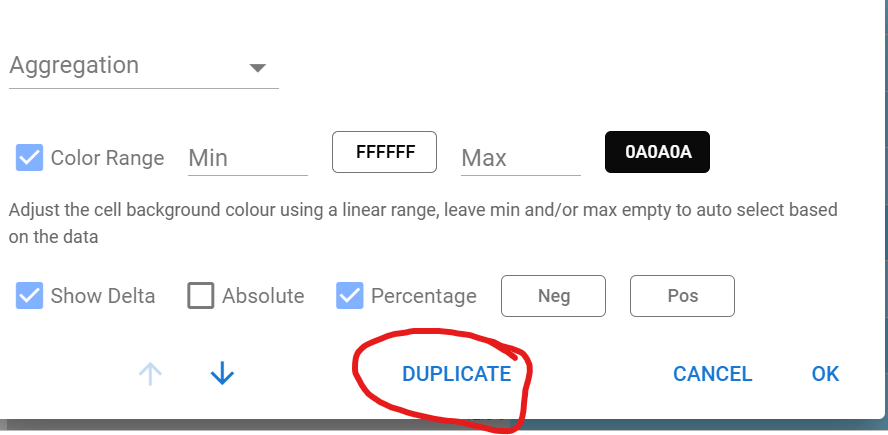
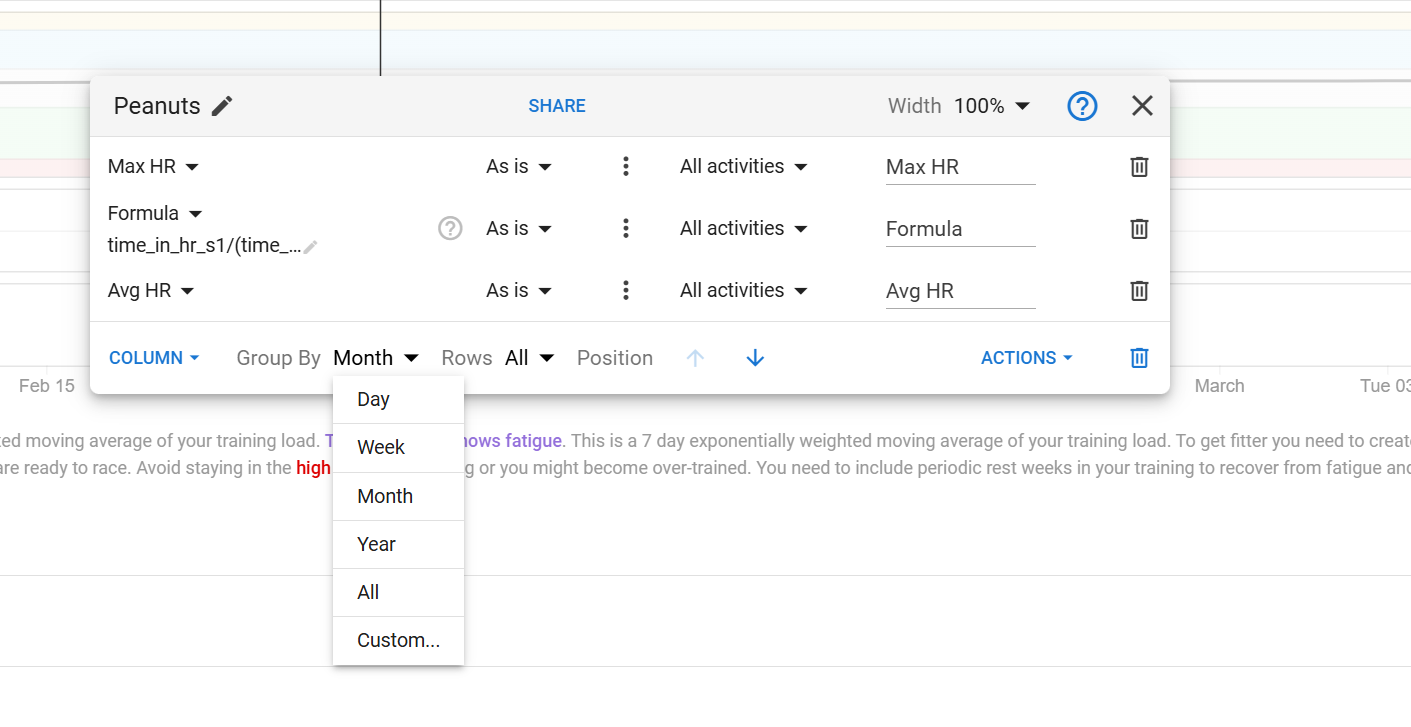
Great to see you can duplicate the table and can choose between day/week/month/year and all.
One question, when using the new formula option, does the formula only work on the raw (day) data or can it also work and the agragated (week/month/year/all) data in the table?
For at the moment it when I try to calculate if my weekly/monthly intensity distribution is near the 80-20 guidelines, the math goes wrong.
At the moment its: daily data >> formula >> aggregation >> totals table.
And I would also like the option: daily data >> aggregation >> formula >> totals table.
I hope this makes sence.
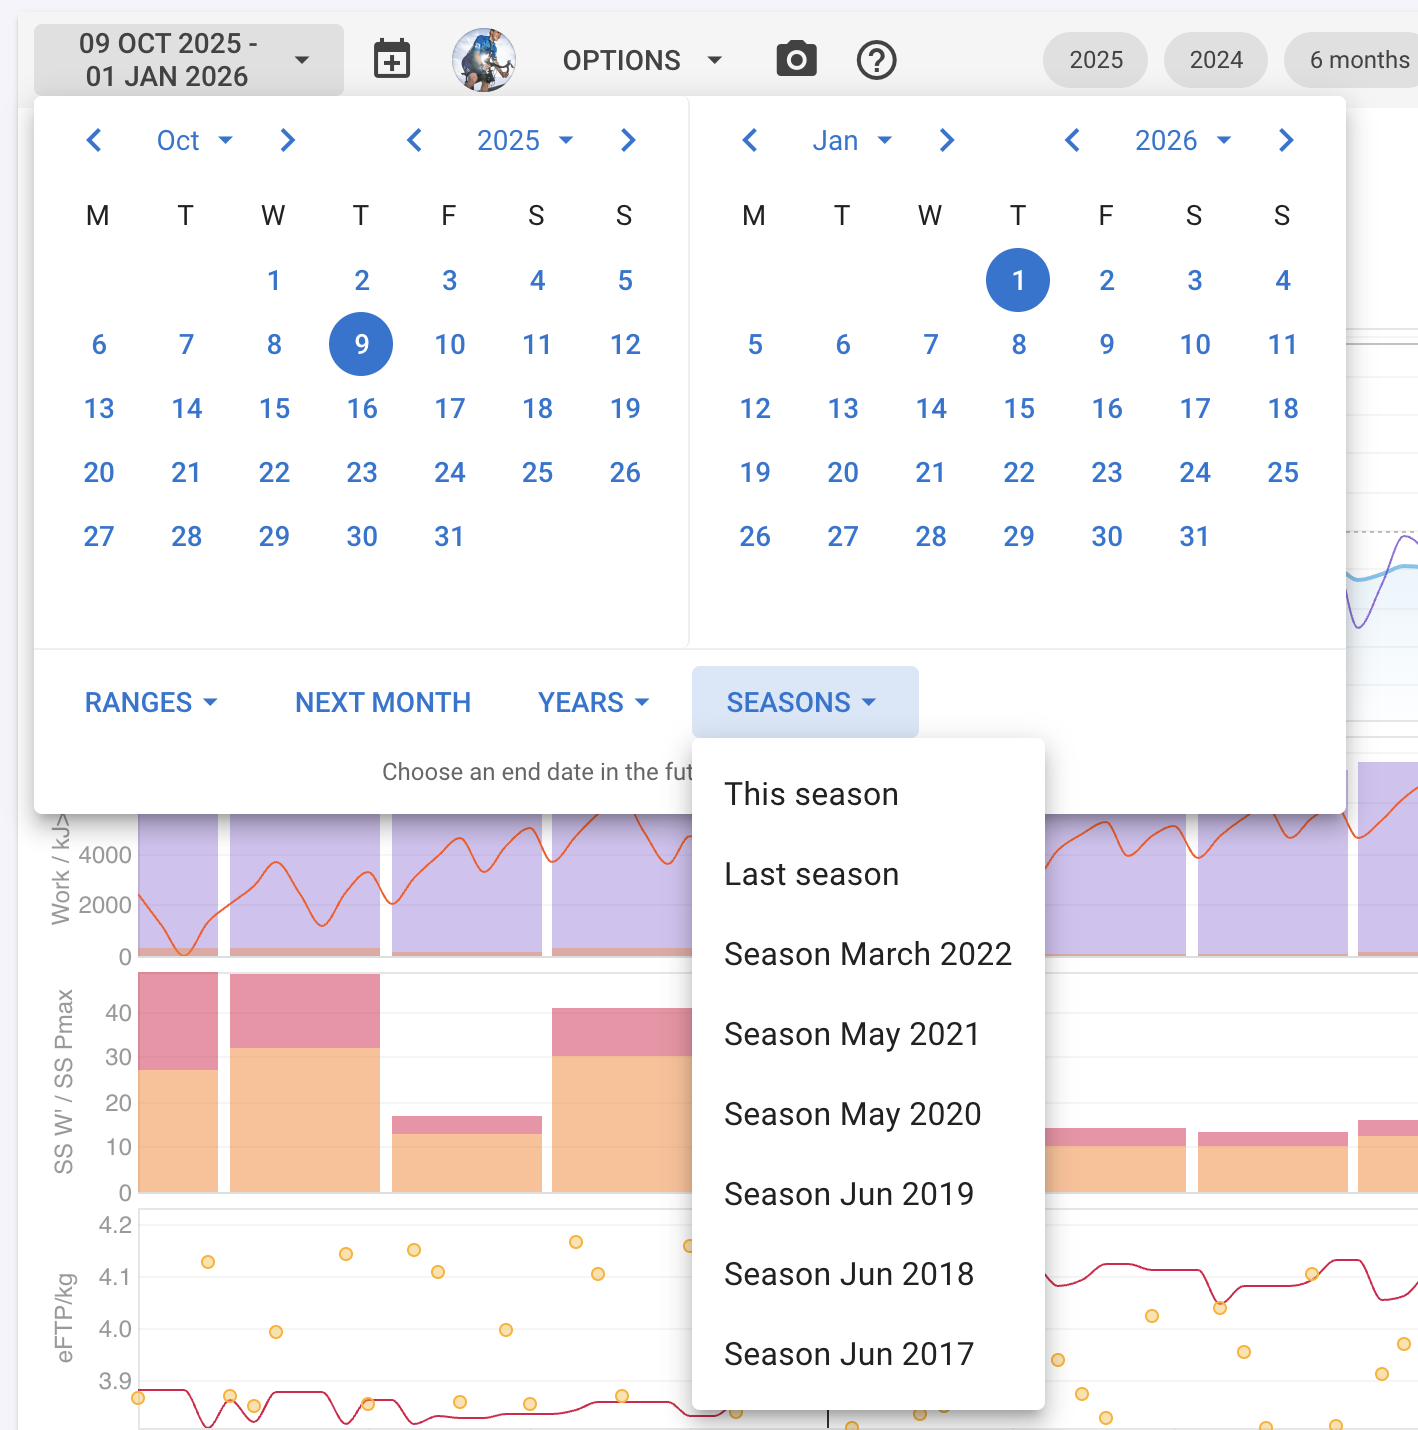
Is there any chance this can be based on season rather than calendar year? Tri season in the southern hemisphere is very much mid season at start of calendar year, so the point it resets isn’t ideal. Maybe similar for cyclists, and northern hemisphere winter sports.
Would it be possible to add date ranges within the tables themselves? For example I would like to have a table for a weekly breakdown and also one for a monthly breakdown but I’d like the weekly table to show, say, the last 12 weeks and the monthly breakdown to show the last 12 months.
We did experiment with this approach and it doesn’t work for formulas that use data from the previous iterations e.g. when computing an exponentially weighted moving average. Or any non-linear formula e.g. x * x.
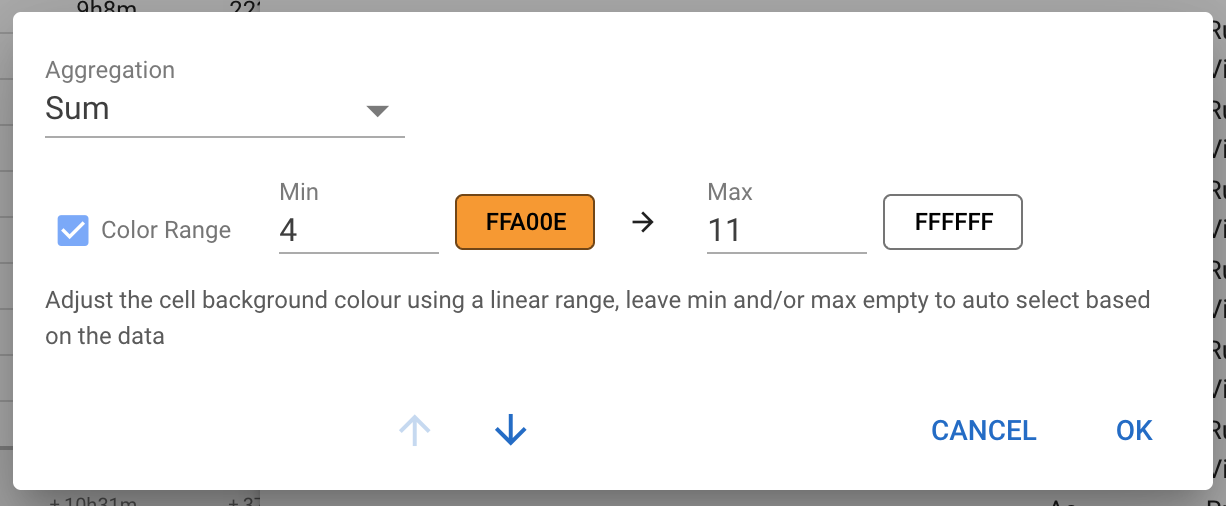
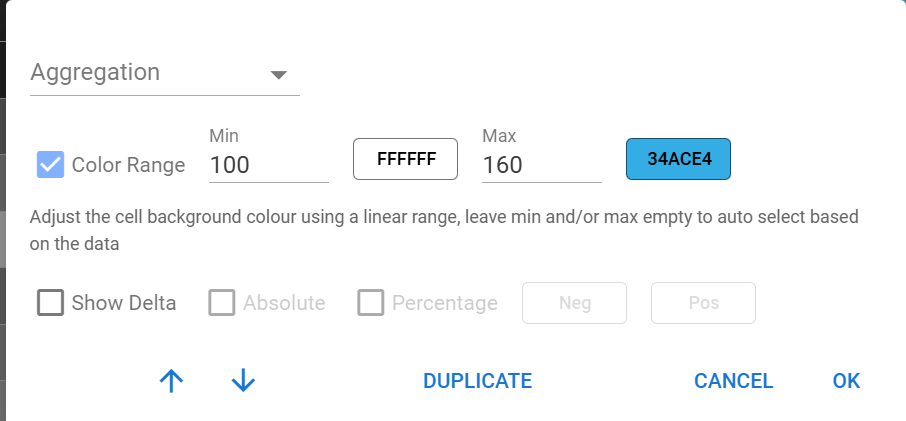
What you can do is set the aggregate function for the plot. Click the dot dot dot menu for the plot and choose average:
This will average the daily values to compute the totals for week/month etc.. This does weight each day evenly which is not the same as totalling up the input values for the week and then computing the formula. But I think it works well enough for your use-case.
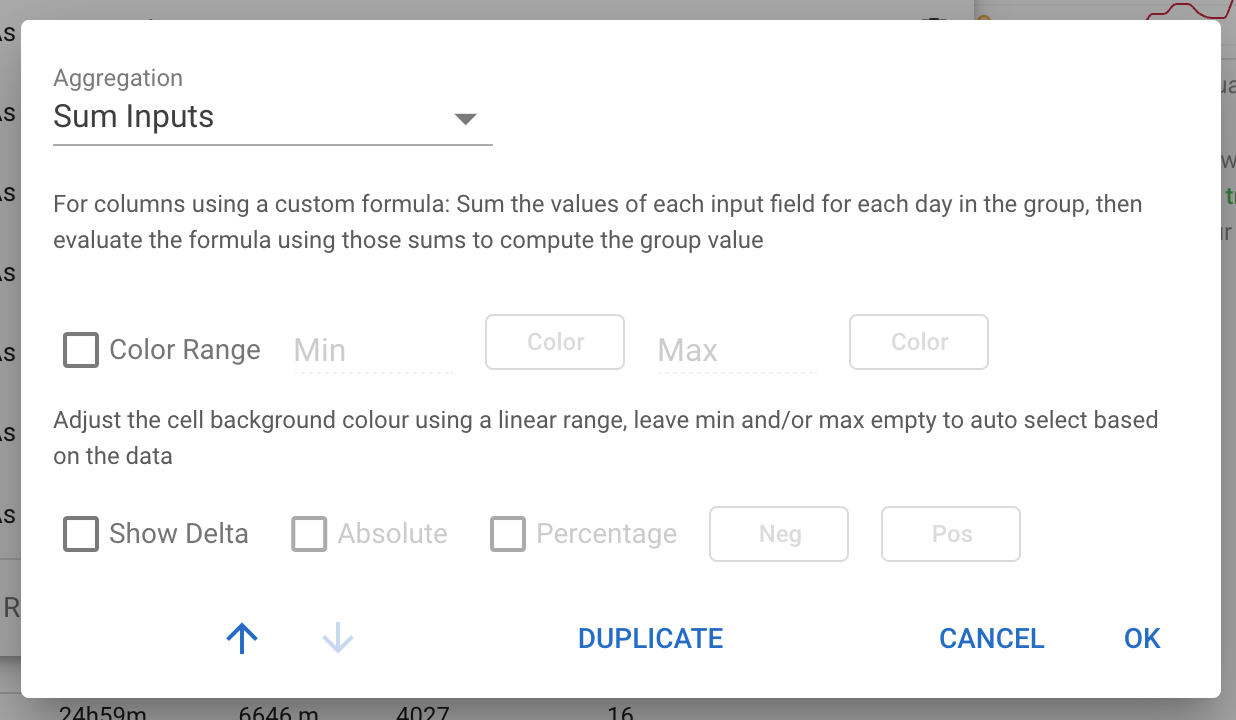
We could possibly add an aggregate option to total all the inputs and then compute the formula (“Sum Inputs”).
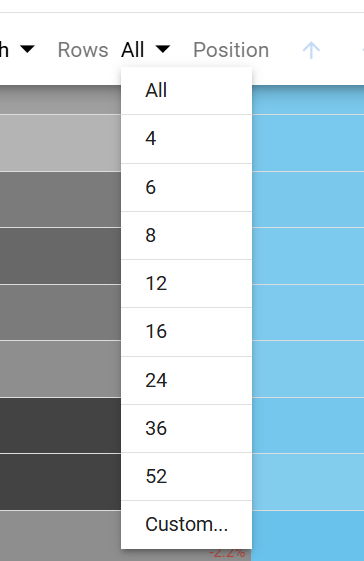
We will likely add a “max rows” option to only display the n most recent days/weeks/months etc..
That kind of works indeed, but I like the idea of “Sum Inputs” even more.
So once again you see, that a simple question is not always that simple
Thanks for testing/experimenting and building the Totals Table it’s a great addition to a already great site.
I’ve noticed sessions planned for today, are added to the total sessions before they are done, but not elsewhere, which is good. It just makes my OCD tingle when total distance / session != average, made worse by me having all those fields present.
Please don’t take this a a critisism, I love the totals table, and hope/expect it’ll replace some Excel stuffing around.
@ryandev , I don’t see the total’s table dropdown in options in Totals page, is this coming soon, or do I need to do something?
Hi @Stu_Fyfe , glad you are enjoying the table. It should be visible at the top of the options dropdown. Please check if you are on the latest version of the website by going to settings and scrolling to the bottom then clicking check for updates.
Cool!
bug: duplicate table and adding a shared table in the totals page don’t work
Also when moving a column with the dot-dot-dot menu and arrow, every time I click on the up/down arrow the window will close, so if I want to move a newly added column like 5 times I have to enter the dot-dot-dot menu 5 times
Can we somehow move up the totals table (on the totals page). Currently I have a lot of Custom Zones, and I have to scroll down to see the totals table. Would like to see it on the top of these zones.
This is awesome, such a great place to look at aggregate data to compare periods. Is there any way to select the number of days instead of just day, week, month? I would like to look at the data in 9 day blocks as that is how I write my plans for some athelets. Others might like a 10 day or 14 day cycle.