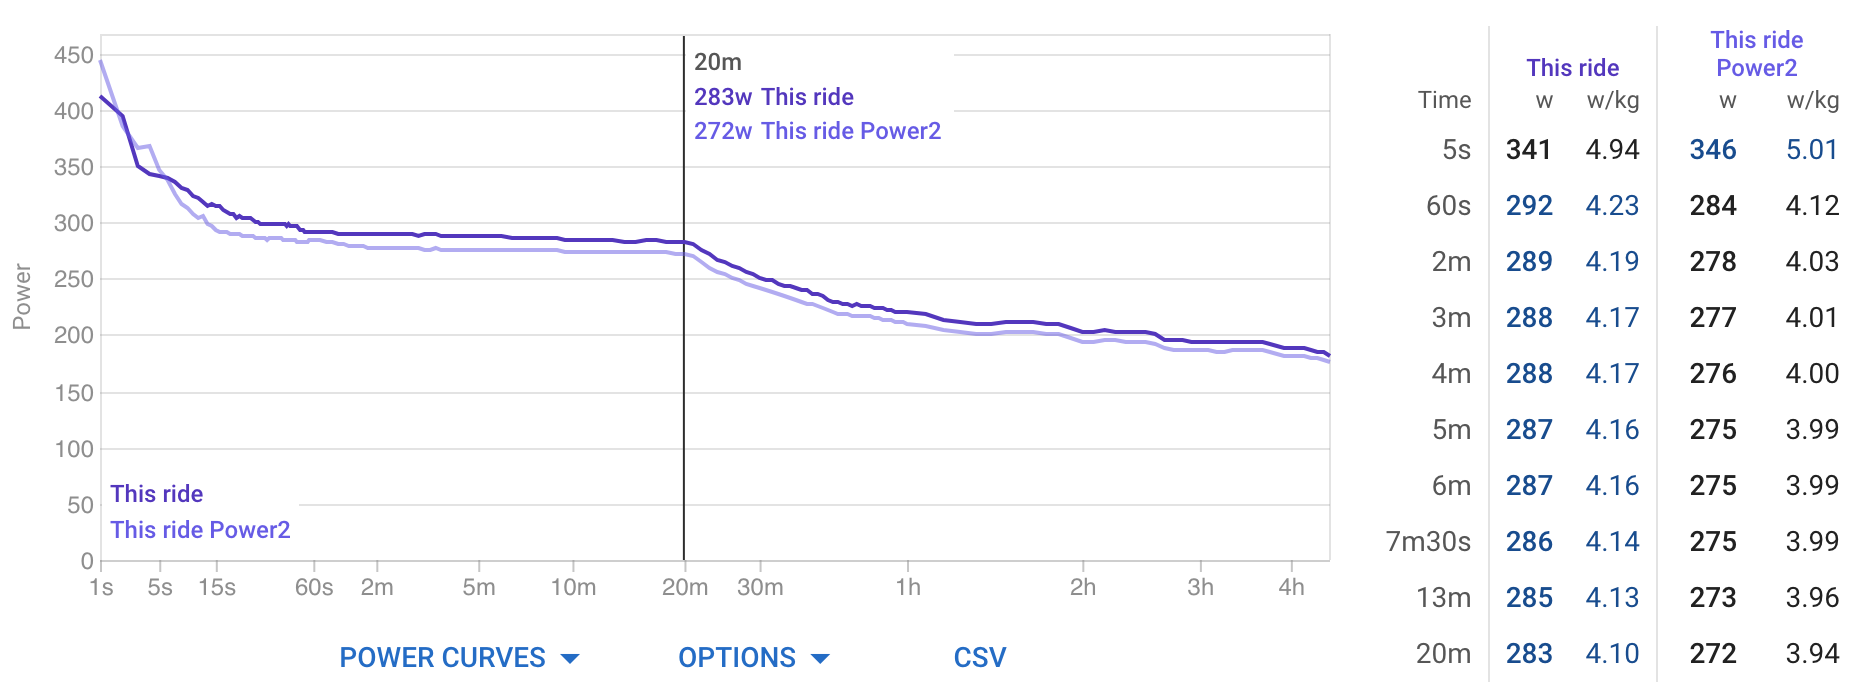
You can now compare activity power curves on the activity power page. In this example I am comparing normal vs fatigued curves for the activity and for the last 42 days:
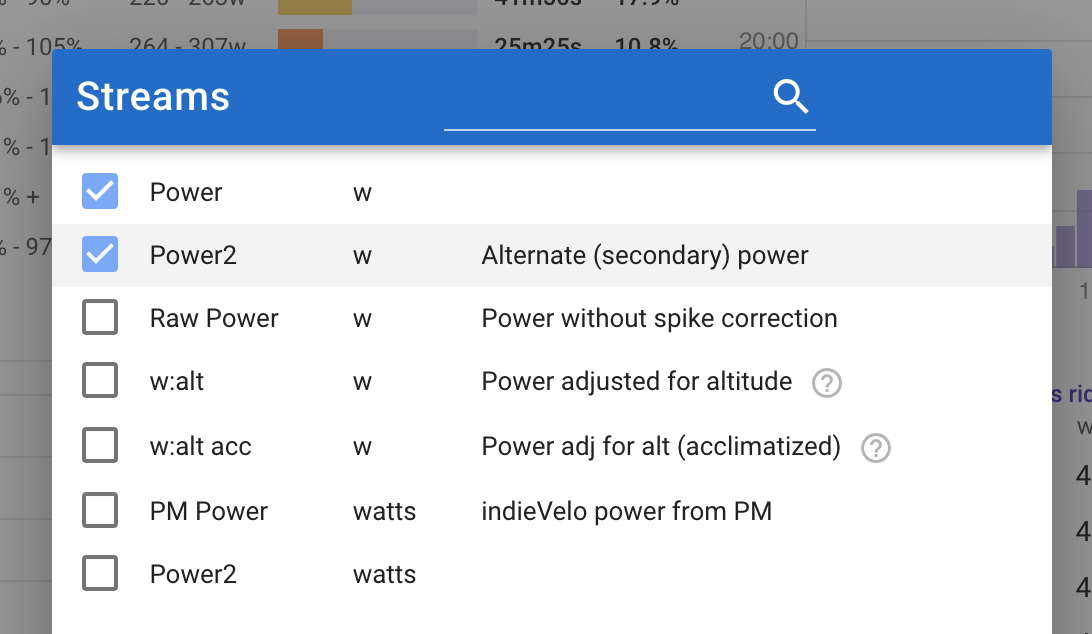
If the activity has more than one power stream then “Power” is the one selected (Actions → Settings under the activity timeline chart) and the other is “Power2” (e.g. power from your trainer).
My dual Favero Assioma pedals read quite a bit higher than the left arm only Stages PM (“Power2”) that came on my bike, probably because my left leg is weaker than my right. I previously compared the FA’s to my Power Tap hub and they were within a watt or two of each other.