As is said many times on this forum a huge thanks to @david for creating such an amazing tool! It’s fantastic!
I have been enjoying some of the WKO5 education series on YouTube to increase my knowledge of cycling data points and analytics.
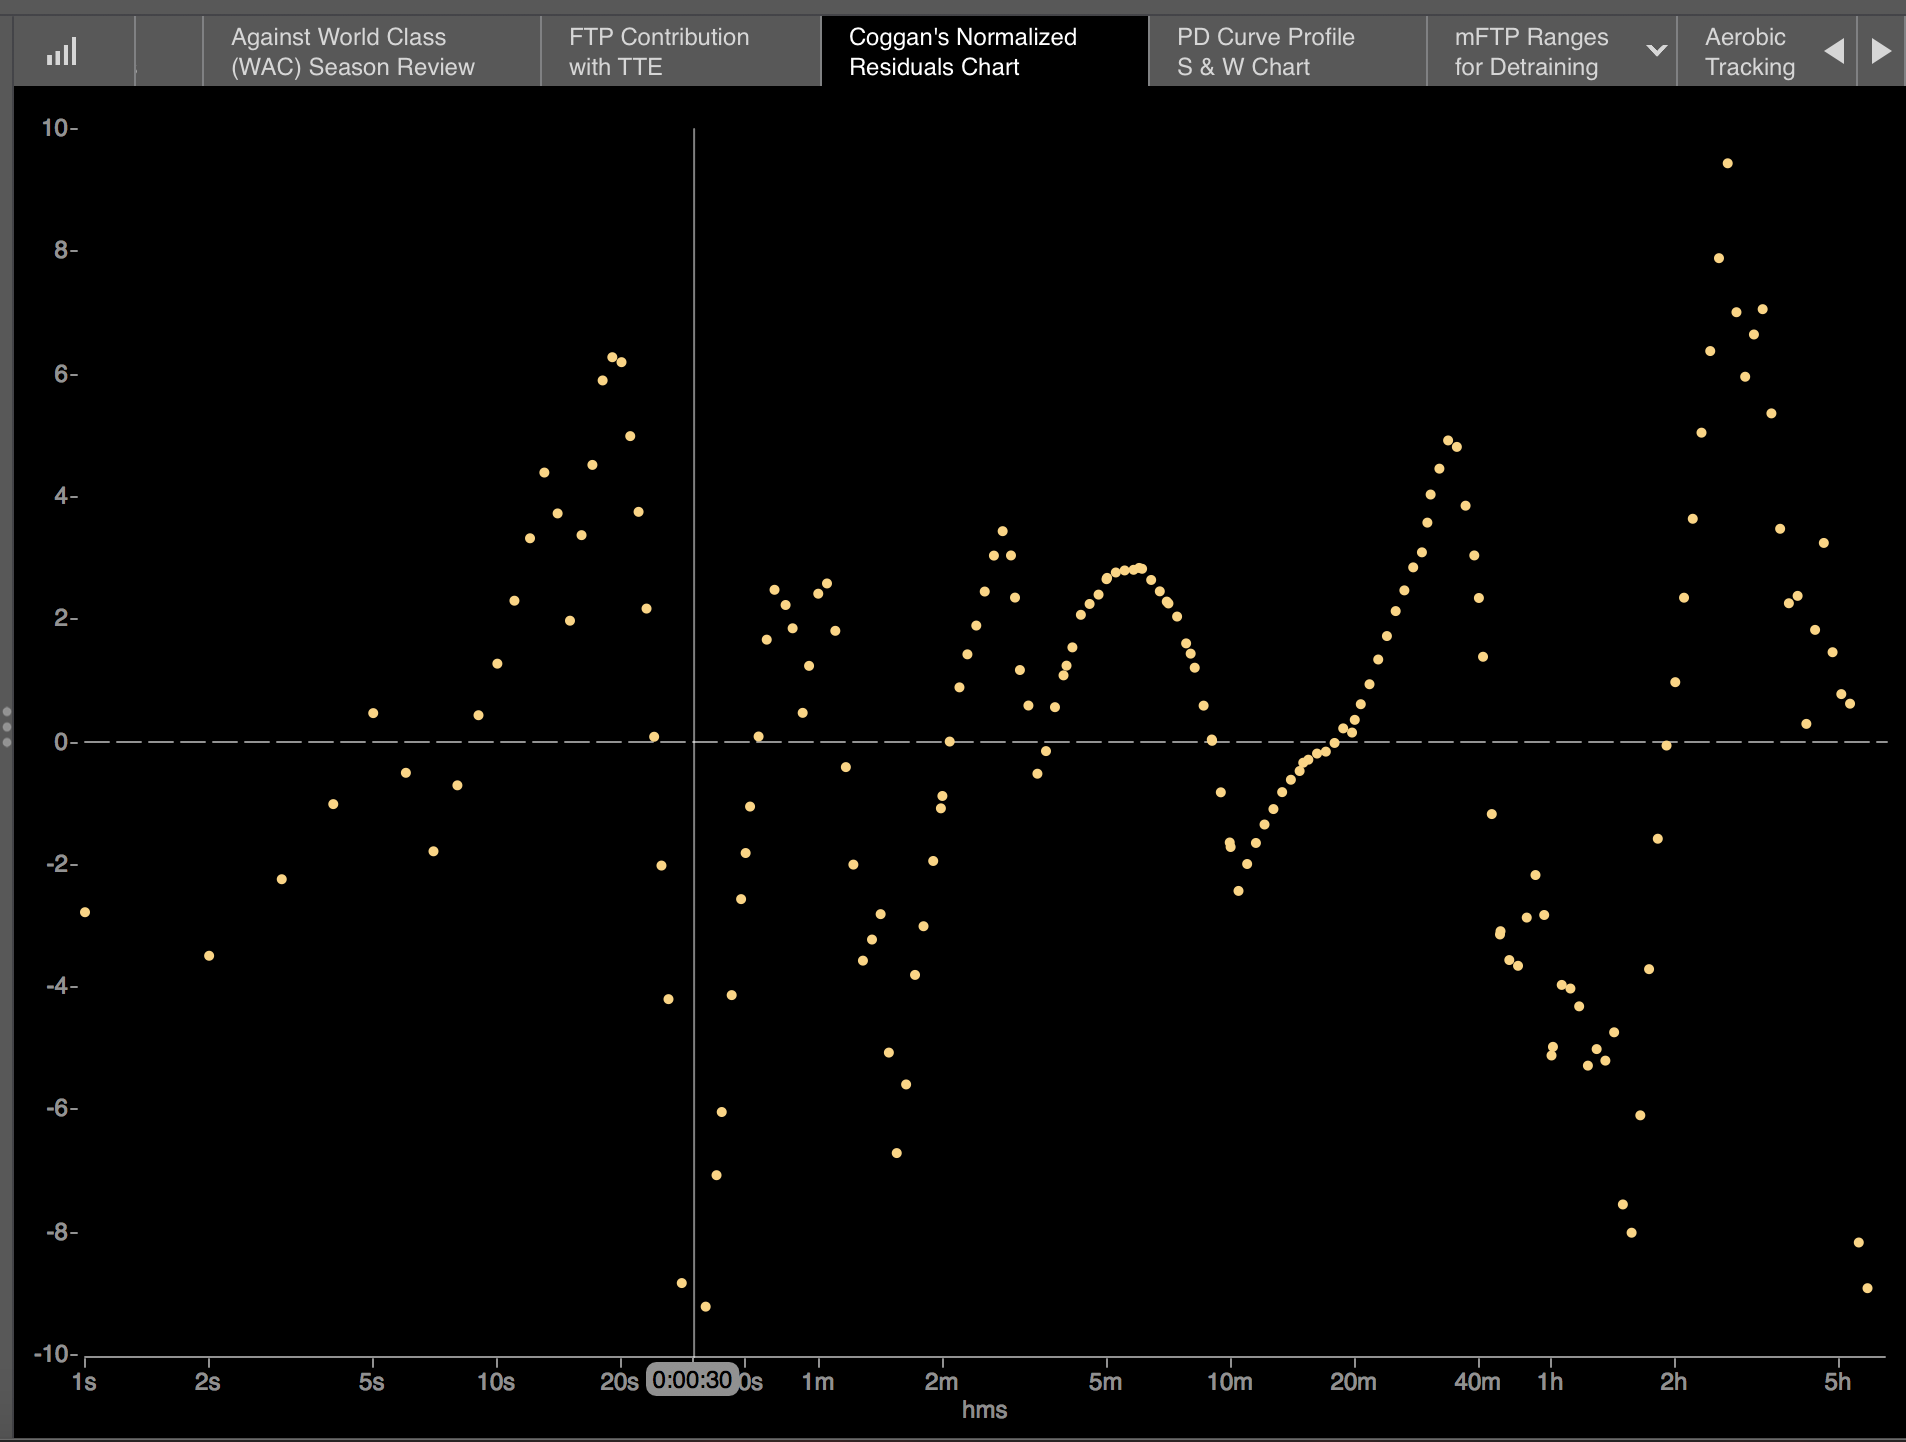
One graph they have is the Normalized Residuals graph that allows you to see areas you should test to develop your Power Duration Cure.
I know we have the latter Intervals and it is a great help but I wondered if there was anyway to replicate the Normalized Residuals graph or use other existing Intervals graphs for the same purpose?
I have to say I never really saw the point of that graph. All it’s really telling you is where the model is above your power duration curve and where it is below. You can do that visually.
All of the models used on Intervals.icu try to skim over the top of the power data, picking up maximal efforts. What that means is that they aren’t actually affected by sub maximal efforts efforts pulling them down, unlike the WKO model which tries to fit the curve to all of the data with equal weighting.
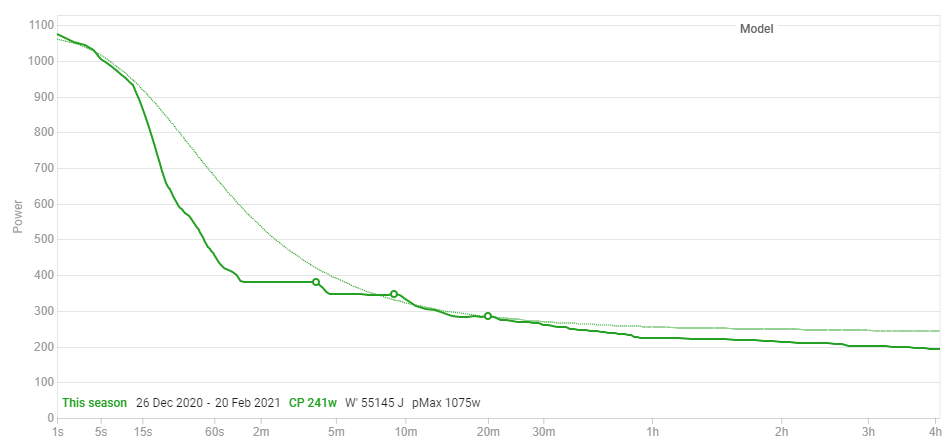
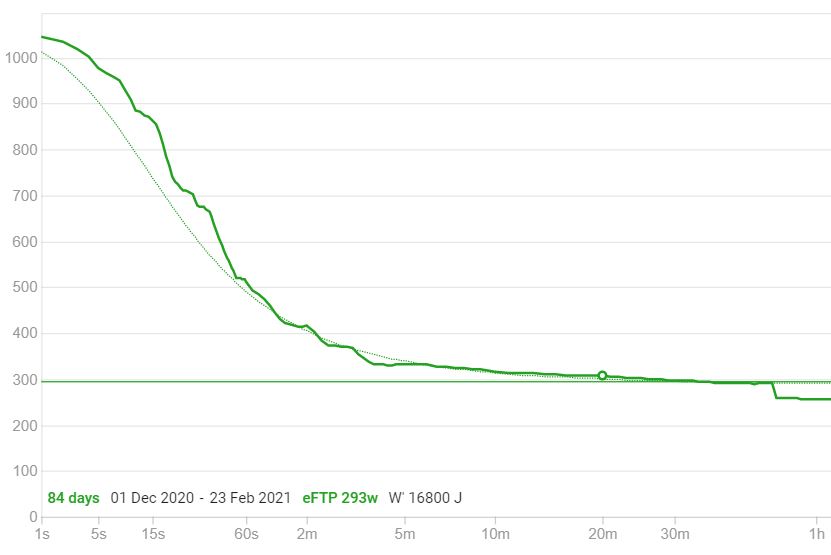
Here’s my power MMP curve with Morton’s 3 parameter model. It’s not a very good fit as I don’t have maximal efforts at longer durations.
I actually hit the Reply button before I had completed my post, so here are some other thoughts:
Because the models fit to maximal efforts there is no need to target certain areas of the MMP curve to make the data better, which is in effect, what the WKO chart is trying to do. The curve fitting model is naturally pulled down by sub maximal data. The problem here is that the model is, in effect, saying that any points above the line are impossible. Obviously that can’t be true - you just went out and smashed your 8 minute power PR (or whatever) but the model can’t actually represent that effort without every other point being maximal.
You’re never going to achieve that in reality.
What I would like to see is for @david to implement the Peronnet and Thibault model on which WKO is based, perhaps with a slightly different curve fitting to better represent maximal efforts.
@Mike_Lauder thank you very much for your insight and thoughts - as I am trying to build my knowledge of cycling analytics that really helped.it helped my understanding.
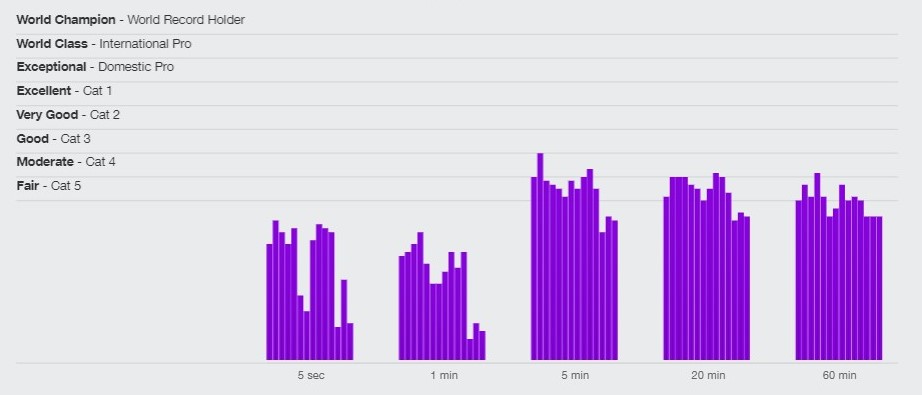
I guess I can just use the power curve as you have shown, to see where there might be opportunities to either test or review if they are strengths, weaknesses or limiters (to use WKO5 language again…). Am I correct in thinking that I could also use the Power Profile chart in Intervals to do this in some capacity?
I appreciate I might be confusing concepts or ways of understanding the data but its all helping me develop my understanding so thanks for your thoughts!
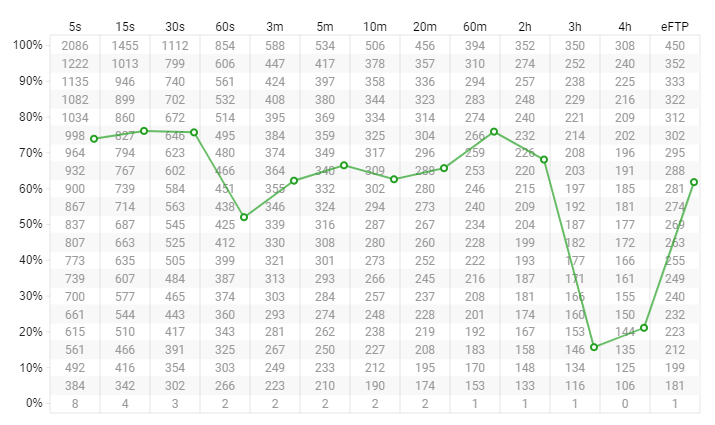
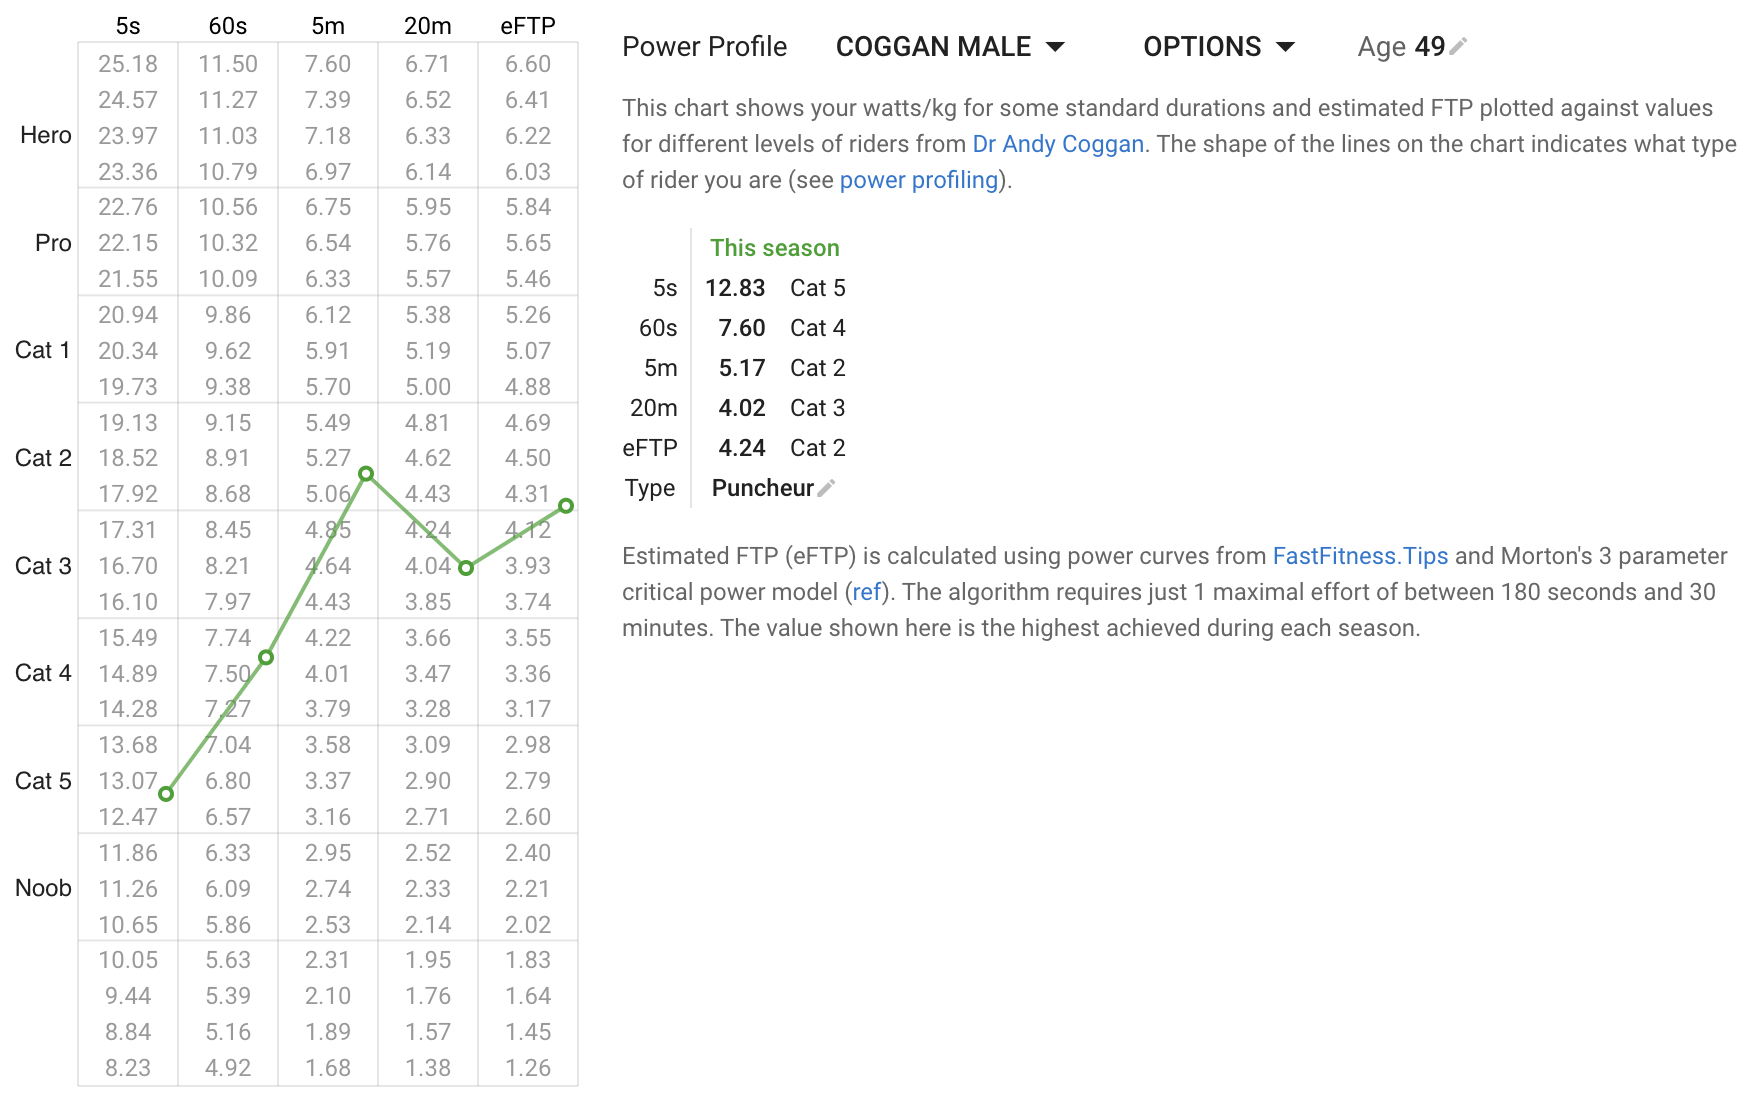
Looks like the Intervals.icu power profile chart somewhat matches the WKO one. Cool. I certainly think that your power profile vs your peers should be a good place to look for weaknesses. The long durations are not as valuable because less people do long max efforts.
TrainingPeaks has this lovely chart. Thus far the only use I’ve seen for it is to highlight how inadequate I am … Some days that’s good for motivation. Other days not so much.
This also explains why I always lose out on the town line sprints.
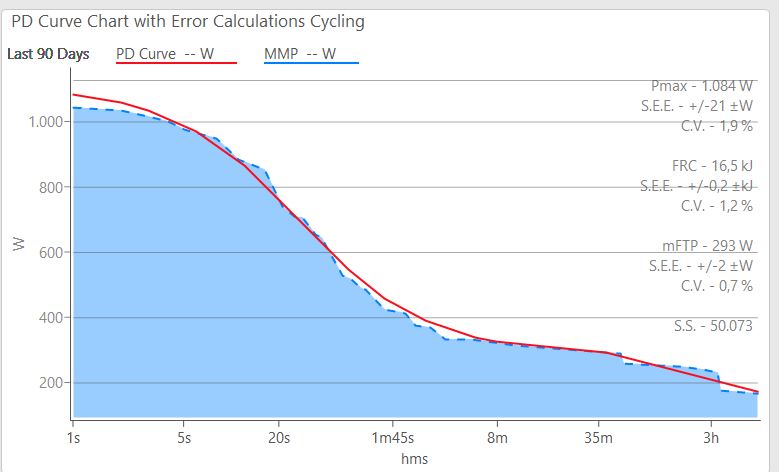
WKO5 pd curve only fitted with maximal efforts. Submaximal efforts will not effect the power curve. But you have have to fit the curve well with in 90 days short, medium en long max efforts.
I have paid for WKO5 (25% discount on black friday) and it is all the money worth!
The power curve you posted certainly looks much better than what we saw in WKO4. From memory, they made an adjustment to the way the curve is fitted to the data at durations between about 20 minutes and TTE when WKO5 was released, and it’s quite possible that they’ve made more refinements since then.
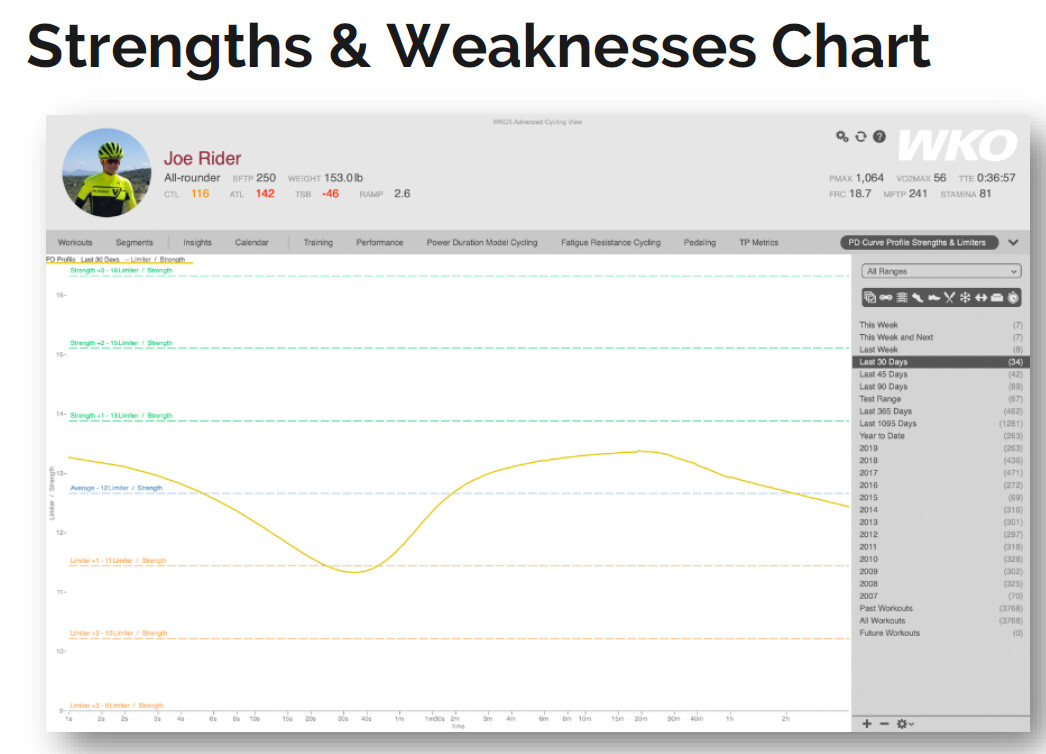
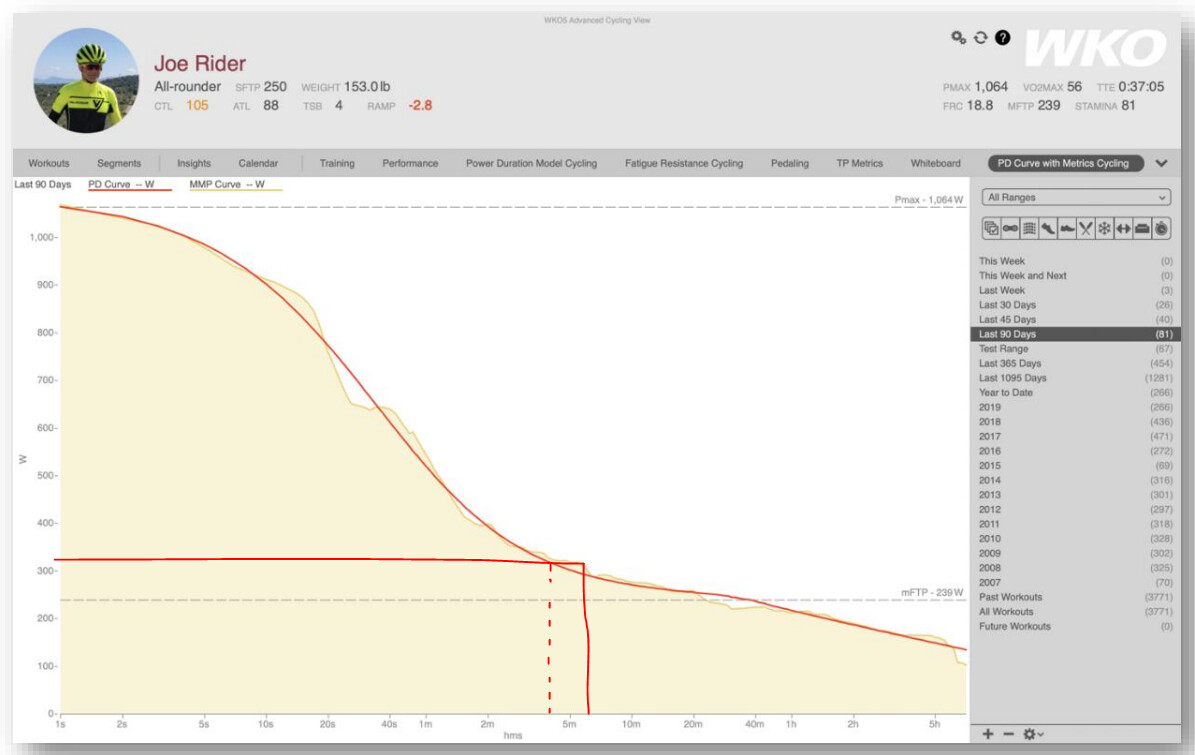
Having said that, here is a screenshot from Trainingpeaks that shows the MMP data to be significantly over the PD curve in the 5 to 15 minute portion of the curve and would underestimate TTE for this rider at 320 Watts by about 20%, Perhaps this is outdated. Who knows.
WKO5 dont make predictions. It’s only give information about the imput you give the program. So when i dont do long max efforts, the program will not give you the real TTE numbers.
When i see at Joe Rider, i think 37min for 320 is a good time. After 37min you see the MMP curve going down, so he need some longer efforts for 40-60min to fit the model.
I don’t expect it to make predictions, I expect it to be able to model existing maximal efforts correctly.
Just to be clear, when I was talking about TTE, I was specifically talking about at 320 Watts where the lines are sketched. The difference between the model and the actual maximal effort must be more than 60 seconds.
The WK05 model weights in the same way submassimal and maximal efforts, and this does not make sense to me. Even with their claim that “we are not trying to make predictions, but to estimate biological parameters”. Giving the same weight to maximal and submassimal efforts is not a good way to estimate biological parameters, because they will be affected (dragged down) by the submassimal bits.
What they should do is to do a fit with the MMP being the lower bound of the “PD curve”, with an error that is “asymmetric” and not least squared. It should penalise strongly the PD fit to go under the MMP, but penalise less for overestimating.
I agree. I’ve tried to have this conversation with Tim Cusick but he isn’t really up for listening. and I’ve seen others much more knowledgeable than myself try without success. He pointed me in the direction of Andy Coggan’s webinars from the release of WKO4 but all they do is go into how the model is statistically very good, but doesn’t address any of the concerns above.
I was googling testing for normalised residuals but I think a disagree. I cycled away my short power residual last week and the effect was a big drop in mFTP and a rise FRC. So high short power residual will overestimate your aerobic contribution.
Yesterday I tackled my long duration residual which resulted in a slight bump in mFTP and TTE. And I think/hope tackling my medium duration residual will increase my mFTP at the expense of TTE