Hi there.
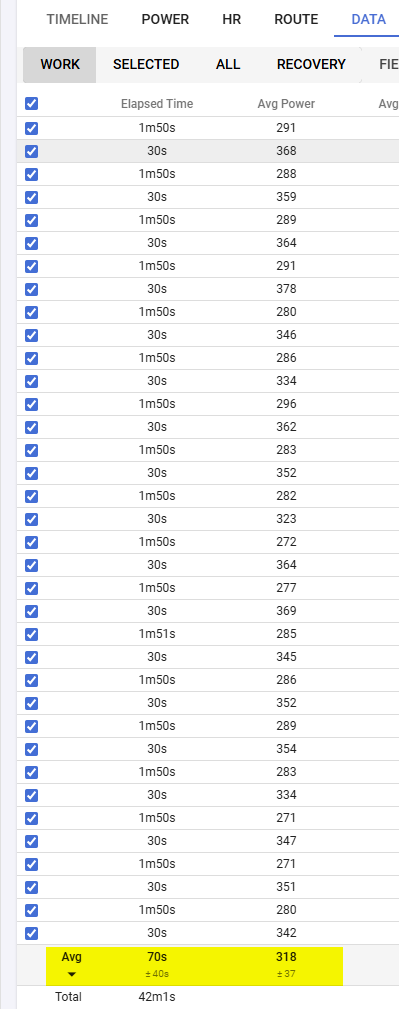
I noticed that the average calculation of the data tab (here for a cycling activity) is not what i was expecting.
It’s just taking into consideration the total count of intervals, but should (at least in my opinion) take into consideration the duration of the intervals aswell.
If i am looking e.g. on these OverUnders with different timelength between the over and under portions, the average (e.g. see here the avg pwr) as a whole is wrong/puffed up. (i wish it would be true ![]() )
)
I just saw that @Roman_Skakov posted a (maybe) related issue.
I am not sure it this issue is new or if you intend to calculate it that way.
Thanks anyway for some clarification ![]()
Is my report here valid or not?
As you said… it was probably implemented that way by design.
This was the announcement
Just found the same issue today, I had a very odd climb, with 1h07min at very low speed (~10kph) with a friend, and I just added a lap/interval for a 2min all out I did in the end of the climb (~22kph). => I want to know my average speed for the whole climb, Intervals give me an average speed for the 2 intervals selected of 15kph, where the truth would be somewhere close to 10/11 given the duration prorata.
As a scientific person I cannot agree we can just say it is “by design”, calling it an average is just false, and it would be great if this could be corrected.
That said… Fantastic app!

Sorry, but I have to disagree. Because this is the average of two intervals. The average of 10 and 22 is 16 (because 32 / 2 = 16).
What you mean, and what you want, is the integral of speed over time divided by the total time. But that is not “the average” of two entities.
You want:
v_avg = (1/T) * ∫_0^T v(t) dt
But it’s implemented as
(v₁ + v₂ + … + vₙ) / n
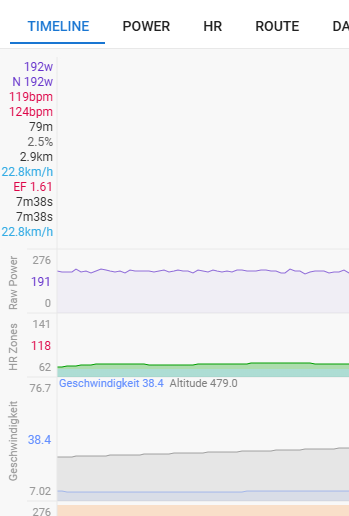
If you really want to know the average speed over multiple intervals, the quickest way is to do that in the timeline tab. Really, this is superior than the data tab.
You can zoom to any area, and it will show you all the average fields for that area you want to see at the top left:
Yes but I like the fact to be able to define my intervals (for example every km of a climb using garmin laps or whatever), then being able to select them all and know my average power over the climb for example. In the timeline tab I would have to try to zoom precisely where the 1st interval starts and when the last ends. Or is there a way by selecting one or multiple adjacent intervals, to zoom only on these in the timeline?
Thanks a lot!