Interval data table updates

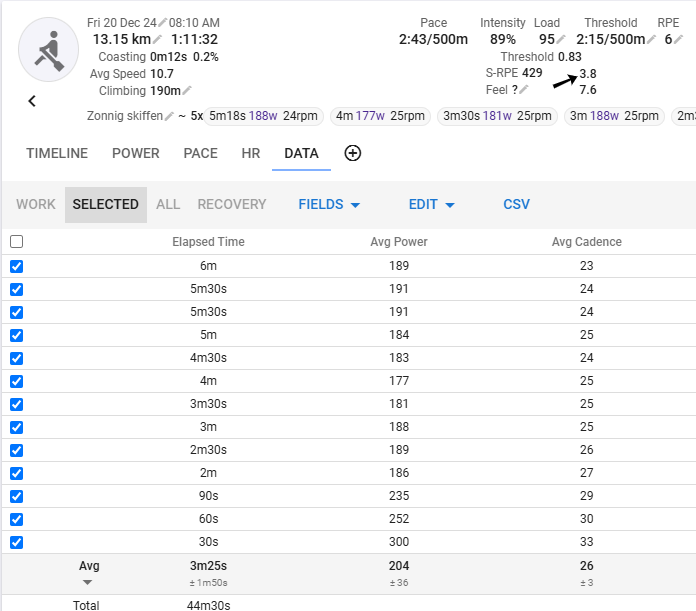
The interval data table on the activity data page now displays averages (with standard deviation) and totals for the selected intervals. Hover over interval group chips under the activity summary to highlight those rows on the table and click the chip to select.

You can see the same data under the ride timeline chart. Click the “Intervals” drop down toggle under the chart (highlighted in blue here):

For custom interval fields there are new checkboxes on the description tab to control calculation (or not) of averages and total for the table. It doesn’t make sense to display a total for “Max Core Temp” so I have turned that off:

16 Likes

Didn’t know I wanted this but already really enjoying it.
For me I’d like the default to be all work intervals (but certainly isn’t a hill I want to die on).
Another super super tiny point, I don’t think W’bal Delta needs a grand total aggregation.

1 Like

The averages are not weighed by the interval duration.

Here is how I expected this table to look, roughly:

Workout Summary - media/cb20538ec3-20241220-085210.cso.csv
--|Total|-Total----|--Avg--|-Avg-|Avg-|-Avg-|-Max-|-Avg
--|Dist-|-Time-----|-Pace--|-Pwr-|SPM-|-HR--|-HR--|-DPS
--|13143|01:13:12.4|02:47.1|146.4|21.8|000.0|000.0|08.2
W-|09343|00:43:57.7|02:21.2|191.9|24.9|000.0|000.0|08.6
R-|03814|00:29:15.6|03:50.1|078.0|17.1|000.0|000.0|09.1
Workout Details
#-|SDist|-Split-|-SPace-|-Pwr-|SPM-|AvgHR|MaxHR|DPS-
01|01289|06:03.6|02:21.1|189.8|23.0|000.0|0.0|09.2
02|01161|05:27.1|02:20.8|191.9|23.8|000.0|0.0|09.0
03|01148|05:27.2|02:22.5|192.1|24.5|000.0|0.0|08.6
04|01052|04:56.4|02:20.9|186.0|24.8|000.0|0.0|08.6
05|00947|04:27.2|02:21.2|184.5|24.2|000.0|0.0|08.8
06|00822|04:00.0|02:26.0|177.5|24.7|000.0|0.0|08.3
07|00643|03:03.0|02:22.3|185.5|25.2|000.0|0.0|08.4
08|00634|03:01.8|02:23.4|187.7|25.3|000.0|0.0|08.3
09|00528|02:28.9|02:21.0|189.7|26.1|000.0|0.0|08.1
10|00422|01:58.6|02:20.4|187.9|26.8|000.0|0.0|08.0
11|00335|01:30.8|02:15.3|232.1|28.3|000.0|0.0|07.8
12|00240|01:01.6|02:08.4|250.3|30.0|000.0|0.0|07.8
13|00122|00:31.5|02:09.4|296.5|32.4|000.0|0.0|07.2

I do like the interval detection on intervals.icu.

I am fine with leaving the average calculation as is, but for custom intervals I think a time weighed average is better. (I like to repeat workouts and beat the average of the previous time.)

Como podría hacer en esa tabla para ver el global de toda la sesión?. Lo que hace es identificar los intervalos e indicar los valores de los intervalos y después los promedios. Pero hay datos que no los indica bien, pone que son de recuperación cuando no lo son. Como podría establecerlo para el total de la sesión o segmentarlo en primera mitad y segunda mitad?