Allow users to choose alternatives to TSS

Chris1982, just a w few hours for now. I will experiment with various functions and update this thread if/when I find something interesting. For now I am just using this so I can finally get rid of standard TSS and not get annoyed every time I see it :slight_smile:

Looking at the recalculated history from the last 1.5 years though I already see it predicts peaks better for me and my gf. It also showed very sharp increase in fatigue for my gf at the time she strained her quad tendon which TSS didn’t show so I guess it’s a small win already.

EDIT:
As my PioTSS function produces lower scores than TSS in general, especially if you do a lot of easy/long riding it might be a good idea to multiply the output by 2 or so. This way the scale will be similar to TSS and colors for the “Form” graph useful again. As an example my TSS based Fitness/CTL score was tad above 100 while my PioTSS one is 42. If you have set any starting Fatigue/Fitness in the calendar remember to adjust those as well as new functions might be on a slightly different scale than the old one.

2 Likes

This is going to be a rabbit hole, I just know it. But I’m going down…

We aren’t physiologies or exercise scientists. So let’s start with Seiler: How long it too long, how short is too short? Essentially, Seiler proposes that at a given intensity [call it percentage of FTP], for some time, the stress per unit of time is almost constant. The length of that ‘some time’ depends on the intensity, obviously. In that domain, 1 hour at 100w produces a stress that is almost [not quite] half of the stress from 2 hours at 100w.

But then, at some point, call it t’, the stress per unit of time begins to rise: the next minute adds more stress than the previous minute. The mathematically simplest statement of this idea is that
stress per unit of time = a * exp [bt] for t > t’.
Here, a and b are constants to be determined and exp is the exponential function, e.

Our expression for total stress in these circumstances is therefore:
stress = t x l(t)
for t = elapsed time and l(t) = stress as a function of time, given by:
l(t) = l’ for t <= t’ [<= means less than or equal to]
l(t = a * exp [bt] for t > t’.

We have three parameters. These are all going to be personal, varying from one individual to the next. And probably from one day to another.
t’ is the time of onset of exponentially increasing stress. This is surely a function of how fit and trained one is. Perhaps we could estimate this as the time of onset of HR drift – I think that is the meaning of Seiler’s work on endurance. The problem is that the time of onset of exponentially increasing stress depends on the intensity: the higher the watts, the sooner the toll begins to rise sharply.
In principle, one could estimate t’ for different intensities. OK, so one parameter down.
a and b are more difficult. They can only be estimated from a regression between the stress score as calculated and such measures as RPE, the next day’s HRV and so on.

Interestingly, Coggan and Allen, who pioneered TSS, used the fourth power function to calculate load from power/FTP, because that seemed to correlate better than other power functions with the perceptions of load reported by riders they had doing tests. It was not a random choice. Rather, it resembled the method the @PiotrekNL is proposing to use to find adj_factor. Furthermore, it bears similarities to the TRIMP function that preceded it and that is still in use.

So what of @PiotrekNL 's interesting idea? It certainly resolves an apparent issue with TSS. But it is also too simple to be physiologically appropriate. I mean, for example, that adj_factor segments the wrong function. It’s not that power below some value contributes no stress [try riding at 0.45 x FTP] for 12 hours and tell me that contributed no load!]; instead, it’s the time function that needs to be segmented – beyond some time, all powers contribute increasing stress.

So, do I come back out of the rabbit hole? Yeah, I’m not going to pursue all this. But will I adopt something like @PiotrekNL 's idea? Maybe, but I also use kJ and TRIMP as well as TSS to inform my training.

1 Like

Interestingly, Coggan and Allen, who pioneered TSS, used the fourth power function to calculate load from power/FTP, because that seemed to correlate better than other power functions with the perceptions of load reported by riders they had doing tests. It was not a random choice.

Idk what they intended but at the end of the day TSS for 1hour at FTP is 100 and TSS for 1hour at 70% of FTP is 50 while 1hour at 120% FTP is 144. It’s not a fourth power function, it’s a quadratic one. The reason is that the formula applies wrong math which results in nonsense like TSS increasing after adding 0W intervals in random places.

It would be great to see original Coggan’s and Allen’s arguments. If we understand what they tried to express with the function we could correct the math while keeping their understanding of the physiology. For now though I’ve just took their function and corrected the most glaring weaknesses of it.

EDIT:
Thinking about it, maybe 4th power on power expressed as % of FTP would work nicely as well. This way we would get:

1hour at 50% FTP 6.25TSS
1hour at 75% FTP 31.6TSS
1hour at 90% FTP 65TSS
1hour at 100% FTP 100TSS
1hour at 120% FTP 207TSS

The corresponding scores for PioTSS are: 1, 30, 67, 100, 186
It’s pretty close but maybe fourth power keeps the “spirit” (not the effect) of original TSS better?

1 Like

There’s no reason to check 1 hour at 120%, no one is able to do that kind of thing. :wink:

1 Like

There’s no reason to check 1 hour at 120%, no one is able to do that kind of thing. :wink:

Yeah but it’s proportional to duration so something like 6x5mins at 120% is comparable to 4x15 at FTP.

2 Likes

@PiotrekNL I don’t think that means there is a problem w your code / function. I think that means it’s working exactly as planned. Or maybe just needs the exponential curve adjusted a bit steeper ?

It’s an exponential intensity measure, meant to differentiate from TSS for high - level efforts near & above FTP.

What does it produce for a VO2 set 4 x 60 mins @ 150 % FTP ?

And what does it do for a 30 min at FTP ?

For long rides at low intensity, you can probably use old school TSS, right ?

@Chris1982 I am sorry but I am not sure if you really meant Vo2 set at 4x60 minutes as such workout doesn’t make sense but if you meant that you can just look a few posts above where I provided sample scores. 150% FTP is scored at 364PioTSS/hour.

And what does it do for a 30 min at FTP ?

50 PioTSS. I scaled it so 100% of FTP is the same as original TSS.

For long rides at low intensity, you can probably use old school TSS, right ?

The whole point of this post is to convey the message that TSS is a metric created by a math mistake. It’s wrong. It’s less wrong for rides of set duration (if you only do 1hour every day without ever stopping it’s not so bad) and very wrong for long rides.

TSS produces:
1)33TSS for 20m at 100% FTP
2)57TSS for 10m at 100% FTP then 40m at 1W then 10m at 100% FTP

Using that for anything is just shooting yourself in the foot.

1 Like

@PiotrekNL holy crap, sorry. No I meant a VO2 w 4 x 60 sec not min !!! LOL Brutal typo on me, sorry !

What does your model produce on that ?

And yes, I agree TSS is trash; I don’t use it or even consider it.

But I don’t do long rides, especially not long rides with long breaks in the middle, so zero clue how TSS works for those rides. Thanks for clarifying !

So that’s really neat ! TSS is trash for high intensity work, and for long, low intensity work !! How spectacular ! :laughing:

It sounds like TSS literally only works if you did the exact same ride, on a trainer, 20+ min blocks, constant wattage, exact same warmup & cooldown, and never stopped for a nature break. :roll_eyes:

Like… maybe they could have spent a few more hrs and come up w an equation & system that works ??? :laughing:

EDIT: Could you help me understand what part of the code defines the exponential curve ?

Maybe you could try using a power duration curve fitted using power laws. It’s a good fit with R^2 of 0.974 from my power data.

Then you take the power and compare it to the TTE at that power.

Thus let’s say you ride for 1 second at your 10 second power. That is 1/10. Let’s say you ride for 6 mins at your hour power, that is also 1/10. Let’s say you ride for 24 mins at your 4 hour power, that is also 1/10.

But to simplify you could just take the average power, and ride time, and scale against the TTE for that power.

If we take 10 mins at FTP, 10 mins at 0W, 10 mins at FTP. Then average power = 2/3 FTP. Total time 30 mins. If we assume TTE is 4 hour (it won’t be) for the purposes of this exercise. We get 1/8 x 2/3 FTP = 1 / 12 FTP as the load.

Take 20 mins at FTP, we get average power = FTP. We get 1/3 x FTP = 1/3 FTP. In other words we get four times the load for 20 mins at FTP compared to 10 mins separated by the ten mins at 0 mins. This caters for the non linear scaling of the stress response.

Scale as appropriate.

2 Likes

I considered using TTE curve (btw, is there a an average TTE curve published somewhere?) but it leads to all workouts to exhaustion as the same stress/stimulus (whatever TSS was supposed to measure). For example 6min at max 6 minute power would produce the same result as 60minutes as FTP. That doesn’t sound ideal as it’s reasonable to guess who is stressing their body more: someone doing 3x 60minutes at FTP per week or someone doing 3x 6minutes at VO2max (assuming that’s 6 minutes power more or less).
Maybe I am not getting your idea though?

But to simplify you could just take the average power, and ride time, and scale against the TTE for that power.

Probably using Normalized Power here is a good idea. Normalized Power is ok (+/- physiology behind it which I am not going to discuss as I don’t know much about it; it seems reasonable). What doesn’t work is calculating Training Stress Score by taking square of NP (IF is NP/FTP) and multiplying it by time. This promotes low power outputs because they are first weighted less when calculating NP and then the whole thing is squared and multiplied by time.

Again though we are coming back to my “it’s just bad math” conclusion.

Hi All. I did some work trying to help all in this thread. I hope it works.

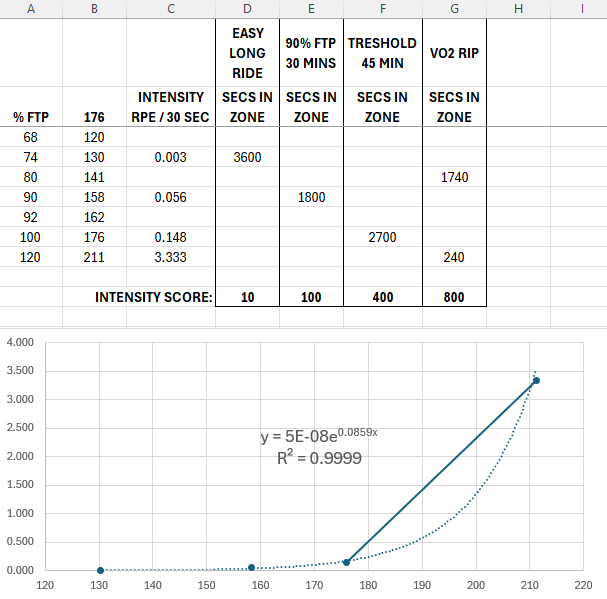
In Excel I did four rides., Easy Long, 90% FTP 30 Mins, Threshold / FTP 40 mins, and VO2.

I then ascribed them relative total intensity scores.

[ We don’t need to argue about the relative intensities here. They are likely different for each rider, and if this works out, this metric would start w you setting these four values, and it would then back - calc a custom equation for you. ]

I then used actual calculated seconds in zone from each ride to back - calculate a value for “INTENSITY RPE PER 30s IN ZONE”.

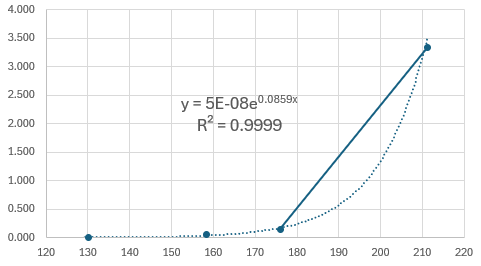
Used those values to get a curve, & equation.

I feel like I’m onto something here.

Can anyone help me: How do I input that equation into col C to complete the rest of the chart ? It covers from 68 - 150% FTP. [ Spent 30 mins on internet, really can’t get it. ]

1 Like

I missed the above quote by @PiotrekNL , my apologies.

This is bloody close !! And might even work better than what I’m jamming at.

The difference would be that instead of preset values of each % FTP, each rider can just enter their perceived, and it would back - calculate your own custom equation, which shoud give you better results ?

Or no ?

If I read above right, I think what I’m scratching at is a much much stronger exponential curve, to capture the sheer intensity of VO2 sets over Thresh, 100% FTP work over 80 - 90% FTP work, etc.

Which takes us back to what is load and what is it not? How do you compare the stress of these two different things? If we are trying to manage progressive overload.

It’s clear not all load is equal in terms of the stress induced, and recovery necessary. Your bit above doesn’t address it. That’s the elephant in the room.

We also need to be careful that we don’t use the exact scenario we use to build our model to also validate it. It’s needs to work for all possible scenarios some wildly differing from the one the model was built to address.

Pretty sure Coggan has said that their lactate measurement at the different intensitys were best interpolated with a power function between 3.5 and 4.5.

1 Like

Just sharing some references that may be useful to the thread. In my own experience, my lactate curve fits best with an exponent of 4.5. Skiba has a range of about 2.5 - 4.6.

Coggan’s early paper describing FTP :

And Skiba has used a similar rationale for GOVSS and cycling metrics:

2 Likes

Coggan’s early paper describing FTP :

Thank you for reference. Now I understand exactly where Coggain messed up:

He tried to imitate TRIMP formula in the form:

TRIMPS = exercise duration x average HR x a HR-dependent intensity weighting factor

but that only works for linear transformation, it doesn’t work for not linear one.
That’s why general formula for more advanced TRIMP versions is:

TRIMPexp = sum(D x HRr x 0.64ey)
(see reference: TRIMP - Fellrnr.com, Running tips)

This the same as area under the curve.

With this in mind and to keep Coggan’s idea the correct math is:

0)Express power function as fraction of FTP
1)Calculate 30seconds running average (like Coggan mentioned)
2)Apply transformation to that function (raise values to 4th power)
3)Take area under the curve

This produces very similar function to the one I quickly engineered above (at least in interesting domain). Now when I understand the idea behind the original TSS I should edit it to just use 4th power on power expressed as % of FTP. This would keep original Coggan’s idea (but again, it would produce very similar values to my function).

You can see how it works with TRIMPS:

TRIMPexp = sum(D x HRr x 0.64ey)

Adding any duration of “work” at baseline HR doesn’t change the end result.

Which takes us back to what is load and what is it not? How do you compare the stress of these two different things? If we are trying to manage progressive overload.

It’s clear not all load is equal in terms of the stress induced, and recovery necessary. Your bit above doesn’t address it. That’s the elephant in the room.

The elephant in the room is that Coggan applied incorrect math and messed up units in his function. It’s clear reading his original text. He just made a math mistake.
Apply correct math described above and all the problems with TSS increasing when inserting 0W intervals in the middle of the ride disappear along with other issues like over weighing easy rides.

It’s still not ideal but it’s a significant improvement over TSS.

Another way to think about it:
Imagine you have continuous lactate monitor which gives you a perfect lactate curve during exercise. You want to calculate training load. What would you do? You would take area under the lactate curve. That was the whole idea behind more advanced versions of TRIMPS and the whole idea behind Coggan’s observation about power^4 corresponding to lactate levels.

Coggan observed that you can raise power values (as % of FTP) to 4th power to get a function that corresponds to lactate levels. Now you can answer two questions:

1)What is the constant power that produces the same lactate response that the workout you just analyzed?

2)What is the training load of that workout?

To answer question number 1 you take the average and then 4th root (as lactate levels are proportional to power^4). This is why NP formula has 4th root in it.

To answer question number 2) you just take area under the lactate curve.

Coggan somehow forgot to take step back from his NP idea to get back to his original idea that lactate levels correspond to physiological processes.
Again, I am not inserting any new observations about physiologically here. I am just taking the original Coggan’s idea and correct his elementary math mistake.

2 Likes

@PiotrekNL this is a deeply fascinating and informative post, thanks a ton for writing it. It explains so much about the “sloppery” and almost intentional haziness that surrounds this topic, to this day. Or perhaps more accurately an ubiquitously accepted "Yes, we all agree and know it’s all inaccurate, and the details never line up, but we all also agree that it’s 100% rock solid and we have no interest in reevaluating it. It is… THE SYSTEM. REVERE IT.

[ To be clear: Referring to the industry and sport globally, not any users of this forum or thread. Folks around here tend to be the more detail-targeted crowd ! :slight_smile: ]

Everything in this post is hugely more valuable than TSS, again, a massive thanks !!

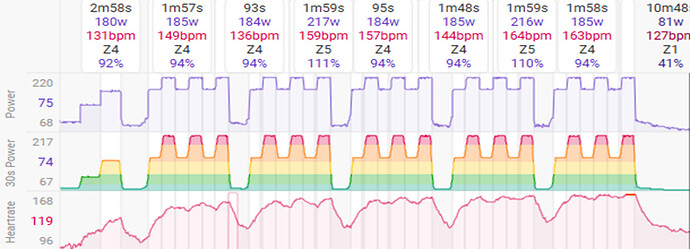
My heart soared when I saw you mention Area Under the Curve [ AUC ]. I have wondered for years why we aren’t using it; we have the data, quite literally right in front of our faces; it’s displayed directly on our watches & screens for every run, ride, etc, as in the sample .icu ride pic, below. We are staring right at it, but not calculating it & using it as the valuable metric it could be !!! :open_mouth:

Vs. TSS, AUC gives us an exactly quantifiable and 100% accurate measure of total work done. That is robust acorss any & all rides, of any and all intensities, and eats mid-ride rests for breakfast. Have a nap and then finish the ride, AUC will still accurately show total work done.

AUC is step 1.

My monkey brain was & is puzzling w step 2: an addition / modification to the equation for AUC that exponentially weights efforts vs. % FTP so that 30 s @ 150% produces a massively larger value than even 60 mins at 50% FTP, regardless of total work done.

90% sure that is the “4th power” function that you’re talking about, right @PiotrekNL ?

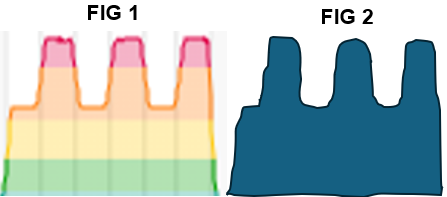
In the pic below, FIG 1 shows a zoom-in on one interval from the sample ride above. AUC would look at it as FIG 2; all watt seconds under that curve are worth the same value, and we calculate the total work done / watts output.
image

But as we approach and then exceed FTP, there’s an exponential increase in drain on, and ‘damage to’ / ‘training stress’ the body, and subsequent recovery time… and also whether that recovery is healthy, productive recovery, or we have done too much damage, and crossed from productive recovery to minor injury recovery and a decline / regression in training / fitness.

This WO took me like 4 - 5 d to recover from. [ Bad training, early in career, should not have done. ] I could do 4 hrs @ 50 - 75% FTP and do another ride the next day, no problem. Total work be damned !

It’s clearly possible [ but not easy !! ] to add to the calculation of AUC some math that accurately reflects what is shown in FIG 3; the exponential increase in 'intensity points per s / training stress / damage per s @ that level.

@PiotrekNL & others: What are your thoughts on the 4th power function vs. the equation I came up w ? Pls forgive; I am at the limits of my depth here. I think my equation is a hugely steeper curve, is that correct ? And if true, it would produce much larger scores at higher intensities ?

TBH, I am unable to read the Excel version of this equation, and understand how to write it in normal math…

image

@Chris1982

Coggan mentions the reason for transforming the curve in his booklet. Measuring the area under the power curve gives you total work (Joules) but doesn’t say anything about intensity.
It was noted long time ago (according to Coggan, I am just paraphrasing him here) that physiological processes (like lactate levels) depend exponentially not linearly on intensity. This is why when you try to estimate “training load” using heart rate you give “bonuses” for high zone and count lower zones lower. For example if your resting HR is 50, your max HR is 180 you know it’s much harder (stressful) to do 1 hour at 170 than 2hours at 85.
That’s why you must transofrm 170 and 85hr numbers first.

Similarly with power. 30 minutes at FTP is much larger stimulus than 60 minutes at 50% of FTP although both require the same amount of total work. How much larger? We don’t know but (again according to Coggan) scientists noticed long time ago that physiological processes (like lactate levels) depend exponentially on power (as % of FTP/MLSS) not linearly. That’s why you need to transform the power function so 50% of FTP is more than 2x smaller than 100% of FTP. Coggan noticed that p^4 is close enough looking at lactate levels. Others (in this thread) gave references to other estimations (p^4.5, p^4.3). Those are not perfect but make sense.

Now taking this idea if stress depends on lactate (and other processes) then total stress is area under the lactate curve. Sadly we don’t have it but as Coggan noticed it’s close enough if we apply p^4 to the power function.

It explains so much about the “sloppery” and almost intentional haziness that surrounds this topic, to this day. Or perhaps more accurately an ubiquitously accepted "Yes, we all agree and know it’s all inaccurate, and the details never line up, but we all also agree that it’s 100% rock solid and we have no interest in reevaluating it. It is… THE SYSTEM. REVERE IT.

Exactly.
Imo a bright 5 years old can see TSS is ridiculous (you add 5 minutes of not doing anything in the middle and get more? REAALLLY?). It’s easy to fix the ridiculous part and then we could focus on much more interesting problem of fine tuning it. Coggan even mentions in his booklet that he wanted a funciton that let coaches compare training loads of different athletes. TSS is hopeless for this because some athletes ride in the mountains and have a lot of freewheeling ballooning their TSS scores while others do “pure” work on the trainer.

Apply a sane function to both and you will get comparable results. Apply TSS and then you need a lot of mental gymnastics to justify why you are even using it.

1 Like

It also assumes an accurate FTP, and it maps well to MLSS. Doubt has been cast on that by a recent meta study that showed that the ftp derived value was in cases up to 40 watts away from MLSS.

It’s this equivalency of stress that I have difficulty with. We all know you can do completely different workouts that produce same load even with modified equations. Are they equivalent physiologically, probably not, else recovery would be about the same, and you could swap the workouts and see same progression.

Are they useful to progressively increase your loads each week? Almost certainly if you generally do the same mix of workouts.

1 Like