What are your axis, since they are not labelled, and where does the data come from?. R^2 of 0.9999 is very suspicious for a trend line, too perfect a fit to whatever the data is.
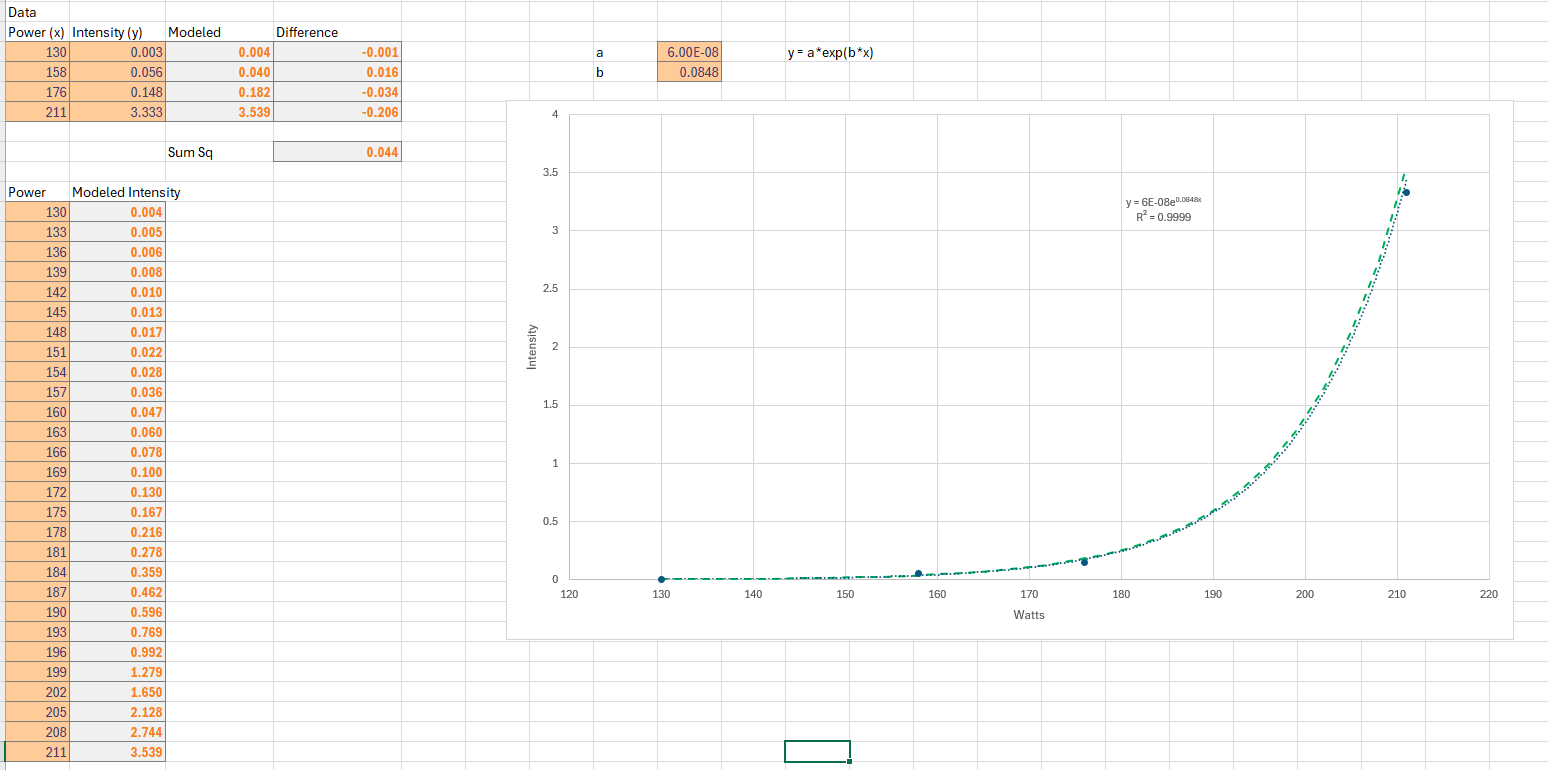
Maybe this will help? I used your numbers and fitted a curve to them.
https://1drv.ms/x/c/7aaa504c5ba71805/EaRstVz2ZLhGiPdJBYkxSvUBIEyJ67zk5fceTZd9etDRzA?e=HE2A83
1 Like
@Phil X axis is % FTP and Y is INTENSITY RPE / 30 SEC [ SPENT IN ZONE ].
I get it; it’s unclear in my post just above, w that image out of context ! It was clear in context, in my post a few above, you may have missed it. Begins w “Hi All. I did some work trying to…”
That post also makes it clear why R is so perfect. I was looking for the equation… LMK if any questions !
@PiotrekNL right on ! Thanks.
And RE: the 4th power equation vs. the one I came up with:
Low intensity vs. high, would the score for the high intensity rides be somewhat similar, or much higher w mine ?
Still working on understanding, but do want to nail this down and start using some form of this…
It also assumes an accurate FTP, and it maps well to MLSS. Doubt has been cast on that by a recent meta study that showed that the ftp derived value was in cases up to 40 watts away from MLSS.
First the usual caveat: “Yeah but TSS has the same problem and many more”
Do you remember which study that was? That’s interesting. I presume MLSS was lower.
It’s this equivalency of stress that I have difficulty with. We all know you can do completely different workouts that produce same load even with modified equations. Are they equivalent physiologically, probably not, else recovery would be about the same, and you could swap the workouts and see same progression.
Yeah but after all we try to measure training loads with one dimensional metric. It can’t possibly be perfect. It’s still worthwhile in my view to try to do a bit better than TSS.
Are they useful to progressively increase your loads each week? Almost certainly if you generally do the same mix of workouts.
My main beef with TSS and the reason I started looking for alternatives is that it’s only somehow reasonable on very rigid schedule: same workouts, same time, every time.
My life is different: I live in 4 different countries, ride my bike sometimes for 60-80hours per month, sometimes for 30, it depends on circumstances, weather and access to routes. TSS completely fails for people like me. I ride in the mountains, my TSS baloons because of all the freewheeling/coasting on downhills. I hop on the trainer: it’s hard to even achieve half. This makes PMC completely useless. It makes measuring training load difficult.
Coggan mentioned one of his goals was to create a metric coaches could use to compare loads between different athletes. TSS completely, utterly fails for that for reasons above.
How is intensity derived?
Please read the post, dude ! ![]() I totally explain it.
I totally explain it.
The numbers the equation came from are all even shown in the table !!
If you read it and something isn’t clear, LMK what it is, and I’ll explain / expand. Totally possible I didn’t explain well, etc.
Coggan’s idea when creating TSS was to use power^4 as he noticed that correlated pretty well to lactate levels and the idea lactate levels (and “other markers”) correspond to training stress better than total work. You can read his booklet linked above.
I am just taking his idea here.
1 Like
Fascinating thread, been thinking a lot about how limited TSS is in terms of representing load, particularly now with lots of plans pushing for tons of Z2.
I started using total work and work above thresholds as indicators (although very similar), but what I keep going back to is the fact that there should be a way to track loading for different energy systems separately.
the effect of a 500TSS week are obviously very different if that training stress was all in Z2 vs Z5.
If you recall at some point Trainingpeaks started talking about CIL (Chronic Intensity Load) as a way to track intensity load, vs CTL
I love the flexibility of this platform that actually allows to experiment. Great work David!
Again, a huge thank you to @PiotrekNL for taking the time to write the script that captures what he & I started talking about, above.
Pio, it works fantastically well. It’s a masterpiece ! I added it as a custom field and have been running it for a while now. I’m honestly considering swapping it out for my main Load metric to monitor fitness & fatigue. Still leaving mine on Load for now, as I am actually at the beginning of a TP a few mo long that consists of dead-simple Threshold solid-block WOs… the only situation where Load = TSS actually works.
But I can solidly say that for measuring intensity, and resulting training stress / load / fatigue, it is massively more useful.
I have changed the adjustment factor from .45 to .75; that looks like a more accurate reflection of the relative difficulty, load, & stress. If anything, I’d move that to .80 or .85… I think those scores miiight be more accurate, but holding off for now, seeing how .75 rides.
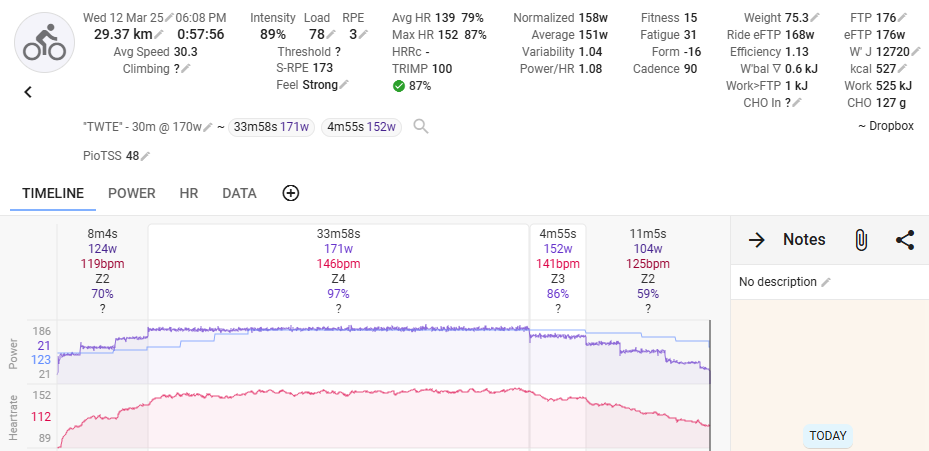
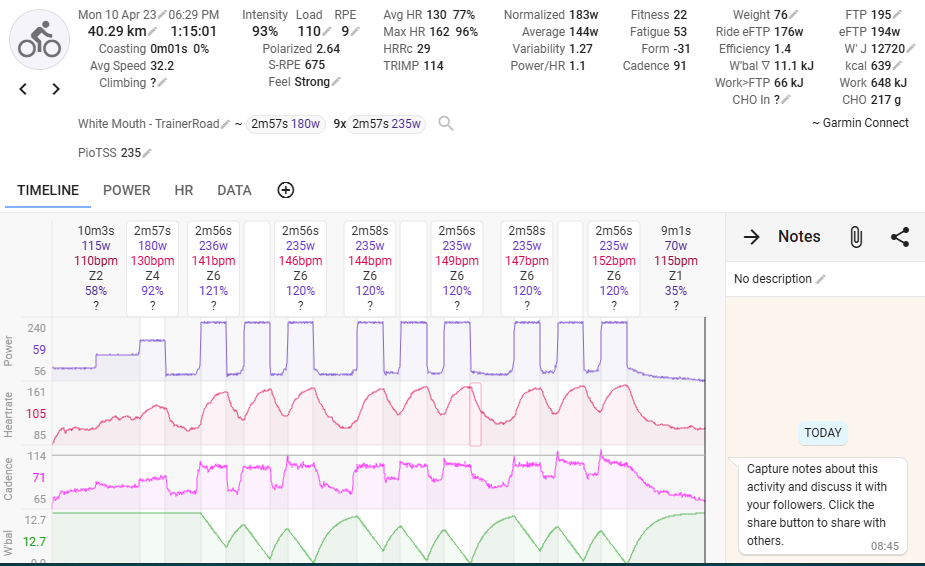
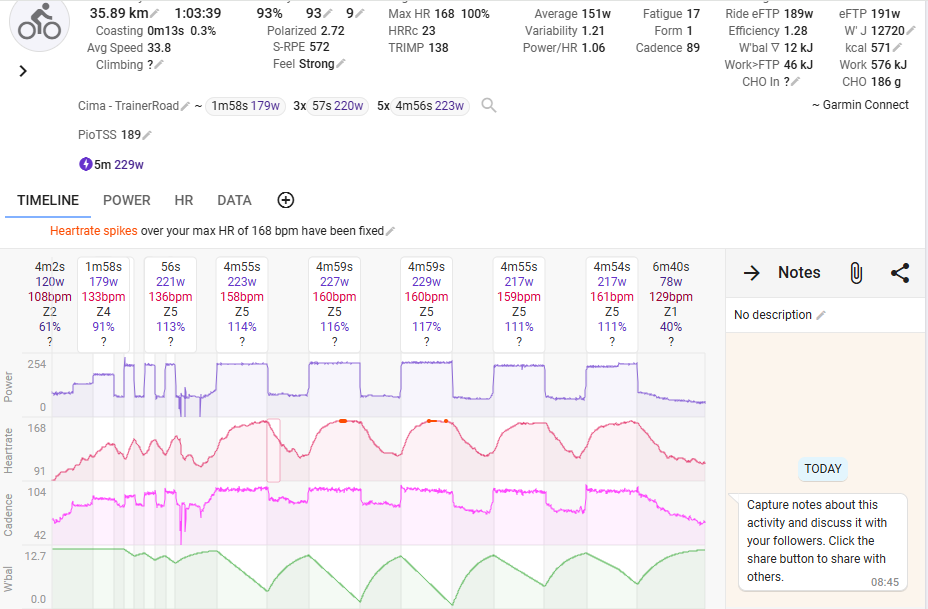
Take a look at a Thresh yesterday, and two hard VO2 Interval WOs.
I mean… as a basic, dead-simple point: If you’re crashing out W’ bal, there’s no damn way the Intensity, training stress, and fatigue are anywhere near similar [ vs. a Thresh ride ]. The two VO2 rides below were not “about twenty-five percent tougher, requiring about a quarter more recovery time”. They were massively harder than the Thresh ride, many many times harder, and required days off the bike to come back.
And a “training stress” metric should reflect that !!!
THANK YOU, Pio !!!
1 Like
Thanks for your kind words. Take a look at my edit of the original post. I’ve provided a function I am using now. I think it’s in the spirit of what Coggan meant when he came up with NP and then TSS (where I believe he just made a simple math mistake and then it was too late to backtrack from it). The results are similar to my quadratic function with one important difference that the new function values higher intensities more. I think that just using p^4.3 (or p^4) is simpler and better.
I have changed the adjustment factor from .45 to .75; that looks like a more accurate reflection of the relative difficulty, load, & stress. If anything, I’d move that to .80 or .85… I think those scores miiight be more accurate, but holding off for now, seeing how .75 rides.
If you set the adjustment that high you will heavily undervalue endurance riding. While original TSS does the opposite (the best way to balloon it is to noodle around for 5 hours and do a few short FTP+ intervals in the middle) it’s still important to remember that a few hours at 75% of FTP provides some load/stimulus. Another reason to just use p^4.3 or use a higher exponent like 4.5. Original Coggan’s data had exponent of 3.8 but as mentioned in this thread and elsewhere other data points to higher exponents, especially among trained athletes.
One big advantage of the fixed function is that you can now compare training loads between athletes. It was one of the stated goals behind TSS. TSS unfortunately completely fails at comparing loads between athletes who do different volume. As one example I took a popular running training plan for 7.5-8hours a week and got training load of around 330 - something which I haven’t always hit doing 15-17 hours weeks when cycling!
1 Like
But this is very individual. Some will find multiple 4 min VO2 max intervals wreck them, others will find they recover pretty well by next day.
Some will find 5 hours Z2 wrecks them, others are used to it and can do day after day.
2 Likes
But this is very individual. Some will find multiple 4 min VO2 max intervals wreck them, others will find they recover pretty well by next day.
Some will find 5 hours Z2 wrecks them, others are used to it and can do day after day
For the record my function (p^4.3) produces:
1)6x4min at VO2max = 87.6 PioTSS (assuming VO2max is 120% of FTP)
2)5hours at 65% of FTP (good value for a tough 5 hour z2 ride) = 78PioTSS
If we stick to the original Coggan’s exponent (4 instead of 4.3) we would get 83 and 89 respectively.
My function at least put those in similar ballpark and which one produces higher loads depends on exponent choice (which again depends on a population you measured)
1 Like
But that’s my point, for me your examples would not be equivalent. Someone else they might be.
Plus haven’t you assumed fixed percentages of FTP to suit your calculations coming out with similar numbers?
But that’s my point, for me your examples would not be equivalent. Someone else they might be.
Your point is that the function is not perfect. No one is discussing it.
It still improves on TSS as TSS is based on math mistake and is not a suitable function to measure training load (as it increases with adding 0 intervals or time in general instead of actual load).
Plus haven’t you assumed fixed percentages of FTP to suit your calculations coming out with similar numbers?
No I haven’t. I just picked some numbers for a typical session people do (around 25 minutes of VO2 max work is standard volume for VO2max intervals and 65% of FTP is something people may try to ride 5 hours on). Feel free to pick different ones and then compare the load.
I am not really getting what you want to achieve here. No one is suggestion the function is perfect. Feel free to suggest a better one. It’s an interesting area to research.
1 Like
Really interesting topic.
It seems to me a better one dimensional “Load” score would treat efforts above Zone 2 differently to efforts below zone 2. For the components above Z2, the score would have to consider the avg power of the interval compared to the Time-to-exhaustion at that power level and then multiply the Duration of that inteval by a power slightly above 1. e.g. 1.2
For instance, let’s compare the workouts
A) 20min all out effort
B) 10min all out Effort with rest then repeat the 10 min all out effort
A calculated:
20 mins at 105% FTP would have an effort of about 100% as 20mins is the expected TTE for 105% FTP.
100% x (20/60 m)^1.2 = 0.267
you could normalise this to TSS by multiplying by 100. therefore 26.7 for this 20 min all out effort.
B calculated:
10min all out effort would calculate:
10 mins @ 108% FTP = 100% effort as TTE for 108% is about 10mins.
100% Effort x Duration of (10/60 m)^1.2 = 0.116 or 11.6 Normalised for each 10 min all out effort.
therefore 10min all out effort scores roughly 23 where as the 20 minute all out effort scores 27.
Of course, an all out 1h effort still scores 100 with this primitive formula.
You see here that 3 x 20 minute all out efforts scores 81. While 6 x 10 minute efforts scores 70.
This scaling might need to be fixed. I pulled the exponent factor of 1.2 out of thin air.
I think you can continue to calculate the efforts below Z3 like TSS.
Hope that makes sense.
Another primitive metric could be derived by calculating the area under the activities power curve and normalising a 1 hour ride at FTP to 100. This could include the area under the graph beyond 1h even if you didn’t ride beyond an hour. The power curve plot at 2h for a 1h all out effort would be 50% of FTP, and 33% at 3h etc. So you may include this part of the integral in the normalisation.
The more I think about this, the less convinced I am of one metric to define a workout. I like Garmin’s approach of treating Anaerobic, High & Low Aerobic components differently.
I think you can continue to calculate the efforts below Z3 like TSS.
TSS fails even at this as adding zero intervals/very easy riding balloons the score.
TSS is just the worst possible metric, it’s like measuring temperature with a bathroom scale - the units are wrong. TSS measures mainly time, not load.
, the score would have to consider the avg power of the interval compared to the Time-to-exhaustion at that power level and then multiply the Duration of that inteval by a power slightly above 1. e.g. 1.2
Coggan’s idea was that lactate levels correlate with other physiological processes that’s why he proposed to tie training load with lactate levels at given power. I think the idea is great and works pretty good once you fix his math.
I don’t think you can say the same about TTE so I don’t think it’s a good metric for a training load.
For instance, let’s compare the workouts
A) 20min all out effort
B) 10min all out Effort with rest then repeat the 10 min all out effort
It’s true that the ideal function measuring load would assign a higher score to 1). Coggan mentions this problem in his booklet linked a few posts above. He concludes that it’s not possible to fix without major complications. I think that to fix it you need deeper understanding of lactate levels. One way or another TSS is already unaware of the order of intervals (you can take the same ride, slice it into 5 minutes intervals, sort it from high to low or the other way around and TSS is going to be more or less the same).
What about if you consider that 24hours a day, you are calculating TSS.
So…we agree there’s some baseline of exertion just with surviving, right? Well if you calculate a TSS from all the time spent not exercising, any time spent exercising without doing much is just zero sum.