I didn’t know that you still burn a lot of fat even at high intensities, all the more so if you are fit.
4 Likes
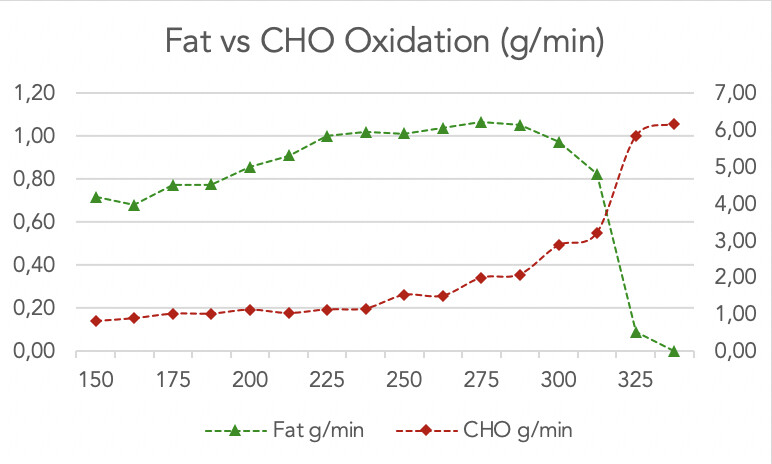
Pro cyclist , 55kg. CHO and Fat ox shown below. Apparently after a whole block of winter training. Diet is not LCHF, normal to high carb. Got this off Twitter from Aitor Viribay Morales.
Source : https://twitter.com/MVAitor/status/1349681580806201344
3 Likes
What does this show? That we’re always burning (is that a decent slang for oxidation?) more fat than carbs (at least this Pro athlete is, it’d be cool to see this for normies) until a certain threshold? And that happens regardless of diet?
So, could I realistically figure out my point at which fat ox is highest, but just before my body starts to turn to CHO for fuel and spend a lot of time in this “fat burning zone”? (To use a thing I’ve seen on exercise machines at the gym.
Thanks
Some of my observations :
- Its showing me that the “cross-over” point is at around 240W where Fatox = CHOox = 1 g/min.
- But this athlete has high metabolic flexibility in that right out to around 300W, fat flux is about the same or even slightly greater.
- As one would expect, the rate of CHOox is greater at higher intensities and scales exponentially after 250W out to point of exhaustion. This suggests that a greater share of kcal per min or per hour is going to come off CHO (glycogen and/or blood glucose) at higher intensities (which agrees with a lot of studies).
To the point of the original article from FFT, calories burned from fatty acids/lipids are still maintained to around 300W, not greatly diminished or dipping down to zero after cross-over. This popular idea could infact be an artifact of the indirect calorimetry testing and algorithms.
Basically, I’d do my homework asking all the necessary questions of an exercise lab before taking an indirect calorimetry test myself. I would not want spurious data given to me that could drastically influence training direction.
2 Likes
So, could I realistically figure out my point at which fat ox is highest, but just before my body starts to turn to CHO for fuel and spend a lot of time in this “fat burning zone”? (To use a thing I’ve seen on exercise machines at the gym.
Exercise fuel utilization balance between fat and CHO is going to come from an interplay of factors, of which exercise intensity is only one. What you eat, what the ambient temperature and time of day is, stress etc all influence the fuel mix your body uses.
Unless you had OCD and controlled all these conditions down to a T, I don’t think your maximum tat oxidation rate (or what they call “fatmax”) is always going to remain pegged to one point. Its likely its going to shift around day-to-day or even just within a day.
So if you stuck to some arbitrary number and continued training at that point for prolonged duration, you risk missing out chasing your true maximum fat oxidation rate zone.
I think its far better to consult a good exercise test lab to get data/intelligence specific to your body. Ask them to elaborate on the subtle complexities surrounding fat oxidation.
1 Like
The article brings very little to the table imho and I have to say: I’m not a big fan that kind of sensationalistic “journalism” or as Alex calls it “myth-busting”. It seems to me if anything the article is intended to leave the reader more confused than before…
One point is just plain wrong (“fact”#6): There is no non-metabolic CO2. This scientific despute has been settled a long time ago.
Imho the take home message has not changed with that article. Want to improve your cycling performance: Work on VO2max via polarized training in the general phase. Work on lactate buffering and VLamx during the specific phase.
When you do LSD rides, it’s less detrimental to go too slow than too fast. Maximum total FatOx will be somewhere between 45-65% VO2max (=use 6MM power as a surrogate).
If you want to go to lab, be prepared to spend a lot of money and choose wisely. IE: The standard ramp test (even with met-cart) will not give you any better data than your powermeter. You need at least a step protocol with 5min steps. And even then the numbers will not be set in stone, as FatOx kinetics change over the duration of excercise… the data will be significantly different in fed-state, after 60min, etc
Less sensational, but more informative:
4 Likes
Is there any metabolic significance or training application to a cross over point?
If that’s the point where fatox dives down, and you’re a long distance athlete, you might want to take note and “manage out” this scenario with nutritional intake (exogenous carbohydrates) and/or staying below that intensity. I think this would be useful to know for long distance triathletes. Does it matter for a 1h crit racer? Maybe not so much.
Thanks. I assume then that as this guy is really well fat adapted he’s got another 60W to play with before is FatOx dives. Most likely not the case for the rest of us.
1 Like
The athlete I showed has wide “rangeability” in his fat metabolism for sure. He’s got a lot to play with, even at 300W his FatOx is like he’s sitting at 225W but in that span of wattage, observe the exponential rise of CHO ox.
The original publisher has not identified who this athlete really is. So we’re not sure how this engine really translates to performance in his events.
The subject of understanding metabolism to get proper training and performance is a key for me.
But I must say it’s a difficult topic.
-
Lots of savvy people talk about artifacts with the plain utilization of stoichiometric equations during a met cart test. Either fat oxidation is exaggerated in LCHF riders as Inigo San Millan says, or it’s under estimated in high intensities as we read in this article. But at the end of the day, the only thing I can say is that met cart test is a complicated test and not everybody conducts it the same way. Famous Jeukendrup has published on protocols to study it.
-
To me, understanding fat and carb oxidation rates are key because I do long endurance events like half ironman and the intensity calls for some fuel intake. If I would do a 10k race, I would not be as interested on this subject. Still helpful ton understand training less for the racing.
-
If fat yields more energy, I would like to see more often the perspective of the carbon bonds to explain the difference, glucose is a small molecule.
-
I do not understand the table and graph in fact#2
-
Even if we burn some fat at higher intensities, I don’t understand well how it is demonstrated
I thought I helped with Point#5 with the plot I got off Twitter from another exercise scientist. Since you’re a triathlete, maybe the best person to ask this question to is Alan Couzens. He should be on Twitter.
Agreed with most of @Kurbelix’s post above. A few other assorted thoughts on the topic:
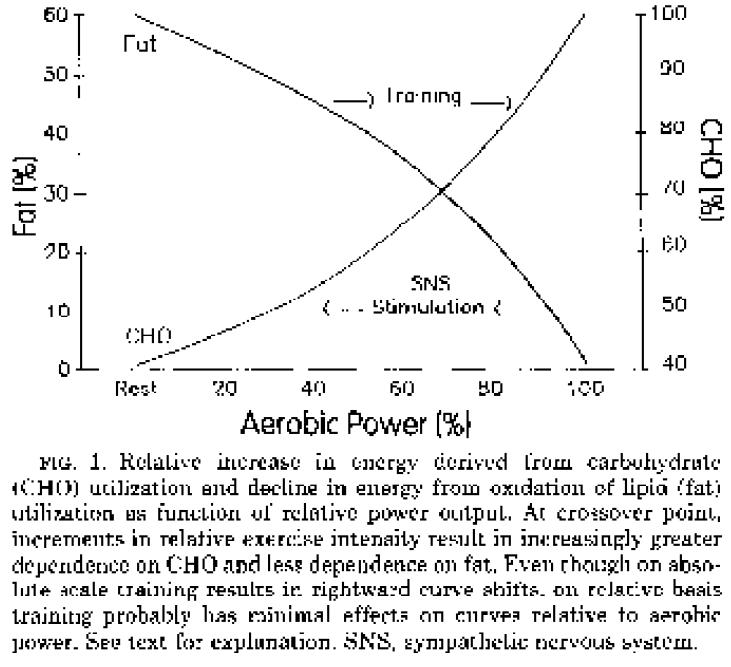
The fat and carb oxidation lines are on two different y-axes, therefore the cross-over point on that chart is just an artefact of the axis scaling. But the fat oxidation curve in general is a very relevant metric of fitness.
edit: Nevermind! Thought I was correcting a misunderstanding, but turns out I was the one who misunderstood! That’s what I get for scanning the thread.
FATmax (the power output or VO2 at which maximal fat oxidation occurs) is related to aerobic threshold (VT1/LT1) but like any other estimate of threshold, it’s protocol-specific. Meaning VO2 and power output will not be equivalent when translating from a ramp/step protocol to constant work rate continuous exercise.
Also the values of g/min for fat and carbs will shift with duration at the same intensity and same work rate. So they are useful as a benchmark when compared with the same protocol, but are not very precise when trying to estimate fuel requirements for racing/training.
Fuel utilization is very dependent on acute and chronic diet (as well as other factors: fatigue, time of day, heat, altitude/FiO2, etc.). But broadly, substrate utilization is proportional to availability. And yeah I’d agree that enhanced fat ox in someone on an LCHF diet doesn’t necessarily represent a structural change to ‘aerobic capacity’. What matters would be a test-retest in the same conditions to assess a difference in substrate utilization relative to the same workload and VO2.
Yeah there are a few different stochiometric equations, and you’ll find contemporary papers are frustratingly inconsistent with which model gets used. Here’s a good methodological paper on the topic of calculating metabolic energy expenditure with the various equations.
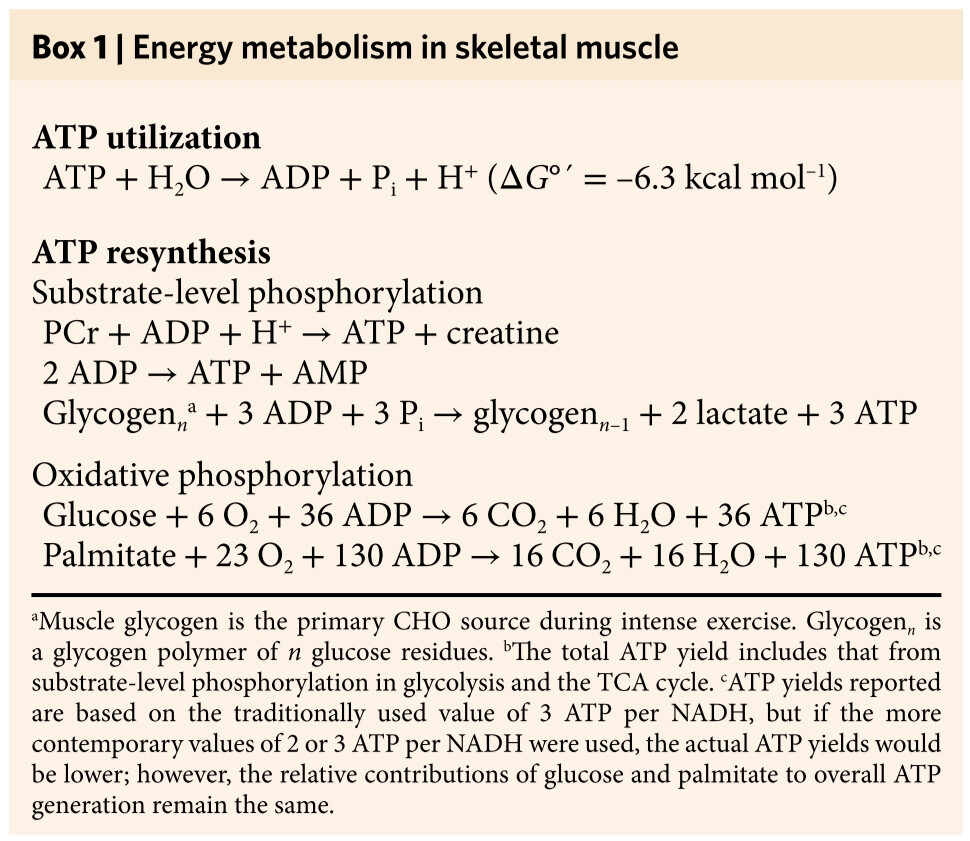
I’m far from confident in my biochemistry, but yes a fat molecule (palmitate, below) yields more ATP than glucose, but costs more O2 and takes longer to produce that ATP (rate limited).
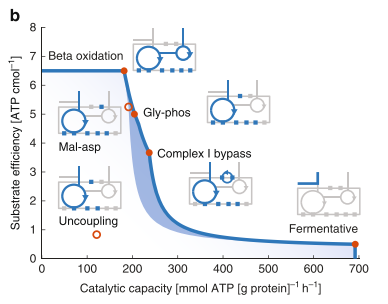
This is probably my favourite chart demonstrating the trade-off between metabolic capacity and substrate efficiency of the different pathways.
2 Likes
Is the characterization that cross-over effect is simply an “artefact” of axes scaling correct?
You did state you’re far from confident in biochemistry, but I would suggest many of George A. Brooks’ papers on the cross-over concept. ![]()
Isn’t the crossover concept related to the proportional contribution, ie. % of fats & carbs to overall energy provision? The chart above is in g/min on two different y-axes, therefore the particular crossover point (~310 W) on that chart I don’t think is meaningful?
edit: oooh, my bad. I missed that @Cary_Blackburn literally quoted you talking about the proportional crossover point at ~240 W. Not the visual crossover point of the two lines. That’s what I get for breezing through the thread. Withdrawn!
1 Like
No issues. The cross-over concept arising from the substrate use model is one of Prof. Brooks’ lasting contributions to biochemistry. Like any good model, it fits the experimental observations in well nourished individuals and even across species. I would not call it an artefact unless there was data to prove otherwise. And I’m not aware of a different model out there to explain anomalous observations.
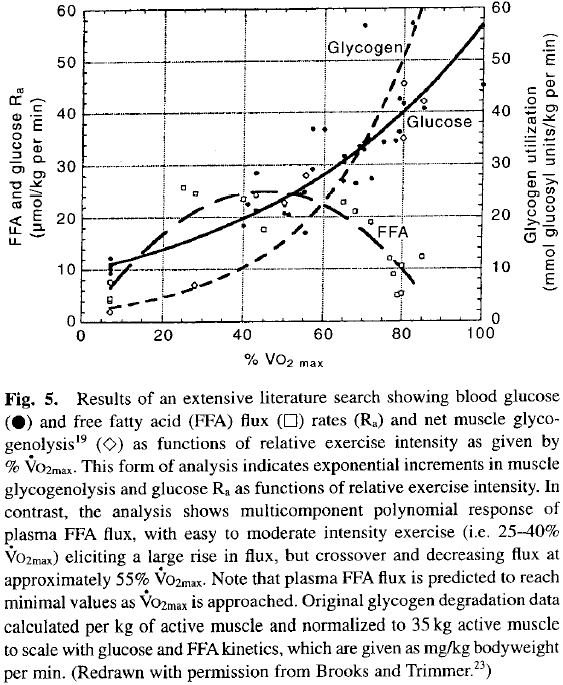
I think he defined the cross-over as the power output where CHO based fuels “dominate” over that derived from lipids. Percentages may make it easy to observe where that happens, but you could as well express the fundamental units in flux rates.
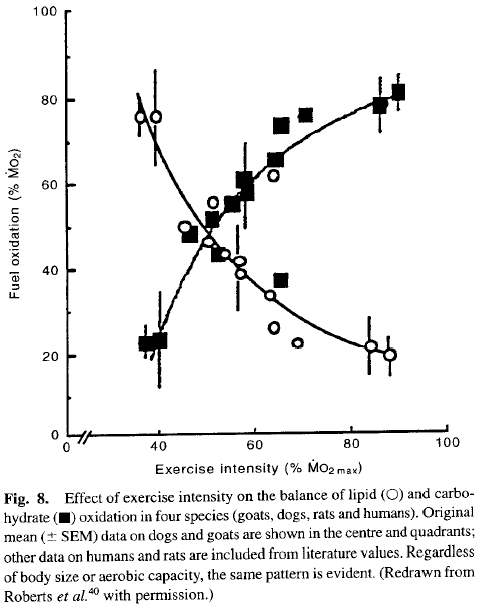
Here’s an example from a Brooks’ paper which I believe comes off from an “extensive” literature review (Source - DOI: 10.1111/j.1440-1681.1997.tb02712.x).
I also found a plot from his paper from 1994 with two ordinates in different scales of percentages (DOI: 10.1152/jappl.1994.76.6.2253 ) :
Or a paper from 1997 with just one ordinate of percentages
1 Like
just a short note while I think about it 
if training specifically at FATMAX is not of great interest for physiological improvement, I find a good spot for recurrent “standardized” efficiency (NP/HR) evaluation
2 Likes
Could you elaborate on this?
I sometimes do first thing in the morning
5 min warmup
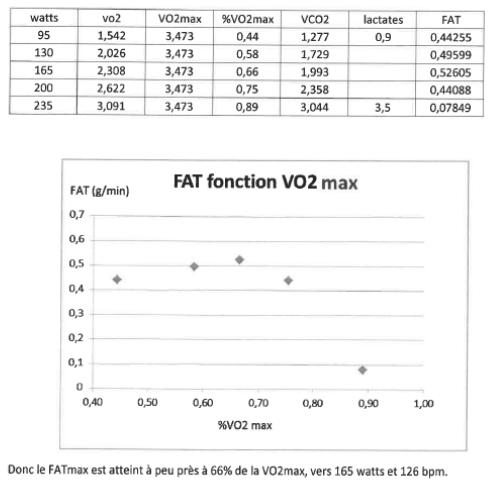
60 min @ “Fatmax power” which is between 160-170 W for me (determined via met cart and Jeukendrup protocol
2 min cool down
I follow the power/HR ratio (EF) for this effort along the season. Cadence can also influence a bit but not that much if I stay in my natural habits
If I am well (enough recovery, or maybe fitness improvements) I see my EF rising toward 1.5
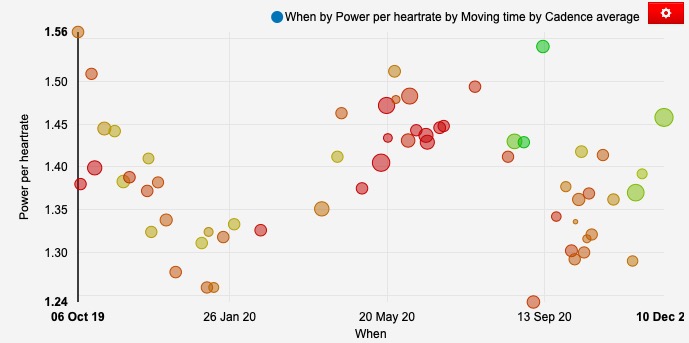
(before the 13th of sept 2020 it’s an artifact I was fasting for 3 days)
fatmax (see here if pic doesn’t show nfkb0.com ):
1 Like
Hi Remi
In your writeup, you mentioned “Jeukendrup protocol”.
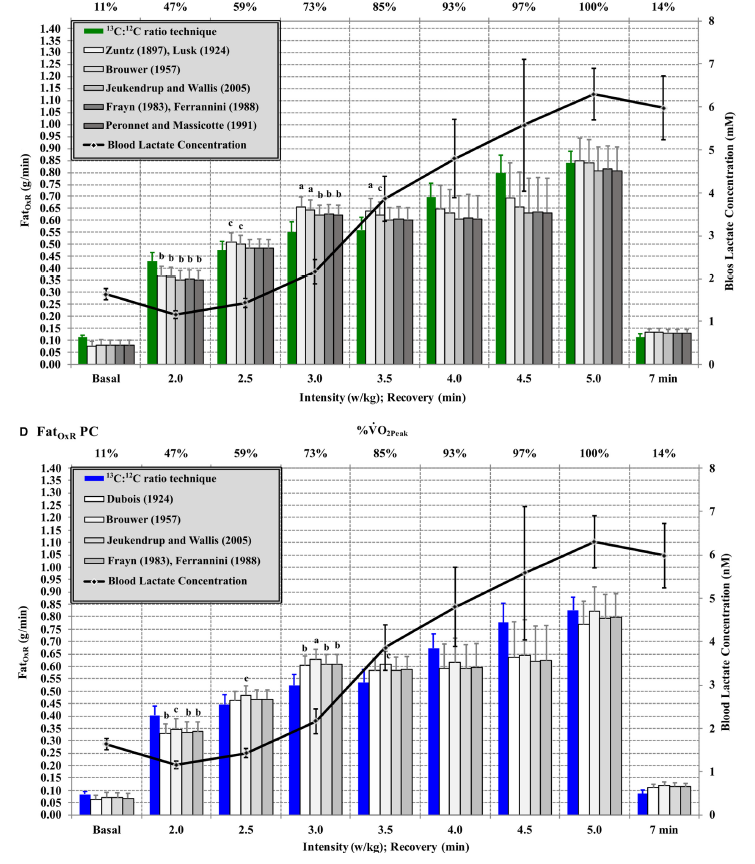
I was just reading this today which you might find interesting. Comparison of various stoichiometric equations to the reference CO2 labelled technique. https://www.researchgate.net/publication/332675072_Concordance_between_13C12C_ratio_technique_respect_to_indirect_calorimetry_to_estimate_carbohydrate_and_Fat_oxidation_rates_by_means_stoichiometric_equations_during_exercise_A_reliability_and_agreemen
Something that struck me mentioned in the paper was that the Jeukendrup and Wallis equation showed “best concordance” for CHO_ox rate but not FAT_ox rate. If you turn to page 12 of the paper, you’ll see the agreement % of the various equations.
The other thing that was also interesting are the graphs in figure 3. Clearly fat fuel oxidation doesn’t fall off a cliff as intensity increases. The reference technique shows some fat oxidation happening even at 100% VO2max.
There appears to be a healthy amount of uncertainty associated with computing fat oxidation rates.
2 Likes