Hi all, I have some curiosity about aerobic decoupling. I am somewhat familiar with its intending application to measure heart rate drift over a workout, but I have seen some odd behavior recently. The past few months nearly all of my rides have seen negative decoupling(my heart rate lowers at the same power as a ride progresses). Would there be any plausible explanation for this?
Thanks!
Several reasons including using it in the wrong way. Post an example screenshot.
I’m also interested to learn more, in particular analyzing specific intervals decoupling over multiple similar workouts, for example when you train for a marathon, checking HR Power performance on the “marathon pace” intervals in long runs. I understood that if there’s a drift of HR going up then probably the pace is little bit too high and cannot be sustained over marathon distance.
I don’t know if Intervals can perform such comparaison or if an AI tool would be needed.
You are warming up into the workout is one. As you warm up, your efficiency increases.
The power isn’t set high enough is another ![]()
![]()
Could be digestion also, happens to me all the time
Hola,
El desacoplamiento se utiliza para determinar cuál es tu eficiencia aeróbica, es decir cuando se trabaja a ritmos bajos o medios. Aquí es cuando se comprueba como responde tu base aeróbica viendo el desacoplamiento cardíaco. Si tienes buena base, rodando en zona 2 no pasaría del 2-3%, incluso llegando a estar muy próximo a 0.
Si nos fijamos en el desacoplamiento en entrenamientos con variabilidad de potencia y en partes determinadas de éste, puede que tengamos un desacoplamiento negativo. También podría ser, que empieces el entrenamiento con un pulso alto, por fatiga, y a lo largo de él se estabilice dando un desacoplamiento negativo.
I’ve noticed the same kind of “odd” decoupling (including negative values) pretty often when the route isn’t steady/flat. (Gravel & Road Cycling)
On hilly terrain, climbs + descents can skew the power↔HR relationship a lot:
- Downhills/coasting: power drops (sometimes to near-zero) while HR stays elevated for a bit → the overall math can get weird.
- Power surges on short climbs: HR lags behind power, then “catches up” later.
- Micro-variability (grade/wind/turns): makes it hard to interpret decoupling as a pure “HR drift” signal.
1 Like
I found this data field (“CHARGE”) yesterday; it might be helpful for anyone interested in live data, to pinpoint the moment. The description looks quite promising, though I haven’t had a chance to try it yet, using the Aerobic Decoupling - %HRR vs %6min MMP/Pace.
https://apps.garmin.com/apps/56480419-be66-42c5-92ad-6531fa6c130c
CHARGE is a scientifically advanced data field developed as part of a Master Thesis. It analyzes the relationship between external load (Power) and internal load (Heart Rate) in real-time to provide deep insights into your aerobic efficiency and autonomic nervous system status.
Key Features:
Real-time Cardiac Drift Analysis: Uses a hybrid algorithm (Linear Regression & Ratio models) to detect cardiac drift live during your ride. Helps identify fatigue, dehydration, or overheating before you feel it.
Aerobic Decoupling (Pw:Hr): Calculates long-term decoupling based on Joe Friel’s methodology. The algorithm automatically filters for Zone 2 efforts (56-75% FTP) and aggregates data into 3-minute buckets to ensure valid comparisons between the first and second half of your ride.
Heart Rate Kinetics (Tau): Performs active “Step Response” tests. Press the Lap Button before an interval to trigger the system. It detects power jumps (50W), waits for a plateau, and calculates Tau (the time constant to reach 63.2% of HR response) and the Step Amplitude to evaluate how fast your heart adapts to load.
Reactivity Score & Readiness: A smart algorithm that learns your individual heart rate response (slope/HRR) over time. It compares your current reactivity against a historical baseline (learning phase of 5 rides) to categorize your state as “Fresh,” “Normal,” or “Tired”.
Efficiency Metrics:
Physical: Joules per Beat (J/b) – Measures mechanical work per heartbeat .
Normalized: Efficiency Ratio (IF / %HRR) – Makes efficiency comparable across different athletes.
Full FIT File Support: All calculated metrics (Drift, Decoupling, Tau, Step Amplitude, Reactivity, Efficiency) are written directly to the FIT file for post-ride analysis in Garmin Connect or 3rd party tools .
Usage Note: For the most accurate Decoupling results, aim for steady-state endurance rides (Zone 2). For Kinetics testing, use the Lap button to signal the start of an interval.
3 Likes
After my first short, flat Z2 ride, I guess I’m officially part of the club now. The data perfectly reflects how the ride actually felt. Is this a lack of pre ride fueling? I guess multiple things.
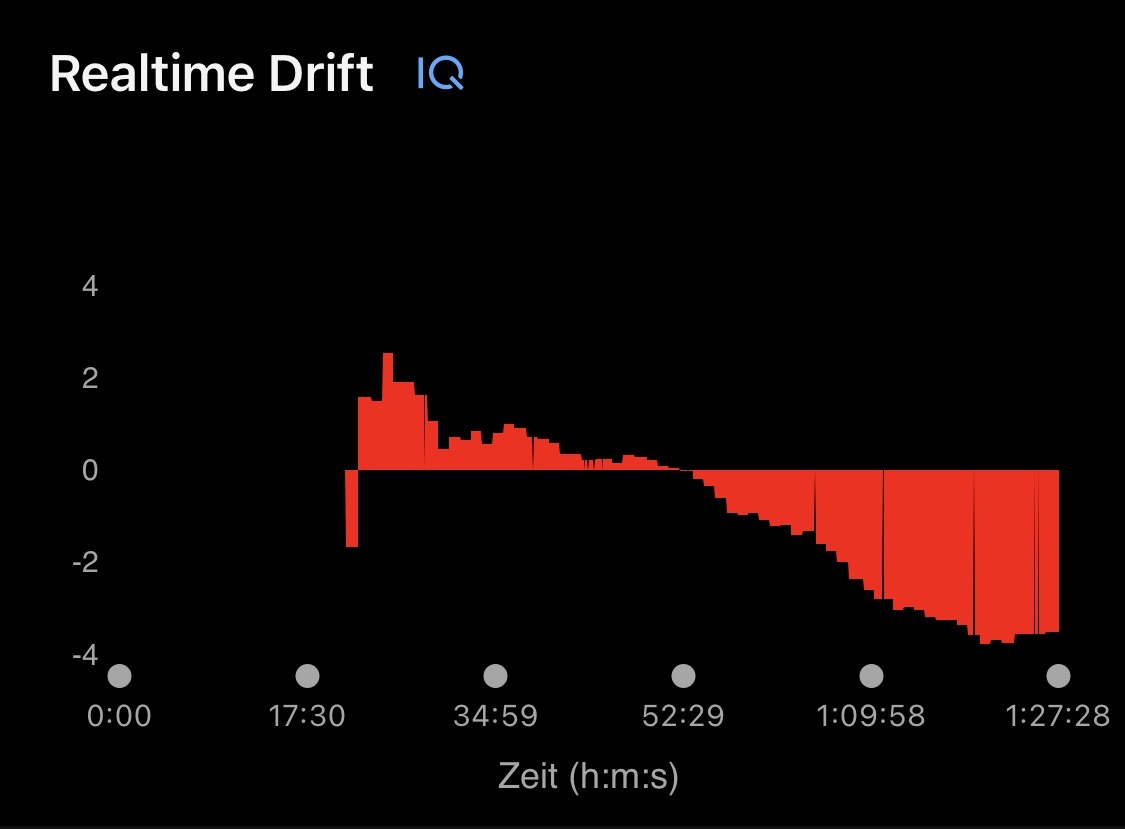
(in %)
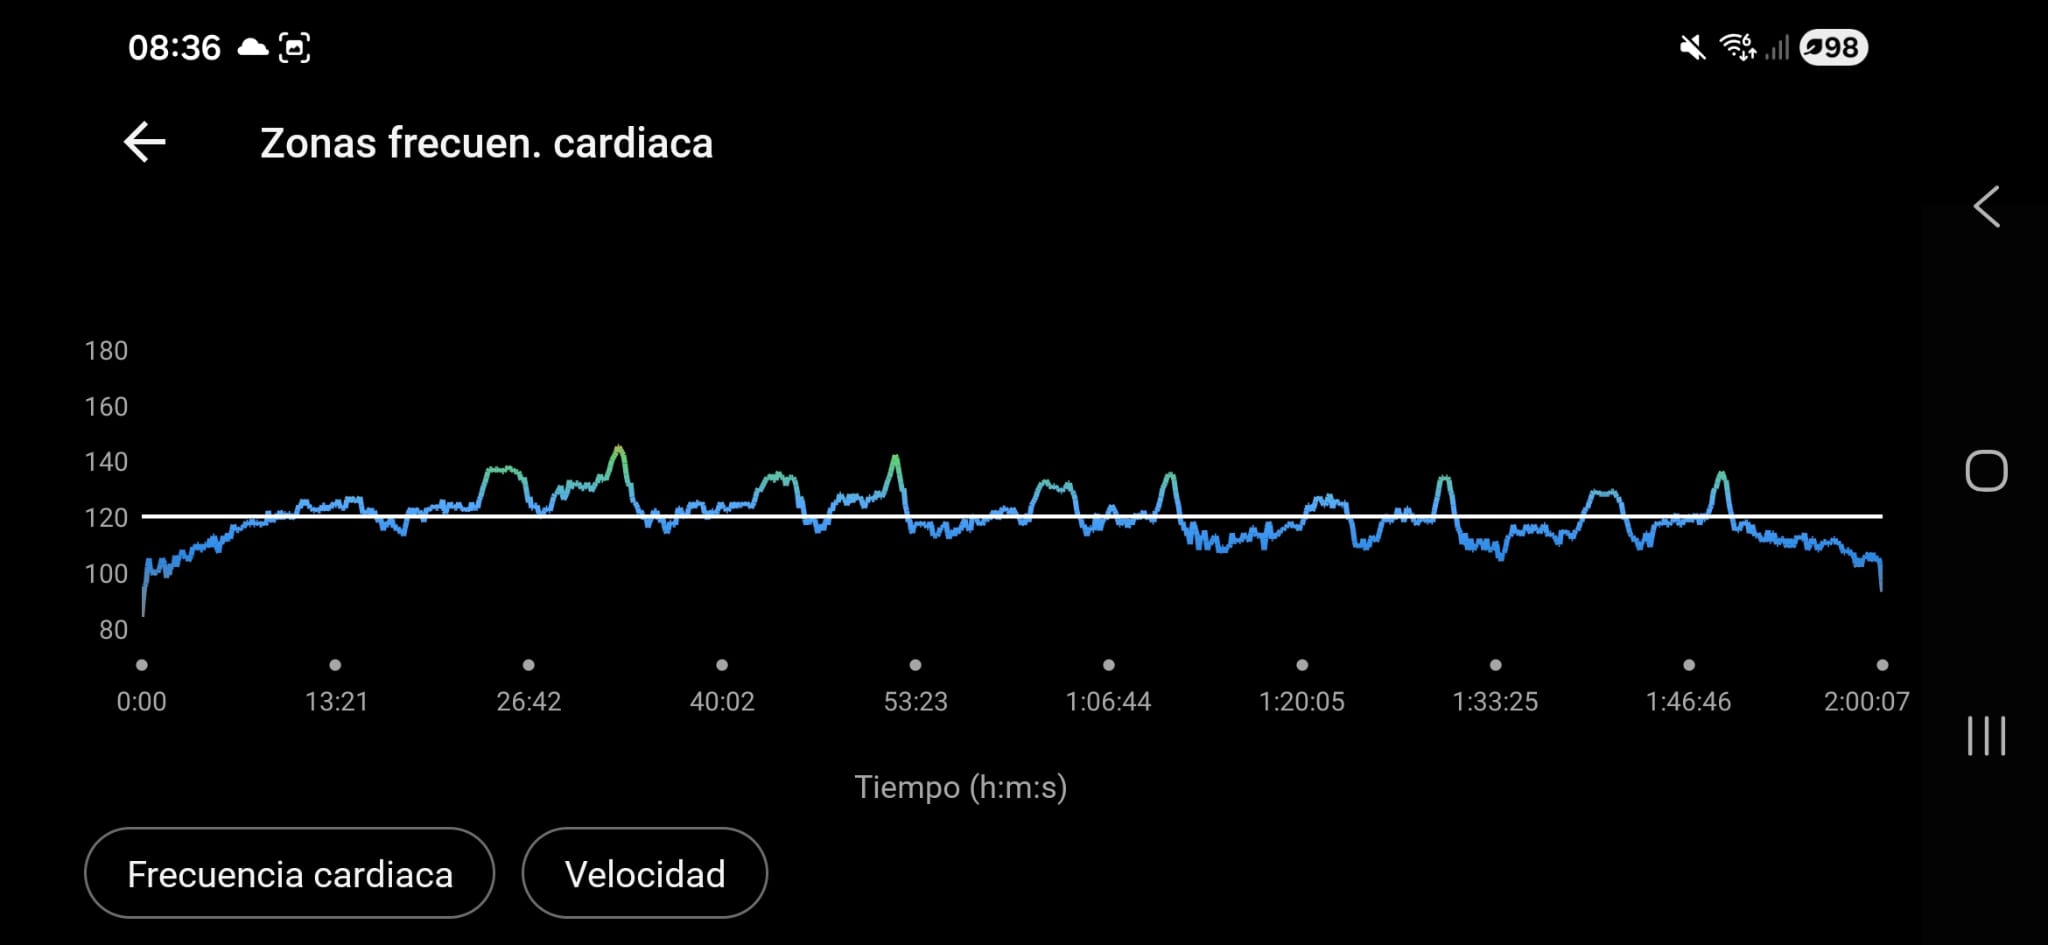
A mi me pasa igual, luego de 60-90 min la FC tiende a bajar para la misma intensidad. En la imagen por ejemplo hay 5 bloques con cambios de wats dentro de cada bloque, pero todos iguales y se ve como la FC es cada vez menor a lo largo del entrenamiento (entrenamiento en rodillo, modo ERG)
Por lo que estuve averiguando puede estar relacionado a que se estabiliza el volumen sistolico, o a algo de fatiga central o agotamiento de adrenalina.
Aun no tengo claro si es un marcador de buena durabilidad o es algo negativo, pero ando investigando el tema
What time of day do you usually train?
I usually train at 8 am or at 13 pm. This workout was at 13 pm, but i have seen this “negative decoupling” in the morning too.
It was an easy training, i was tired from the day before (4 hour sesion with intervals)
this looks awesome, I will definitely be trying it out!
Decoupling uses w/hr first half vs second half of ride.
Unfortunately, w/hr is not the same at all power levels. For example, if your ride is 220w first half and 180w second half, your decoupling will be way way way off.
It’s really a pretty rediculous metric, but I understand the spirit of it. If the ride is precisely the same power for the whole ride, i guess it makes sense. But w/hr has way way way too many confounding variables.
yes, I have seen this too ever since getting a power meter. Up until about 2 hours. Here is -5.9% decoupling of the main steady state interval
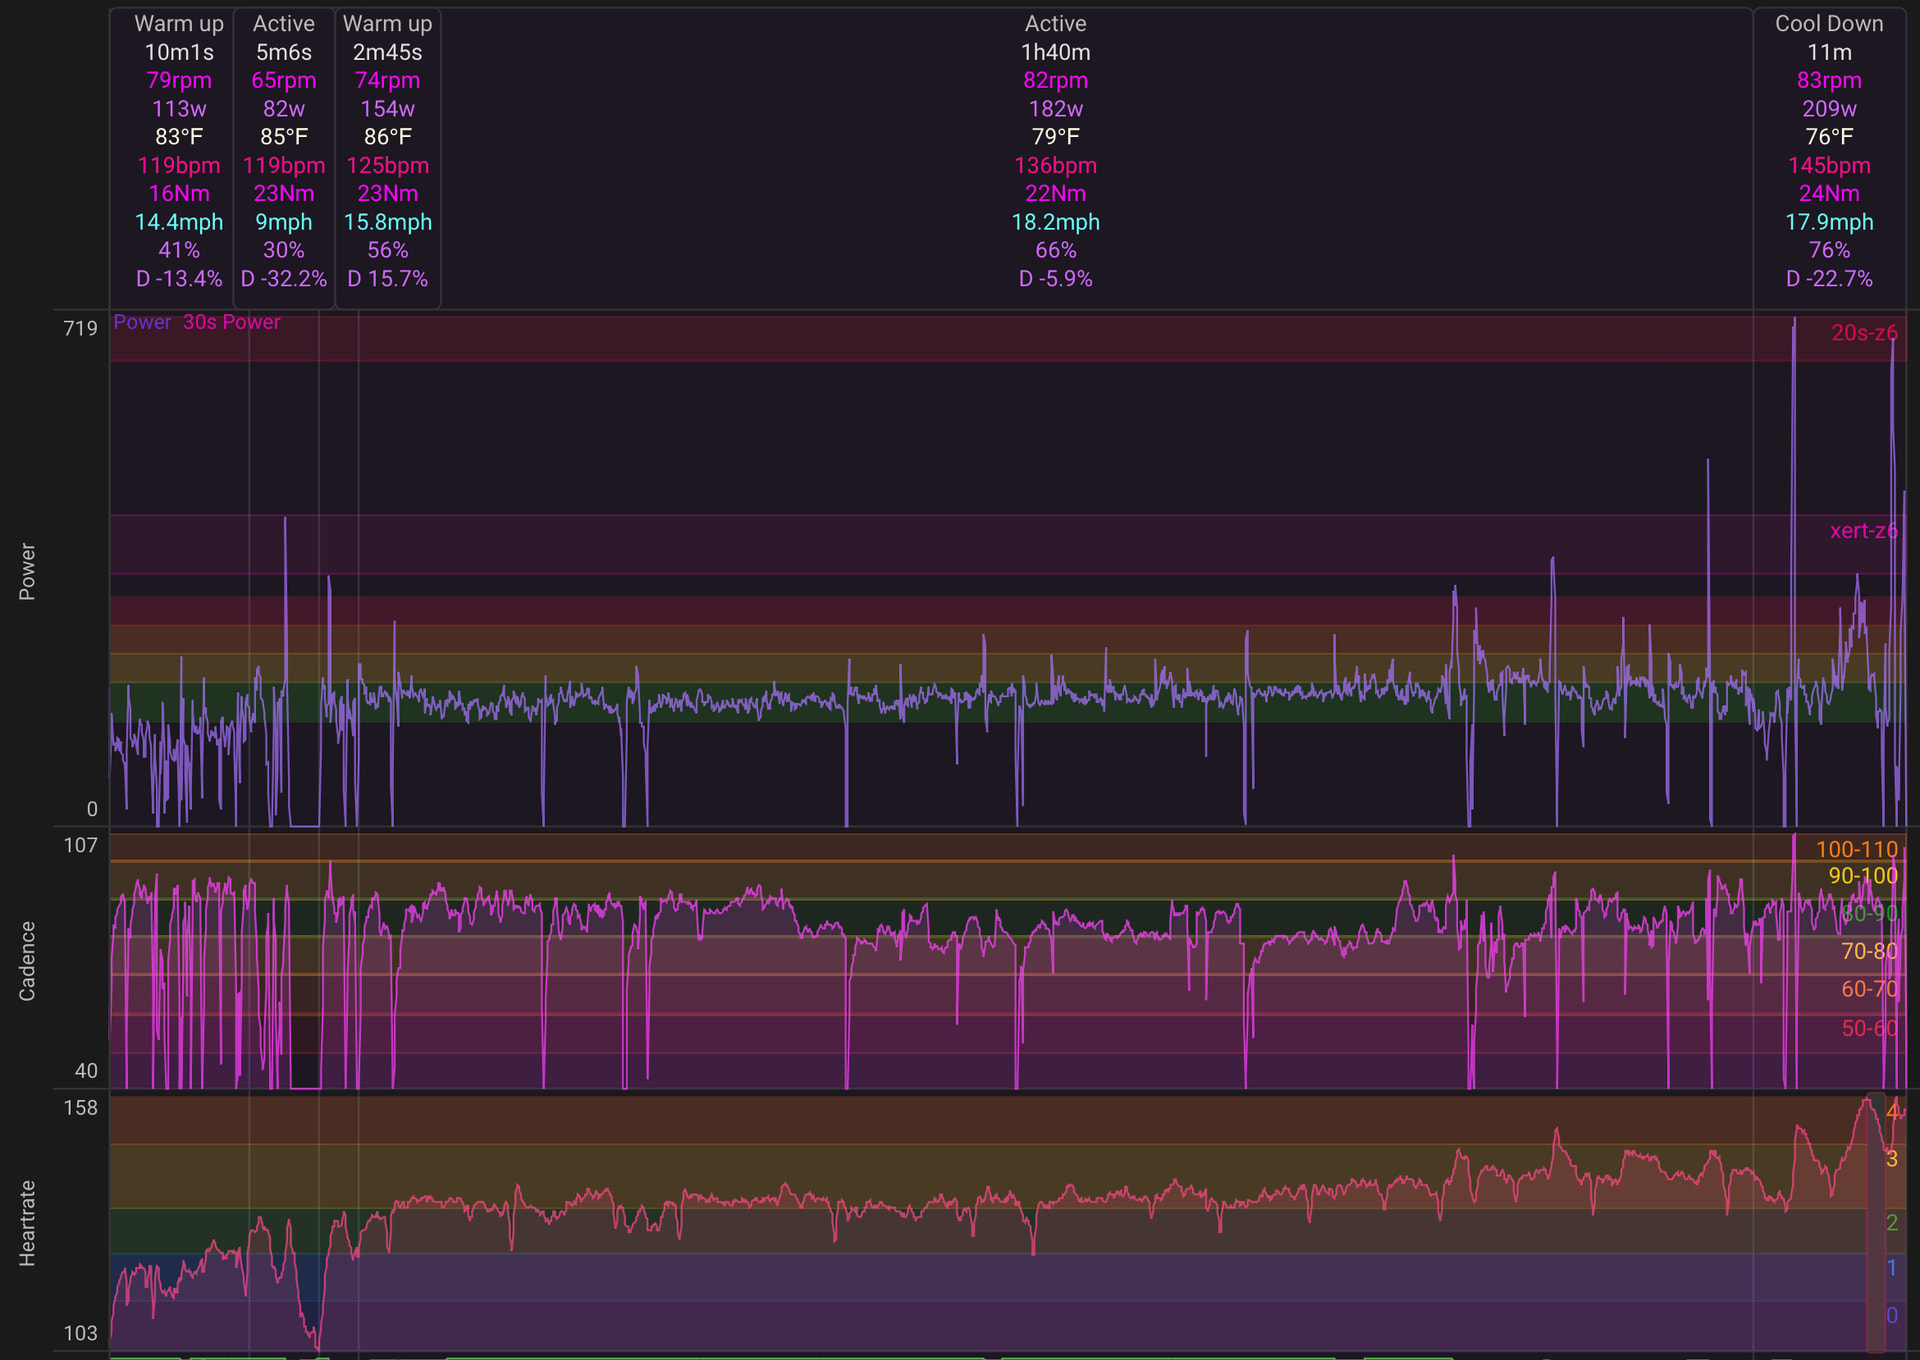
The reason why doesn’t matter, it just works that way for some people. Cadence dropped a little during the interval, and that certainly is one factor. Several coaches have hypothesized I start off using more fast twitch and then slowly become more efficient using slow twitch. But thats just a theory. The reason why doesn’t matter.
Another long endurance ride with two “Steady” efforts - 1 hour early at 0.1% decoupling and after two hours elapsed, 1h21m at -0.8%
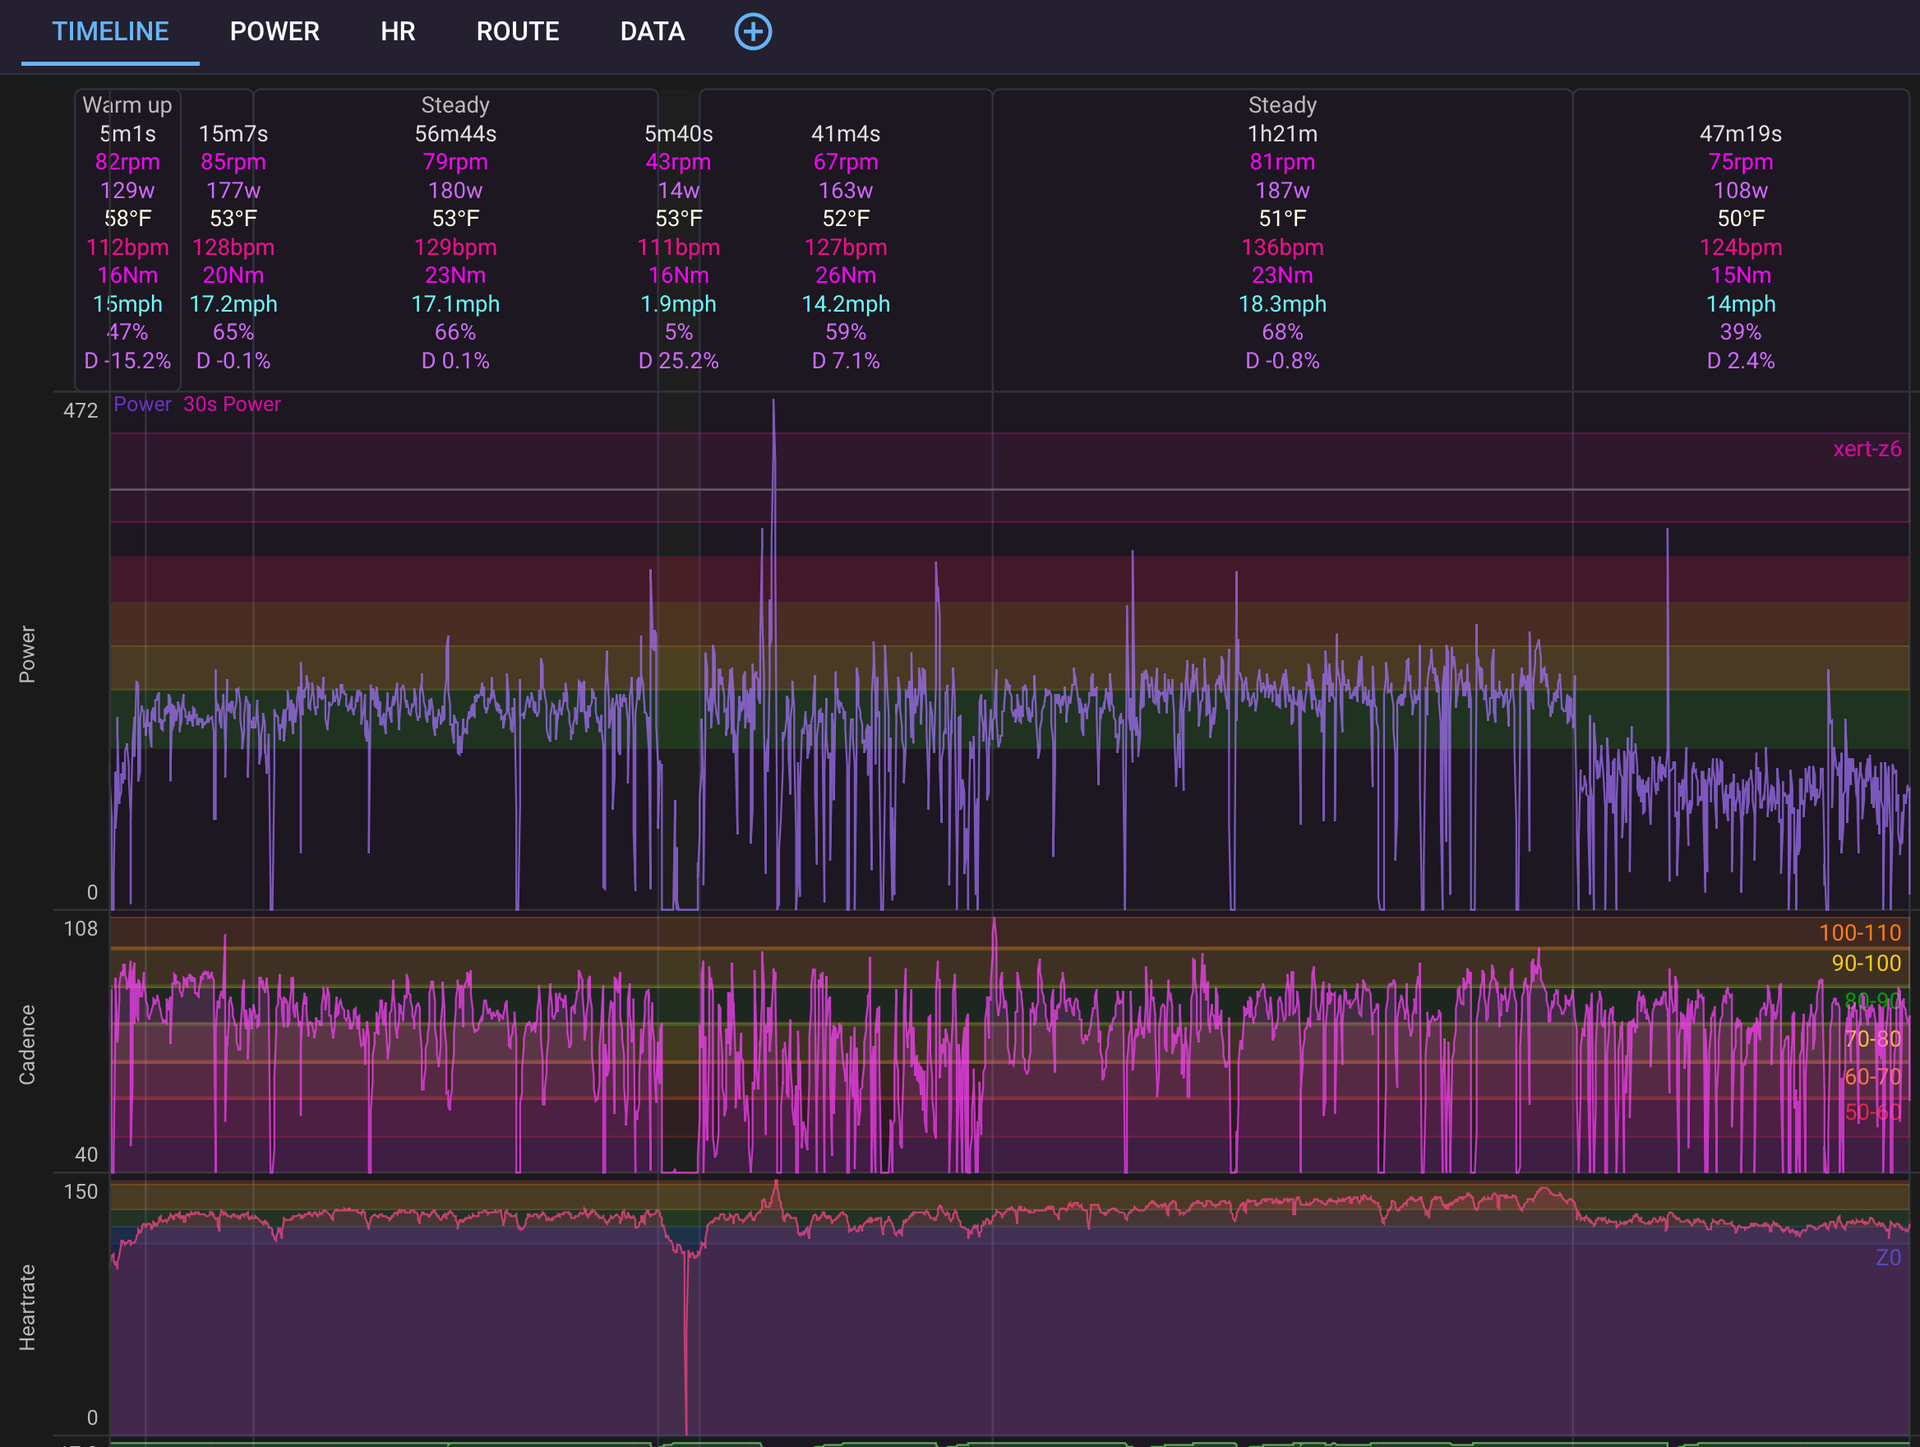
on the 2nd Steady effort, cadence actually increases during the 1h21m.
Some people are just wired that way.
I actually built a arduino device that bolts into the bottle bosses of your bike. And I learned that as you warm up, your bike motion REALLLY smoothes out. I’m guessing it’s due to tendons and ligaments and muscles all warming up, relaxation, etc. Although thats just a guess. But the data was really clear that as the ride goes on, bike movement goes down per watt and per cadence.

2 Likes
I noticed similar (but not as scientifically measured) when I first put my trainer on a rocker plate.
The whole platform moves significantly less after warming up than it does in the warm up phase of a ride.
I spent quite some time concentrating on reducing the amount of movement I was causing whilst riding. At first that took a very conscious effort and was, as the phrase goes, engaging my core more than I was used to. But it worked.
It shows up most when someone else jumps on to try it for the first time. Even at a fairly moderate intensity, it is all over the place for a rocker plate novice.
You can ask chatgpt to do a physics calculation of the mass movement translated to actual KJ per hour and it’s pretty minimal. I ran the calculation and didnt see it as something worth optimizing further.
1 Like