Would it be possible to let the user specify the Y axis, or have it auto-zoom after using the mouse to highlight a section of the ride? Currently the plots are too zoomed out to see details between rides. Awesome feature though, thank you!
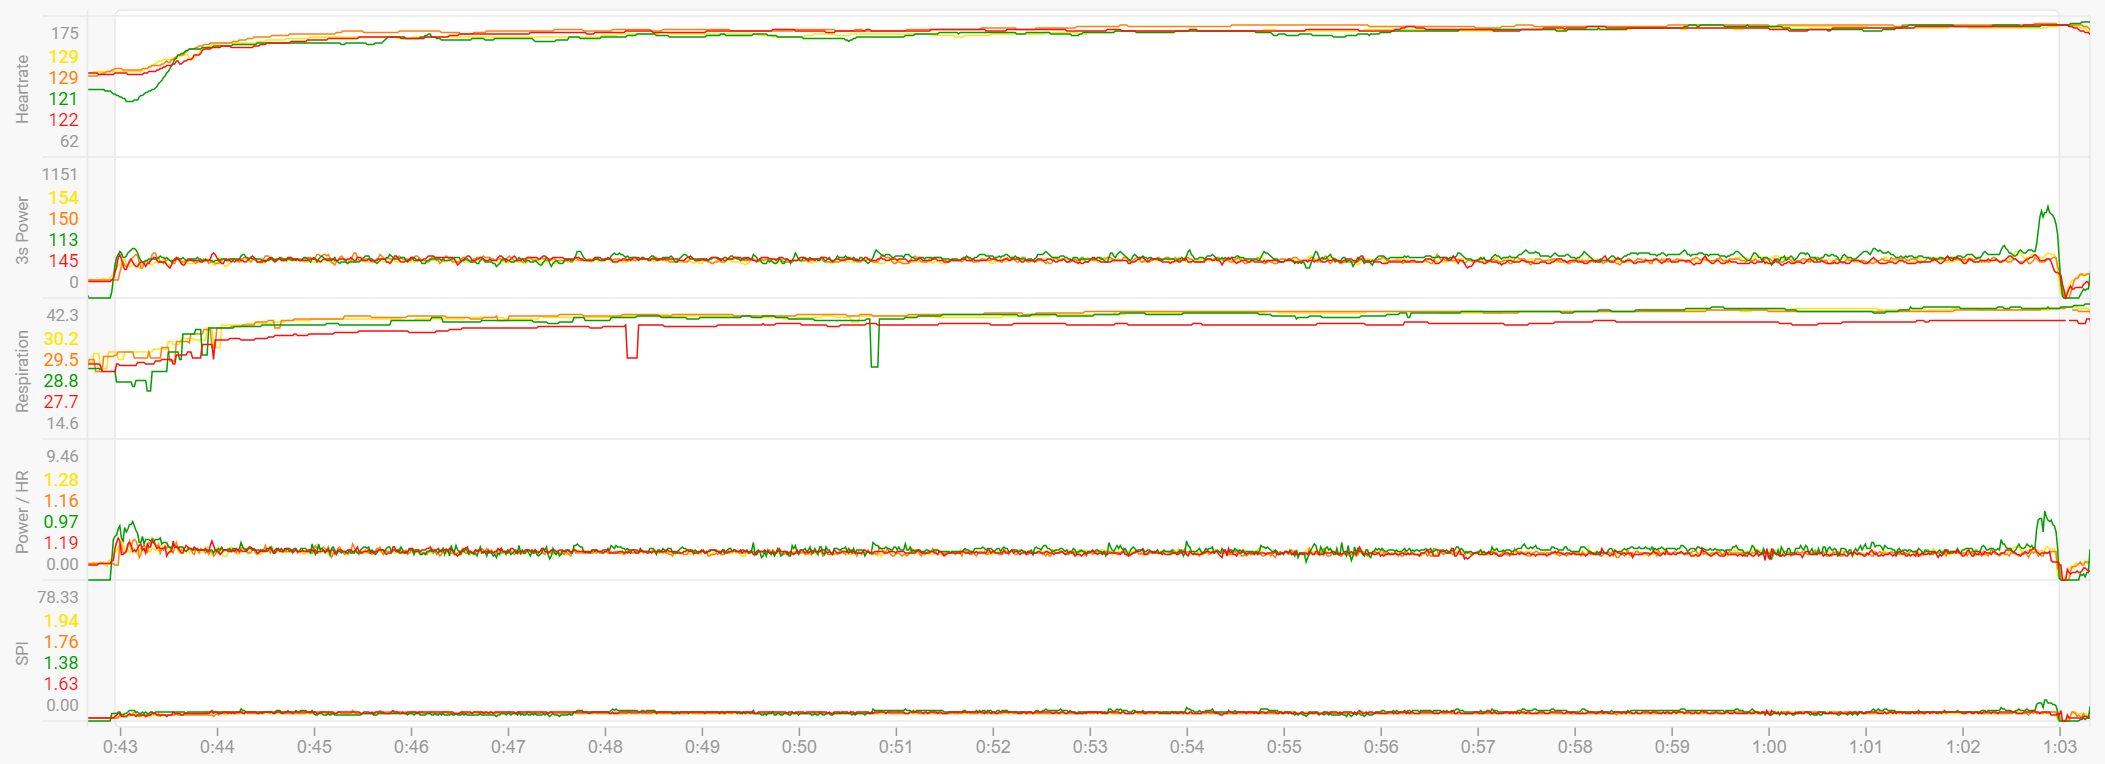
Did you ever figure this out? I’d like to do the same. Cheers
1 Like
No… Maybe someone else could help us
I saved many sets of activities for comparison, but unfortunately upon reopening them or simply refresh the browser page, I lose the intervals selection. All are selected after. I want to save only certain laps / intervals for comparison. Is there a solution to this?
Hi, Is it able compare two or more activities on one map background? (For compare distance from each other)
1 Like
Hi
I would also like to compare 2 activities and see them on the same map.
My use case is I race cyclocross and a friend that finished ahead of me in a recent race shared his FIT file and I have the race portions lined up - but can only see his “dot” or my “dot” on the map. What I would love to see is my “dot” chasing his “dot” so I can visually see where he is gaining time on me each lap.
I hope that makes sense.
thanks Peter
Hi! This work is AMAZING! THANK YOU!!
I am comparing 2 files that were dual recorded. One in my training app of choice using the power from my Turbo trainer, and one recorded on my bike computer connected to my power pedals 
Is it possible to overlay the cadence trend on top of the power trend in compare activities?
I can create separate charts for each, but not with both power and cadence on the same chart
Im looking to see if cadence affects the offset between the power readings of the two devices
THANK YOU!!
There’s an activity chart made by @Manuel_Oberti called ‘Cadence Vs AvgPower’ that plots what you want.
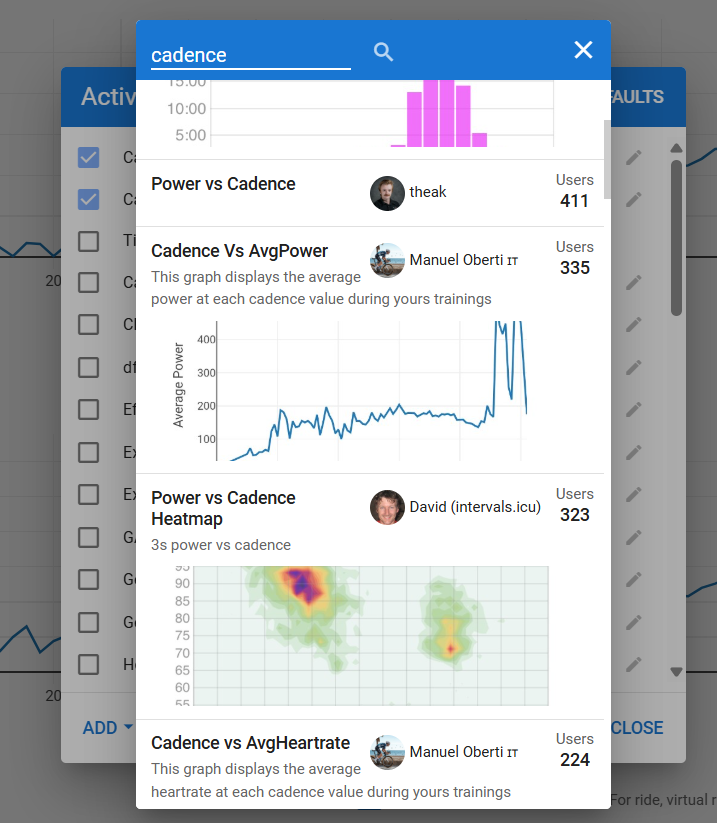
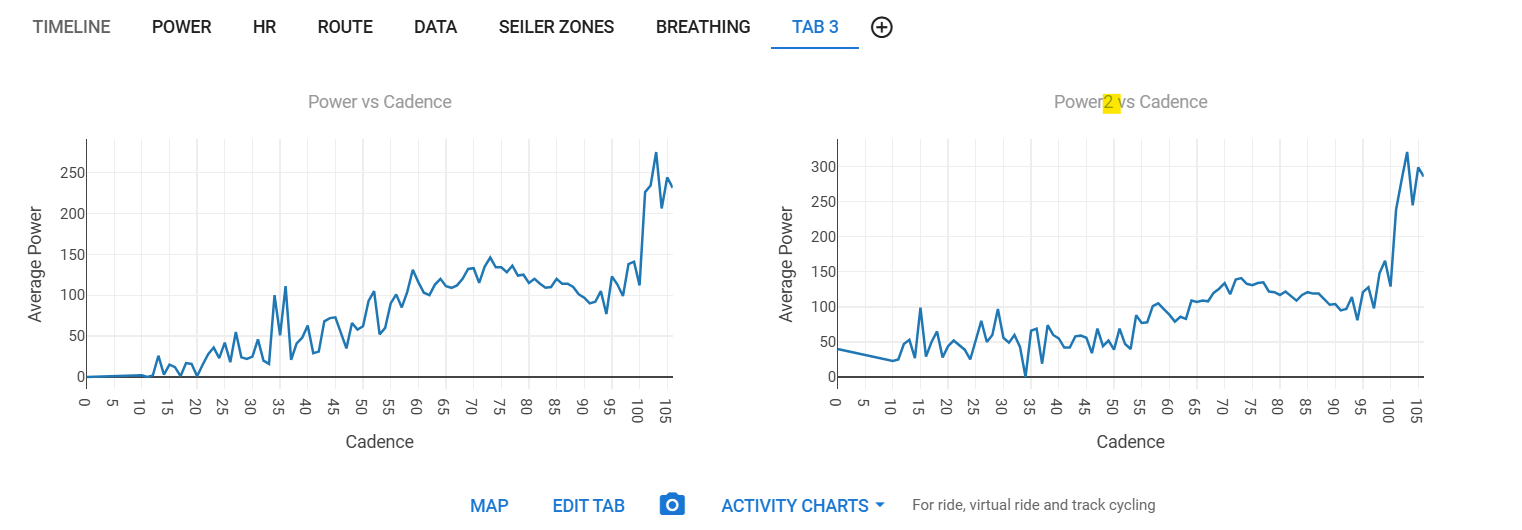
I made a second version of it where the source for power is the ‘power2’ stream.

This was a quick idea I had. I didn’t have time to merge both streams in one chart, but it should be doable for someone with better knowledge of JS and Plotly then me.
This allows you to have both charts alongside each other for comparison. Below is an example of a comparison between Assioma Duo recorded with my Edge and simultaneously 4iiii single sided recorded with my Coros watch.
Now, your next question may be:
I have 2 separate files and I don’t have both Power streams in one activity, what goes?
A recent feature in Intervals allows you to export csv streams from an activity and merge that csv in another activity. So open your ‘secondary’ file, go to the data page and select the Power stream to download to csv. Open the csv with a text editor and replace the ‘header’ ‘watts’ with ‘secondary_power’ and save it. Then go to your primary file and upload that modified csv to it. You now have both power streams in one activity and you can see them together in different places. Custom plots, Activity Power page and the Custom activity charts.
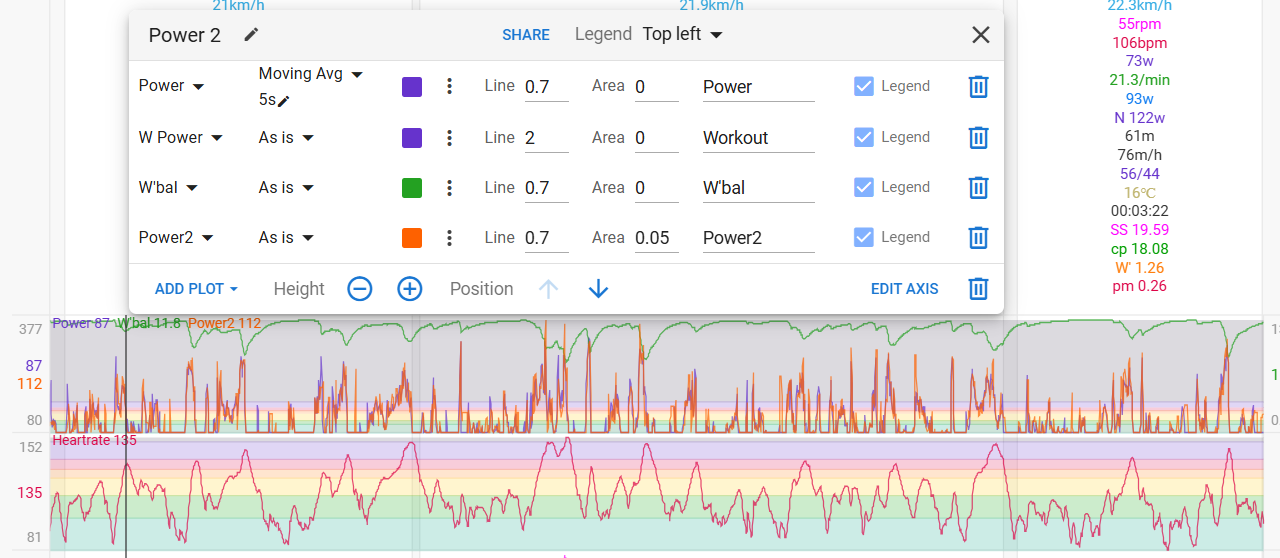
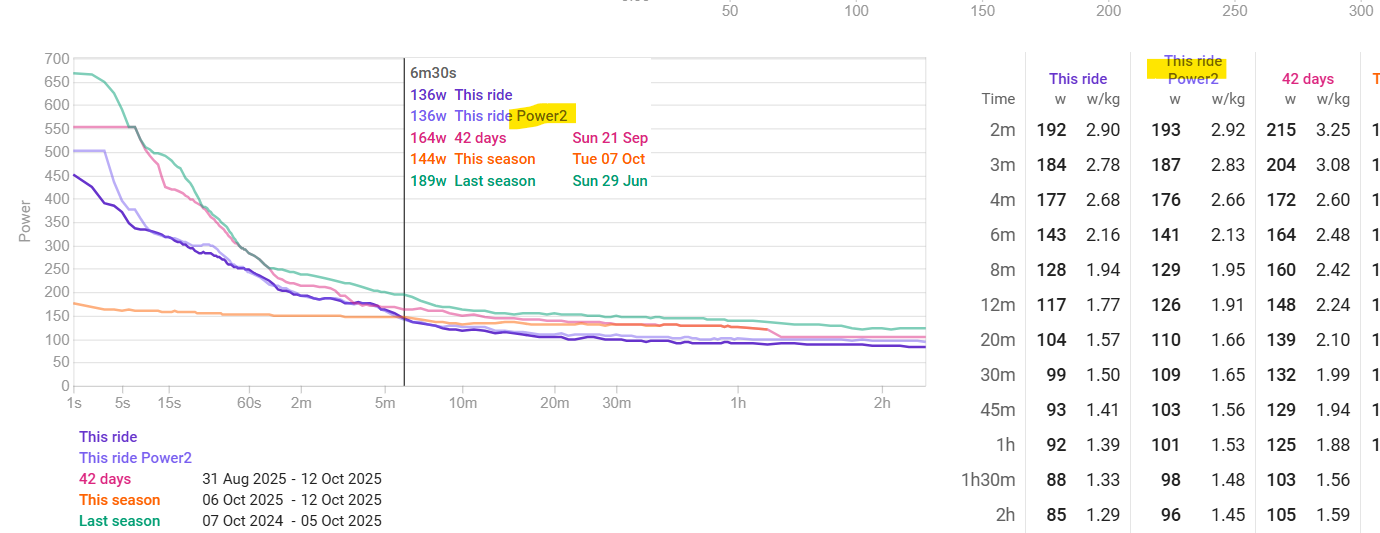
Possibilities become almost limitless…
There is one caveat!: You need to make sure that the streams are synced. I use gotoes to make sure that the start time for both files is the same but you can also check that on fitfileviewer and then delete the first couple of seconds in the csv or add some dummy zero lines to make sure both files are in sync.
2 Likes
Thanks! I’ll see if I can get my head around this  it may be a little too complicated for my
Absolutely love this feature—thank you!
I’m both a runner and a cyclist. On Tab 1, I’d like to compare my cycling races (which I already have set up). On Tab 2, I’d like to compare my running races.
However, when I start setting up Tab 2, it automatically copies my cycling races from Tab 1. If I delete the cycling races from Tab 2, they’re also deleted from Tab 1.
How can I completely separate the activities in Tab 1 from those in Tab 2?
Firstly, this is an awesome feature.
Is it possible to truncate the actives to start and end at a particular location?
I ask, as recently I moved house, but a regular ride starts from the same point. If I could truncate my old rides, then I would be able to compare them with my rides since moving house.
I’m not sure that the move time setting would be right, if it is, could someone please walk me though using it?
Hi,
how can I sync the activities? I recorded a workout on trainer and had pedals with power measuring recorded on Garmin. The start is difficult to sync so I would like to sync them.

Click on one of the dates at the top, you will then get a pop up where you can move it forward/back in 5 or 1 seconds increments
Absolutely love this feature—thank you!
I’m both a runner and a cyclist. On Tab 1, I’d like to compare my cycling races (which I already have set up). On Tab 2, I’d like to compare my running races.
However, when I start setting up Tab 2, it automatically copies my cycling races from Tab 1. If I delete the cycling races from Tab 2, they’re also deleted from Tab 1.
How can I completely separate the activities in Tab 1 from those in Tab 2?
When I select a portion of an activity, where can I find the averages for that selected segment?
Hey there, this functionality is awesome. I want to echo that it’d be great to “save” comparisons across tabs, so that I can have different sets of activities (e.g. my 20min intervals on one tab; my 4min intervals on another) across tabs, or across “saved” comparisons, similar to this ask above:
Absolutely love this feature—thank you!
I’m both a runner and a cyclist. On Tab 1, I’d like to compare my cycling races (which I already have set up). On Tab 2, I’d like to compare my running races.
However, when I start setting up Tab 2, it automatically copies my cycling races from Tab 1. If I delete the cycling races from Tab 2, they’re also deleted from Tab 1.
How can I completely separate the activities in Tab 1 from those in Tab 2?